Squeeze into Supply
A record short liquidation event ignited a 26% rally off the mid-August low, and real money paid for it: the strongest ETF intake of the year, coins leaving exchanges, every cohort accumulating. What stands between this recovery and the January high is one band of supply between $81K and $86K.


Executive Summary
- A record single-day short flush ignited the rally, which then burned through the liquidation clusters stacked across its path.
- The move was funded: $2.23B of ETF creations over the squeeze window, coins leaving exchanges, and every wallet cohort accumulating at once.
- The cycle composite has climbed out of its cool band, large caps led the rally, and the link to equities collapsed.
- Overhead structure converges: cost-basis shelves, re-laddered asks, the dealer gamma flip and the liquidation shelf all sit between $81K and $86K.
- Options price a hold into late September. The tests: $83.3K above; the $70.0K cost basis and the $62K-65K floor below.
Ready to get ahead of markets and sharpen your foresight? Try Glassnode. Sign up or talk to sales.
The Flush That Lit It
A Record Short Flush
In dollar terms, August 19, 2026 was the biggest day of short liquidations our feed has recorded since 2019. Across the squeeze window, 85% of everything liquidated was short side. One caveat belongs beside every liquidation read: our feed aggregates the major centralized exchanges and does not include Hyperliquid, so the true total ran higher than anything we can measure.
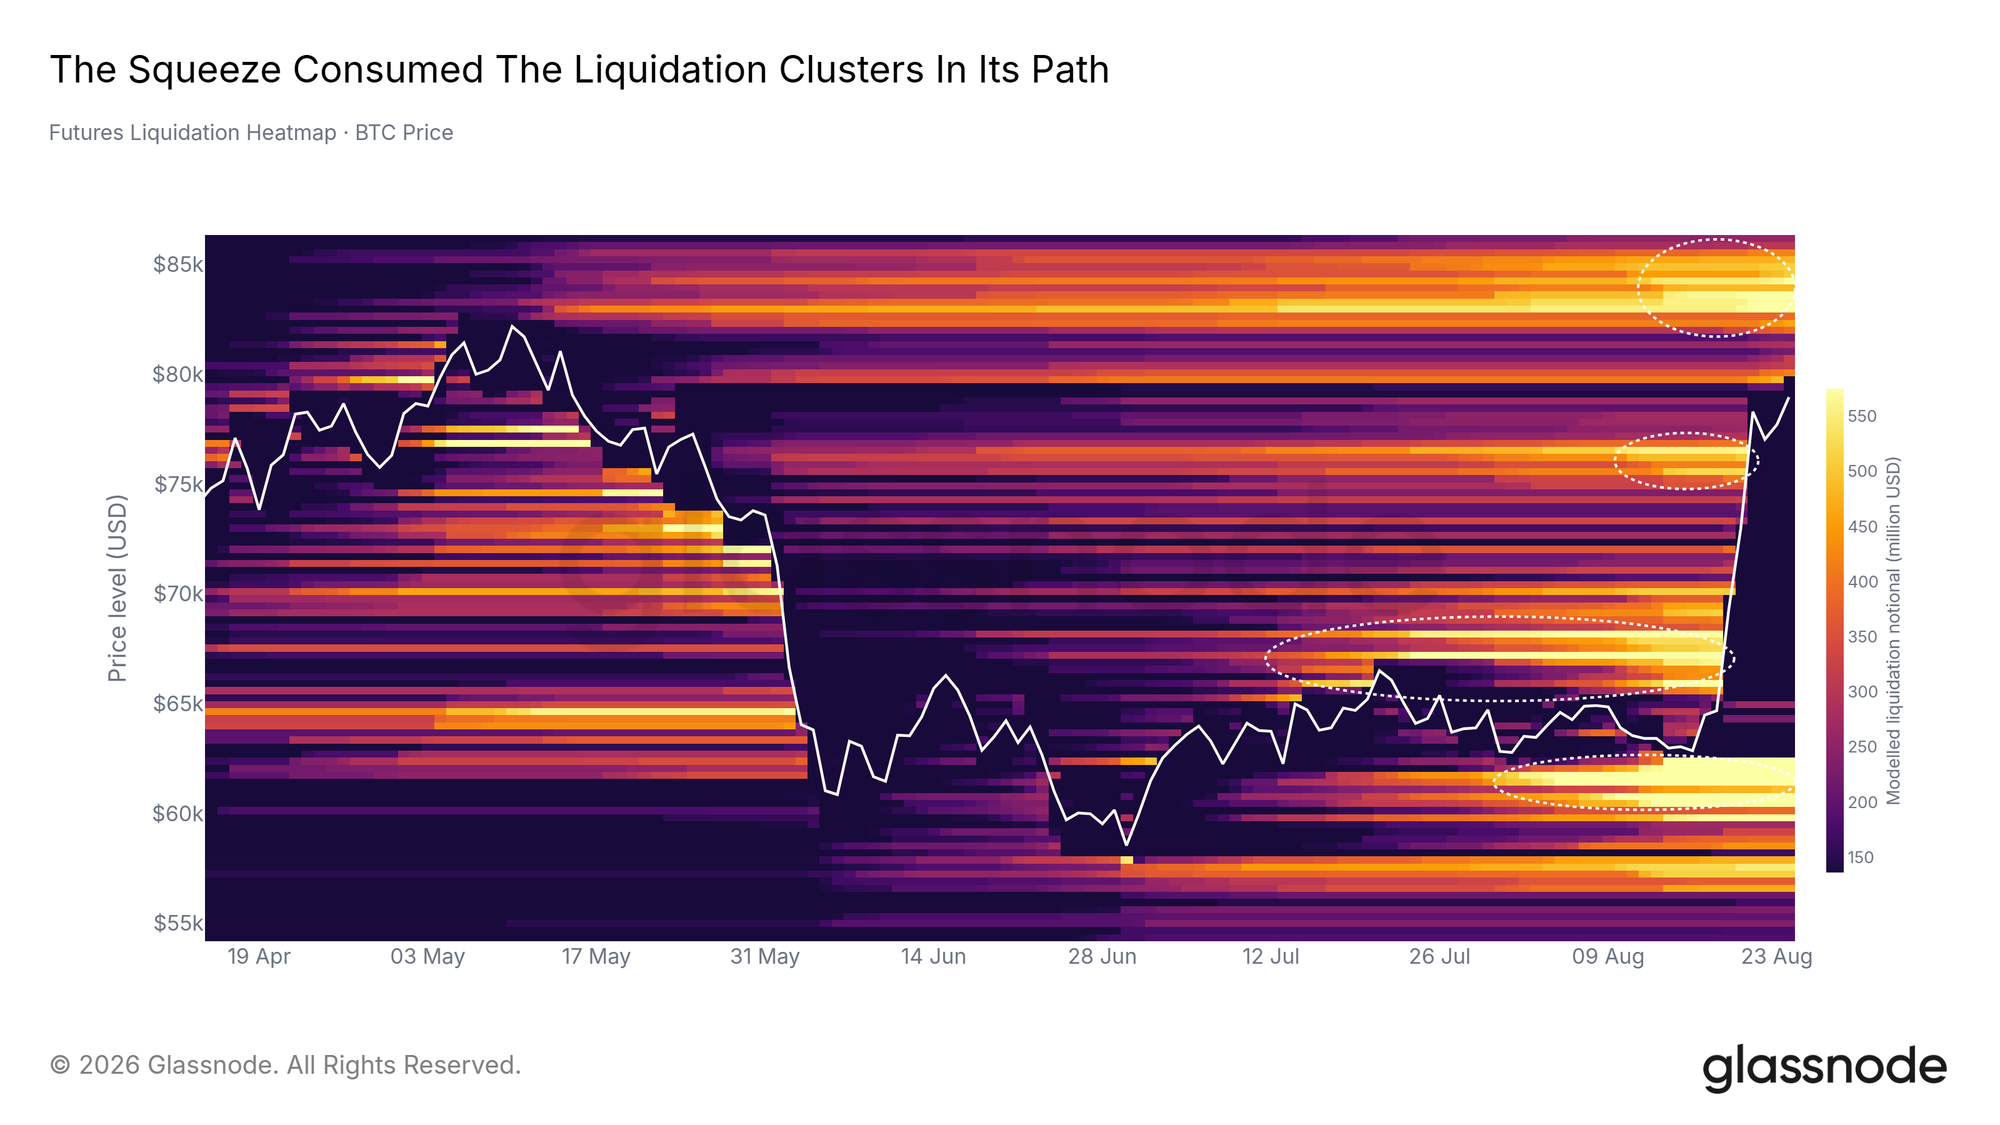
The heatmap shows what the move did with that fuel. The rally consumed the modelled liquidation clusters in its corridor, cutting the fuel in its path by 86%. What survived sits at the edges: one dense shelf of short liquidation levels at $82K-86K just overhead, and a band of long liquidation fuel left behind at $60.5K-62.4K below the market.
Leverage Burned Off
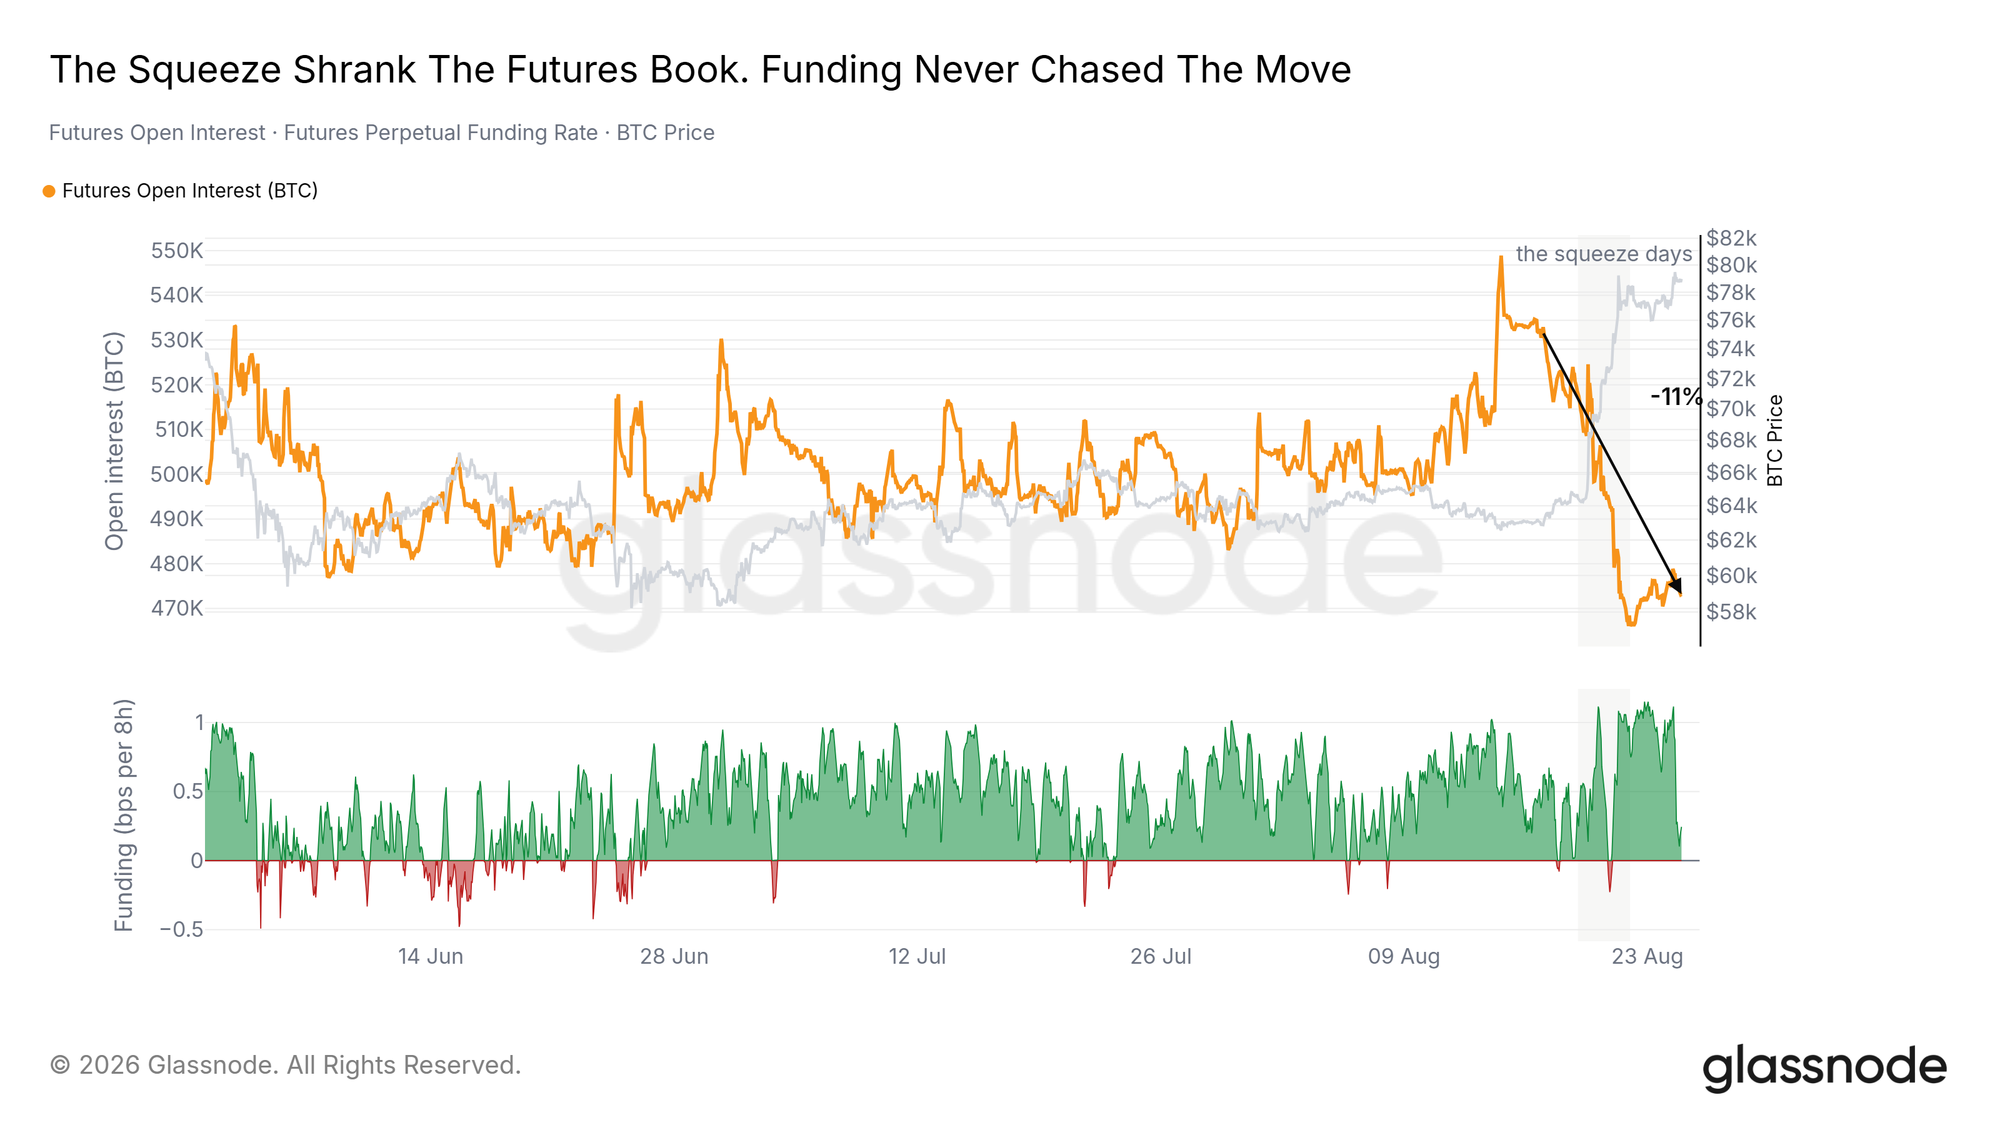
The squeeze deleveraged the market it ran through. Measured in coin, Futures Open Interest shrank 11% across the window, while the dollar book grew only because price rose. Liquidated shorts were not replaced with new contracts.
Funding tells the same story. The perpetual funding rate barely left its neutral baseline through the entire move and still printed occasional negative hours afterward, so the rally was never chased with fresh longs. This was a stop-cluster flush; the funding tape shows no crowded short base before it and no long chase after it. A rebuilding coin book alongside rising funding would be the first sign that leverage is crowding back into the move.
The Money Behind the Move
The ETF Rail Reopened
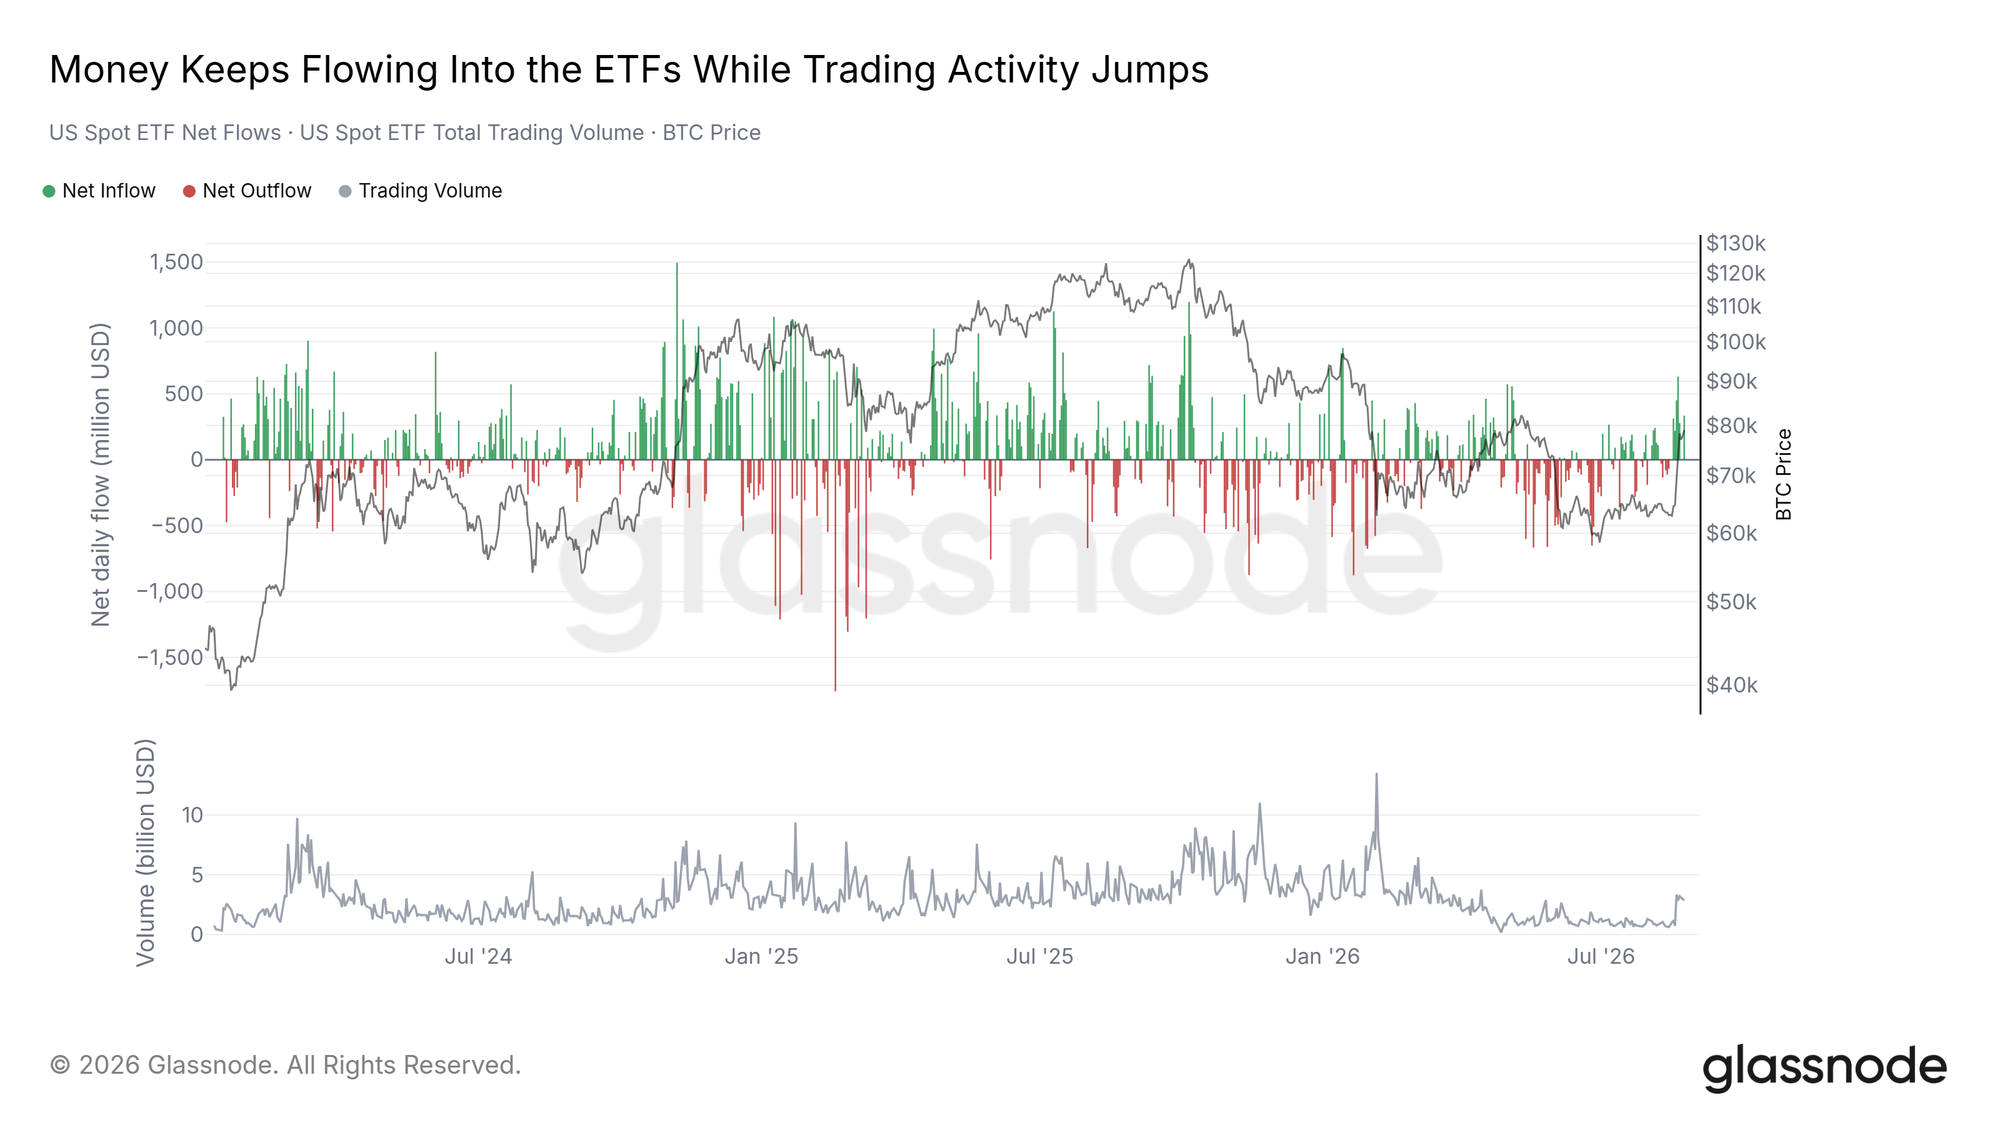
The rally arrived with money behind it. US spot ETFs took in $2.23B over the squeeze window without a single outflow day, the strongest seven-day intake of the year. Its best single day was the largest creation since January 14, 2026, and price reclaimed the Short-Term Holder Cost Basis on the way.
Activity jumped without getting near the old records: daily turnover across the squeeze week averaged $2.4B, roughly half the January-February pace and a third below its level of last August.
The Handoff Up the Ladder
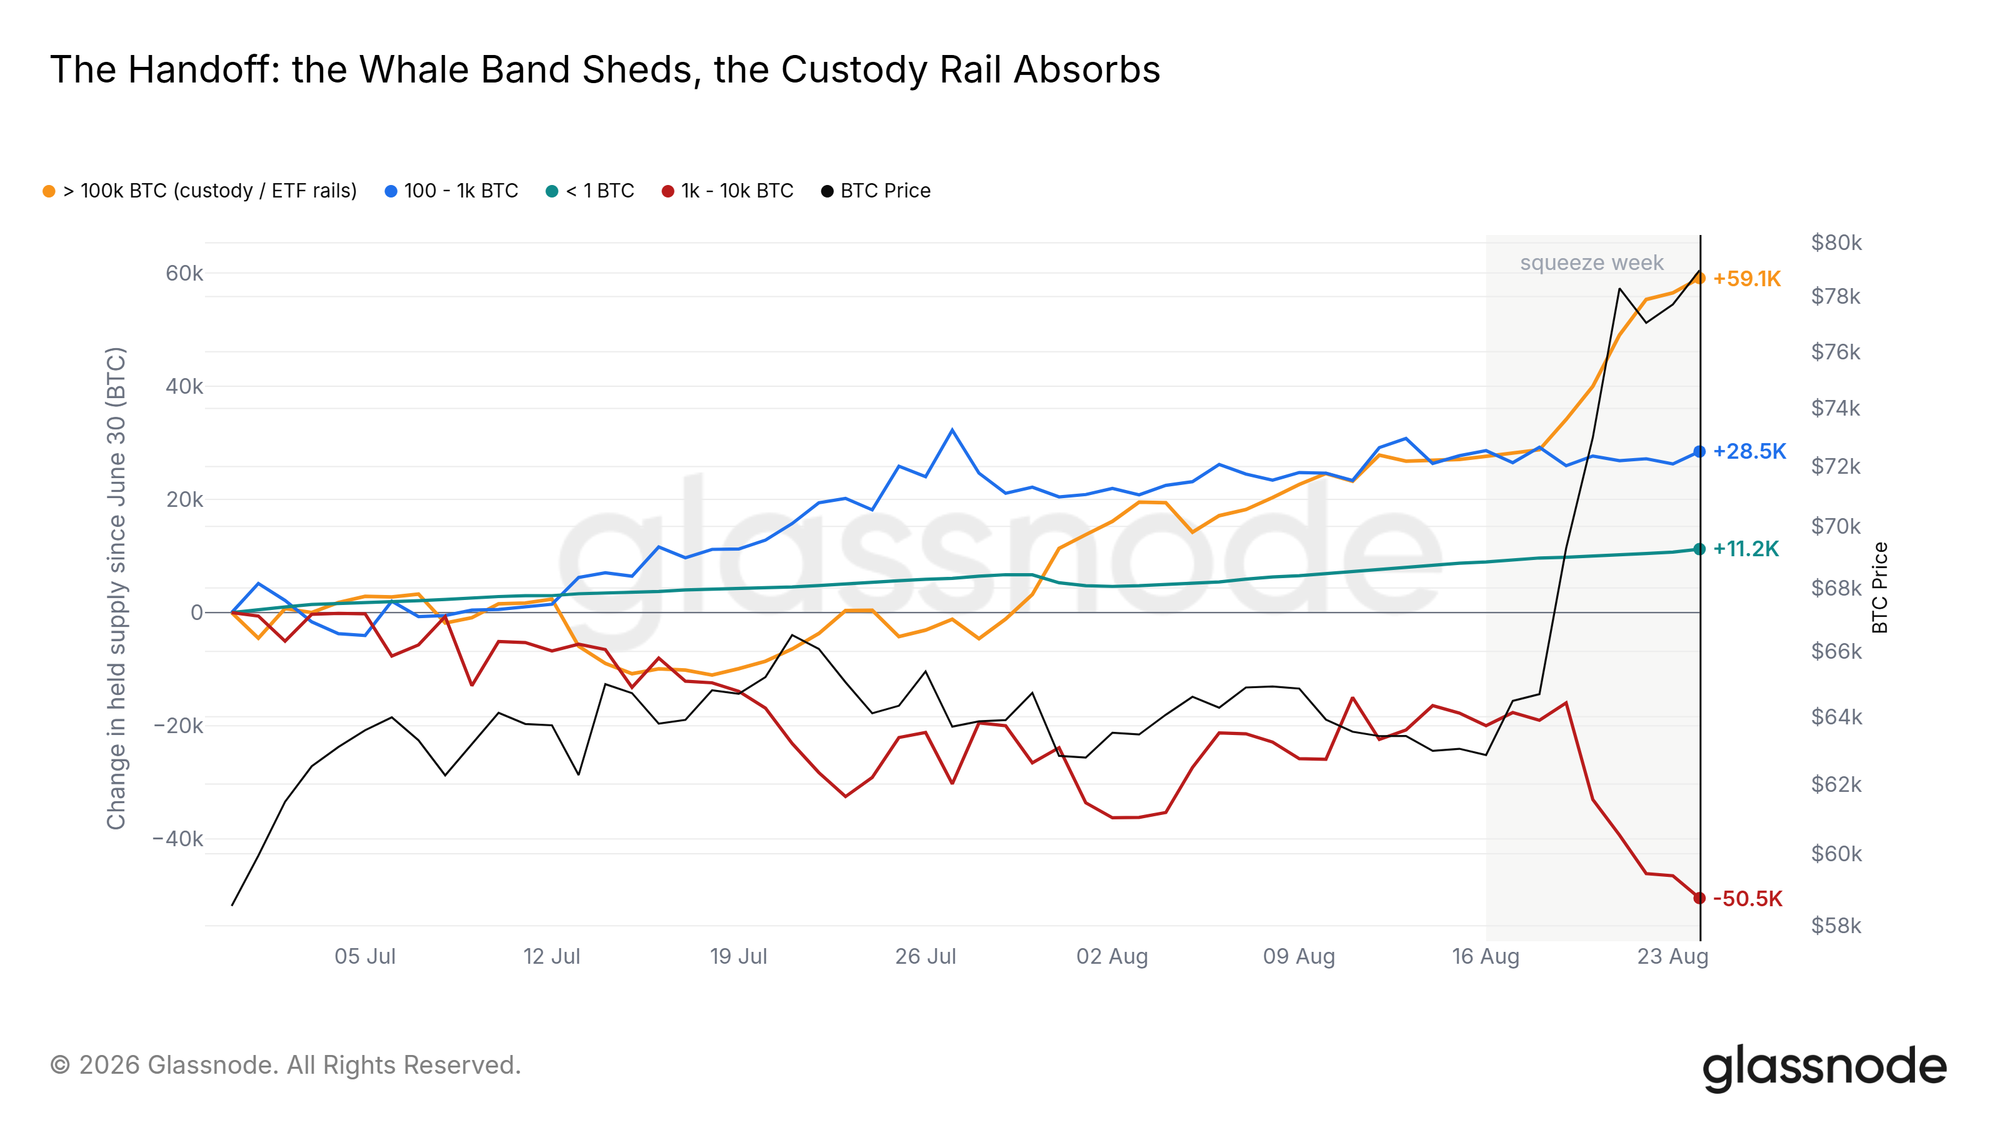
The coins moved up the size ladder. Since the June 30, 2026 low, entities holding 1k-10k BTC have shed 50.5K BTC. The largest band, above 100k BTC and dominated by exchanges, custodians and ETF wrappers, absorbed 59.1K BTC over the same stretch.
The squeeze week concentrated that pattern. The custody band's gain over the window, 31.5K BTC, sits at the same scale as the week's ETF creations; the two are matched in scale, not traced coin for coin. Coins left whale wallets under pressure and supply of the same size appeared on institutional rails.
Accumulation Across the Board
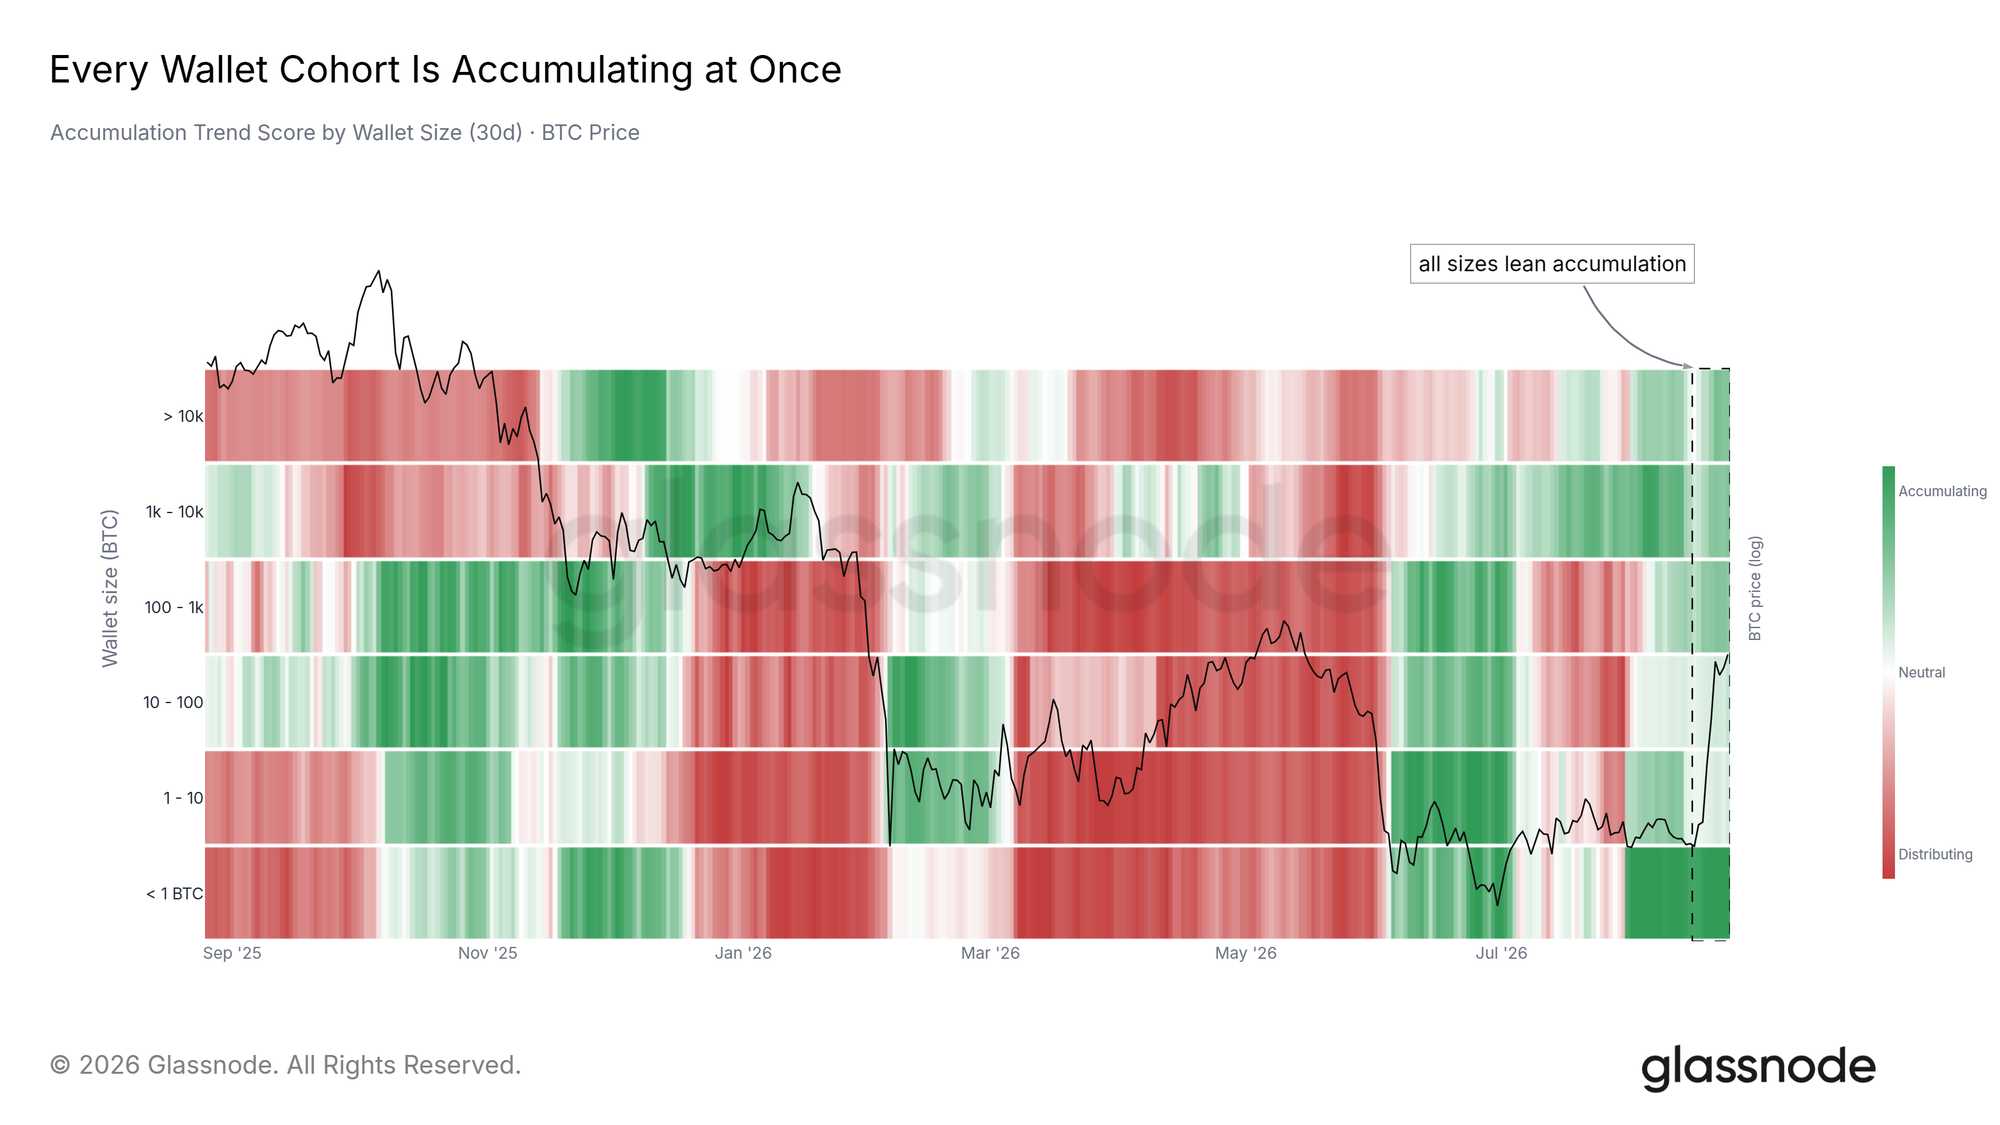
Breadth confirms the bid. The 30-day Accumulation Trend Score sits at or above the 0.5 neutral line for all six wallet-size cohorts, a 20-day stretch running since August 5, 2026 and already the most persistent all-cohort accumulation since a 22-day run in late 2024.
The squeeze days themselves were led by the larger wallets; the smaller cohorts built their strength through the whole month. A cohort dropping back below 0.5 on a refresh would be the first crack in that breadth, and the first warning that the bid under this recovery is narrowing.
The Shape of the Recovery
Out of the Cool Band
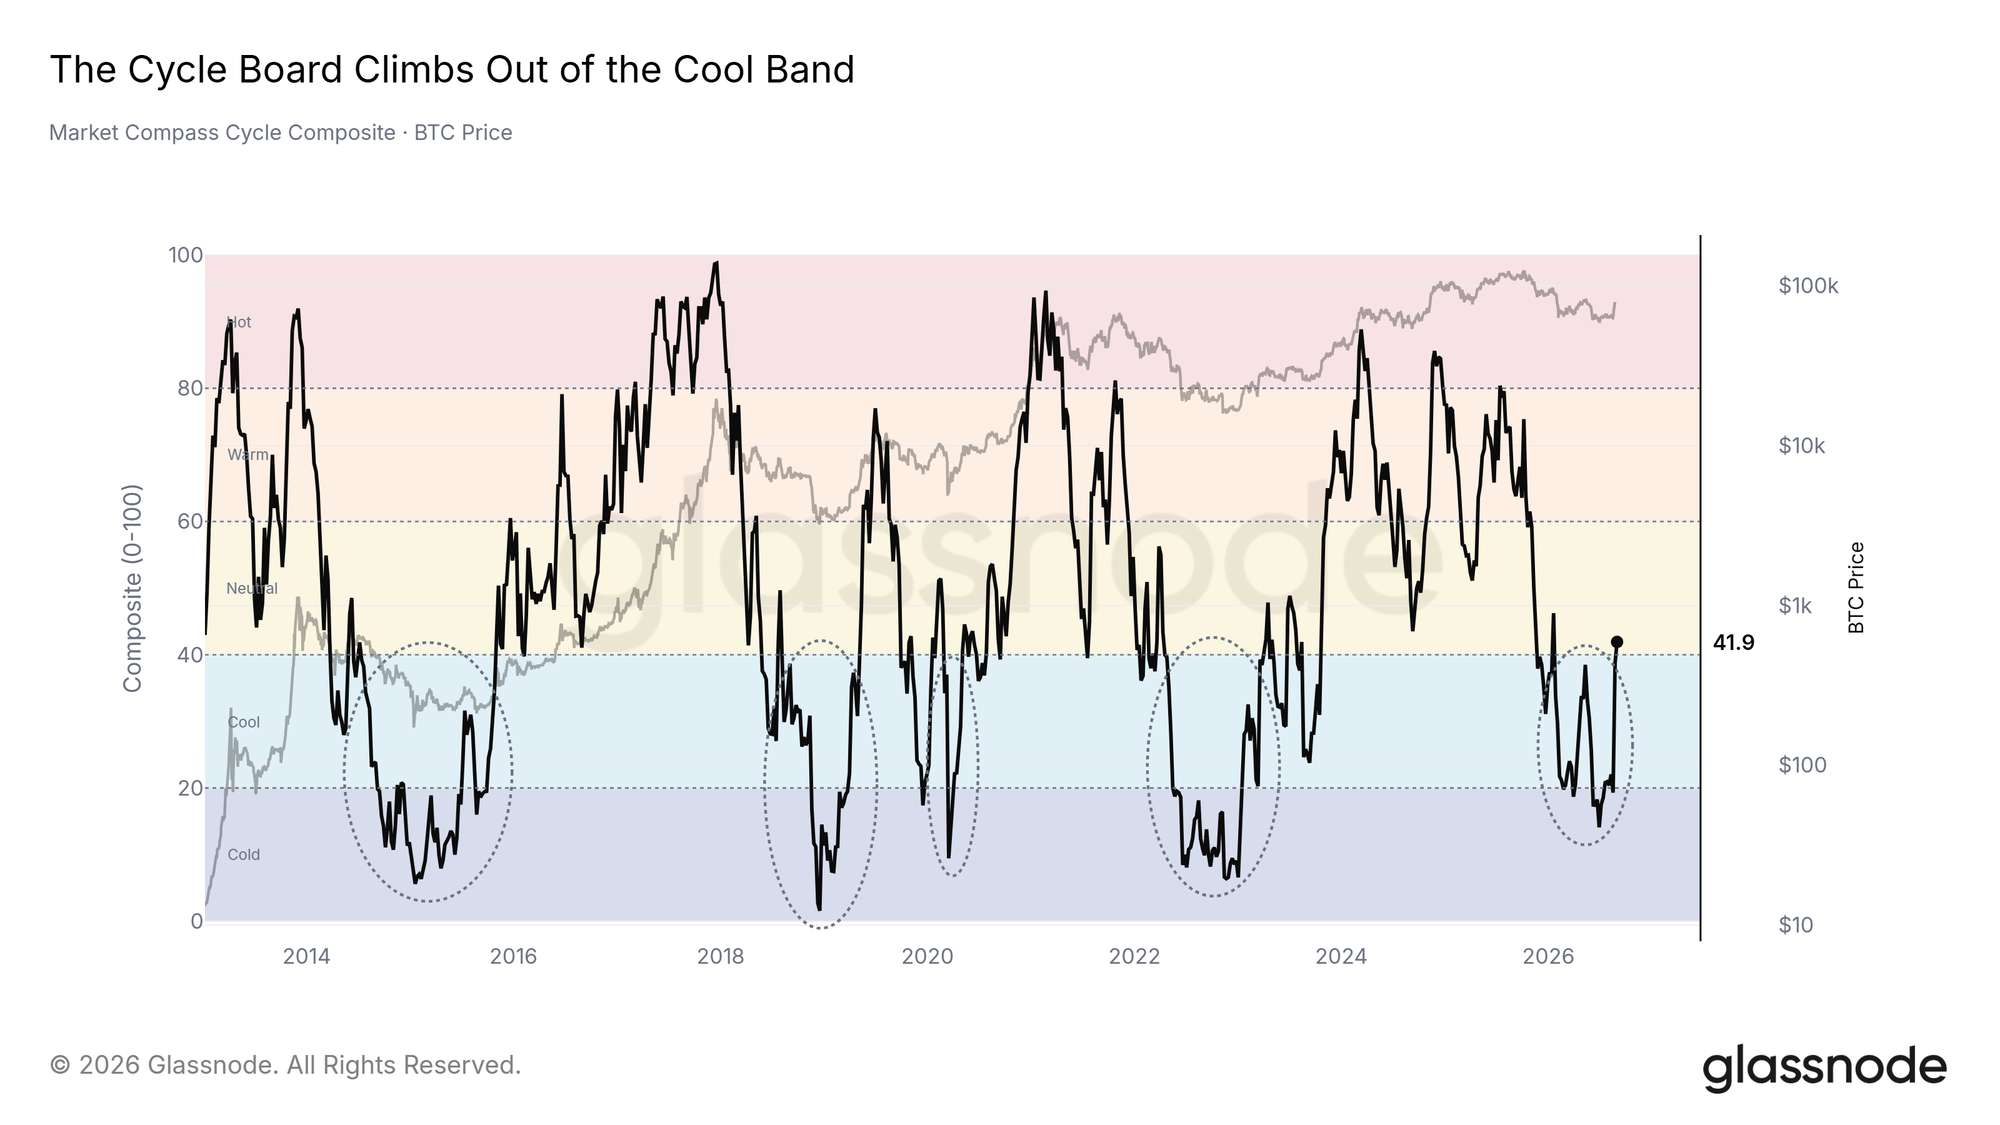
The cycle composite, the median of 45 cycle indicators, has climbed back to its neutral boundary at 40 after seven months in the cold and cool bands below it.
The five rings on the chart mark every such stay: 2014-2015, 2018-2019, 2020, 2022-2023 and this year. Each earlier one sat in the low zone of its cycle. The gauge says nothing about how fast a recovery runs, but it places this one early on the cycle map, far from the readings that accompanied prior tops.
A Top-Heavy Rally
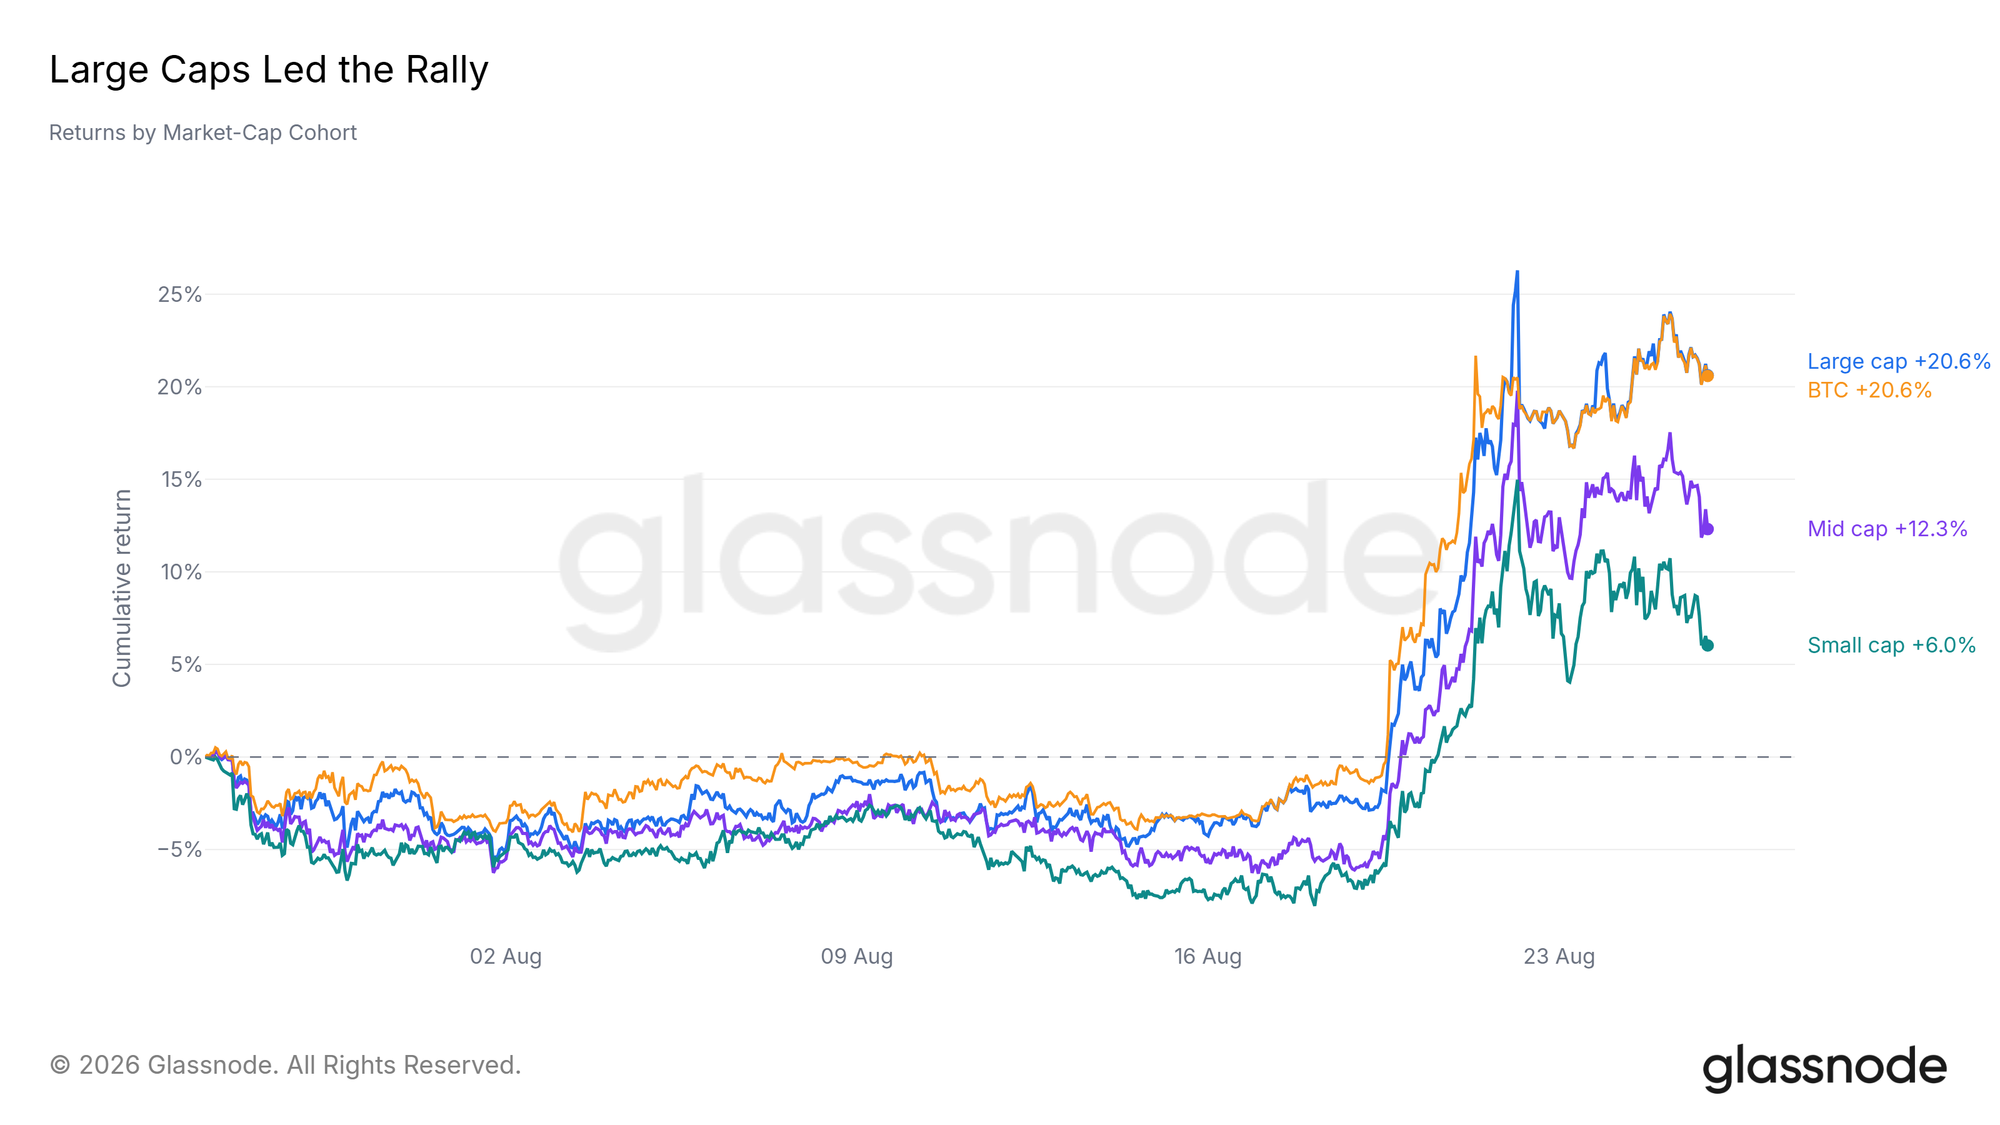
Across assets, the advance is narrow. Over the past month the large-cap cohort returned 20.6%, matching Bitcoin, while the small-cap cohort managed 6.0%; the further down the cap curve, the less of the move arrived.
The profile is typical of early recoveries, when capital buys the most liquid names first. A catch-up by the smaller cohorts would broaden the advance; until it comes, this remains a large-cap market with Bitcoin at the front of it.
The Equity Link Broke
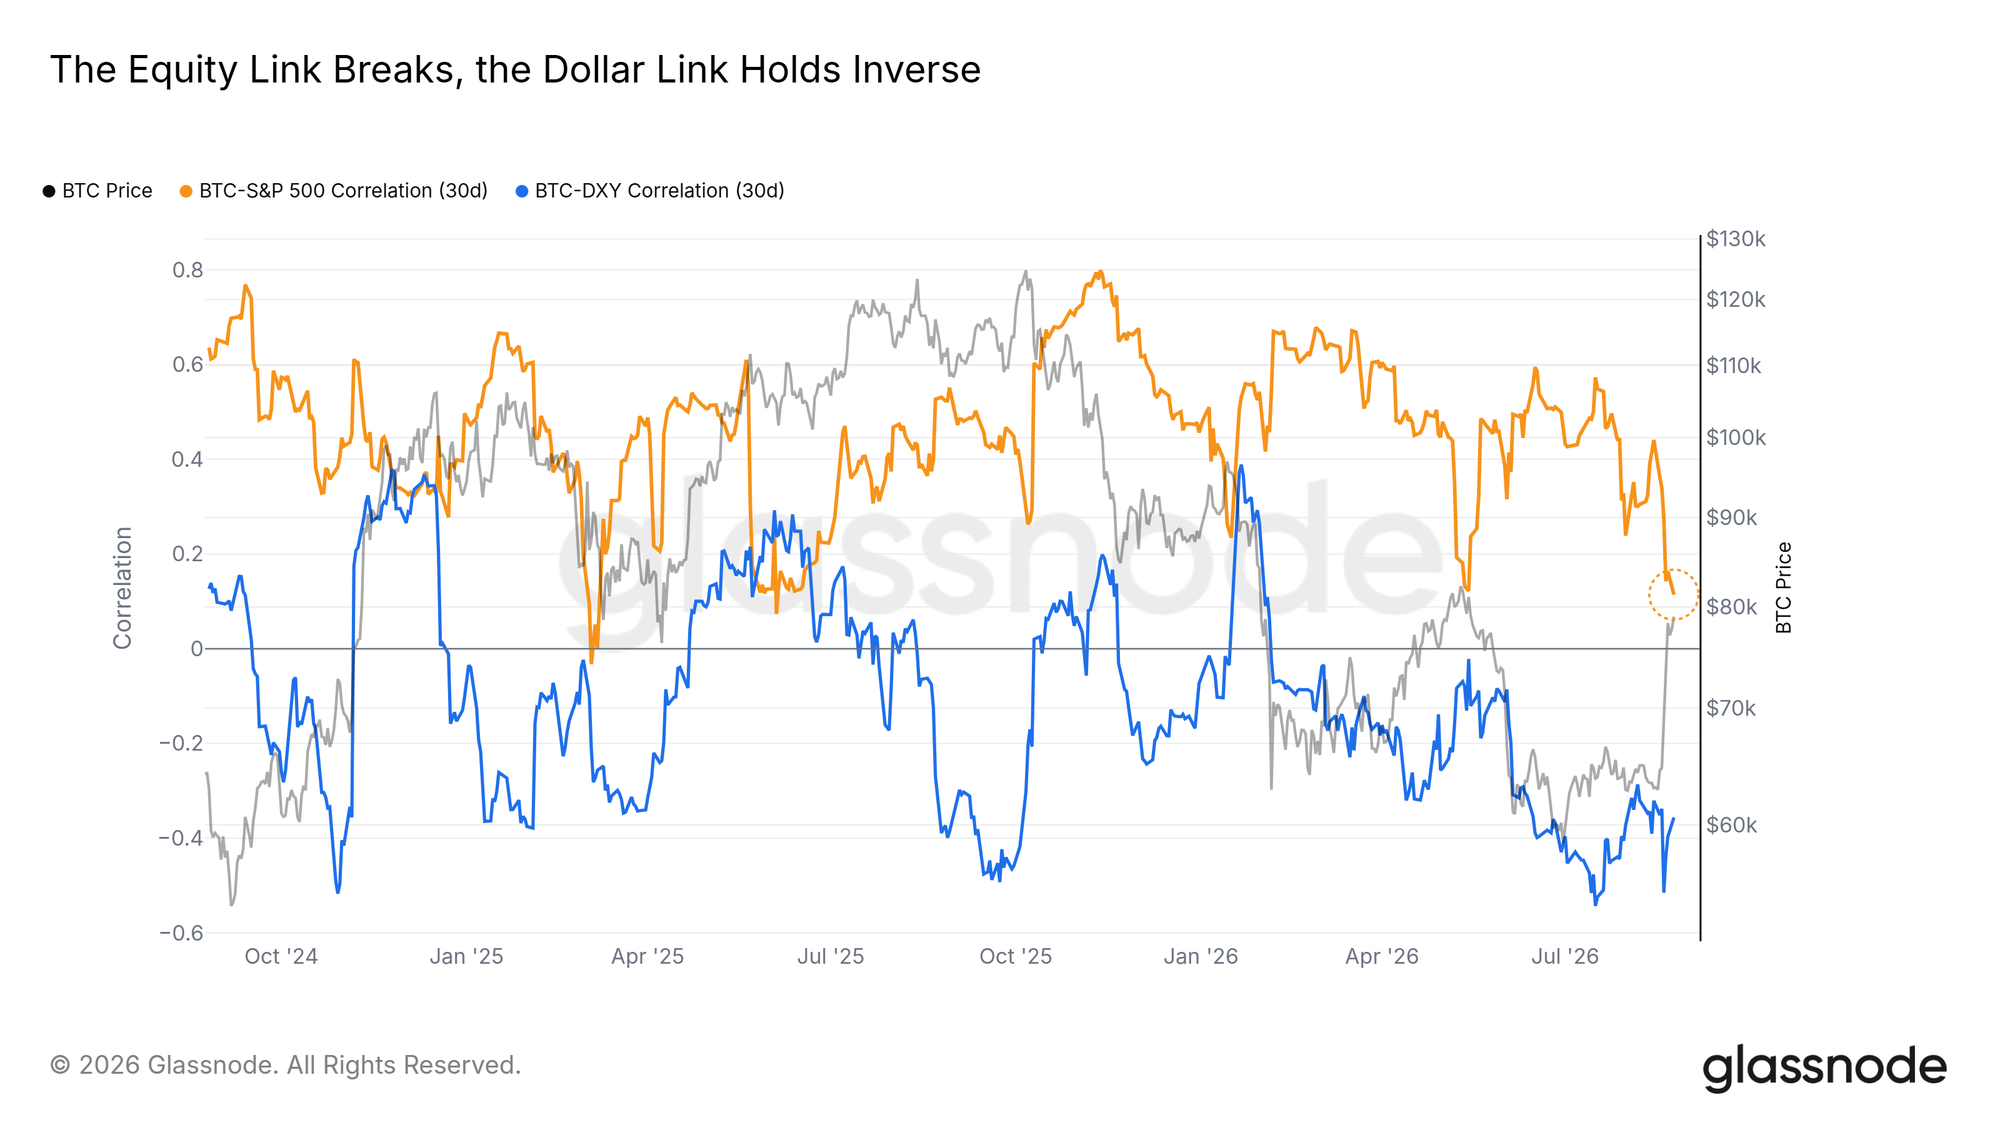
The move ran against the macro tape. Across the squeeze window Bitcoin gained 25% while the S&P 500 slipped 1.7%, and the rolling one-month return correlation between the two collapsed toward zero. The link to the dollar stayed firmly inverse.
Fast-window breaks like this mean-reverted within weeks twice in 2025, so the de-correlation is not yet structural; the slower quarterly window has only rolled over. But a rally built through equity weakness cannot be an equity-beta rally, which leaves its own flows as the engine.
The Wall Overhead
The Floor and the Ceiling
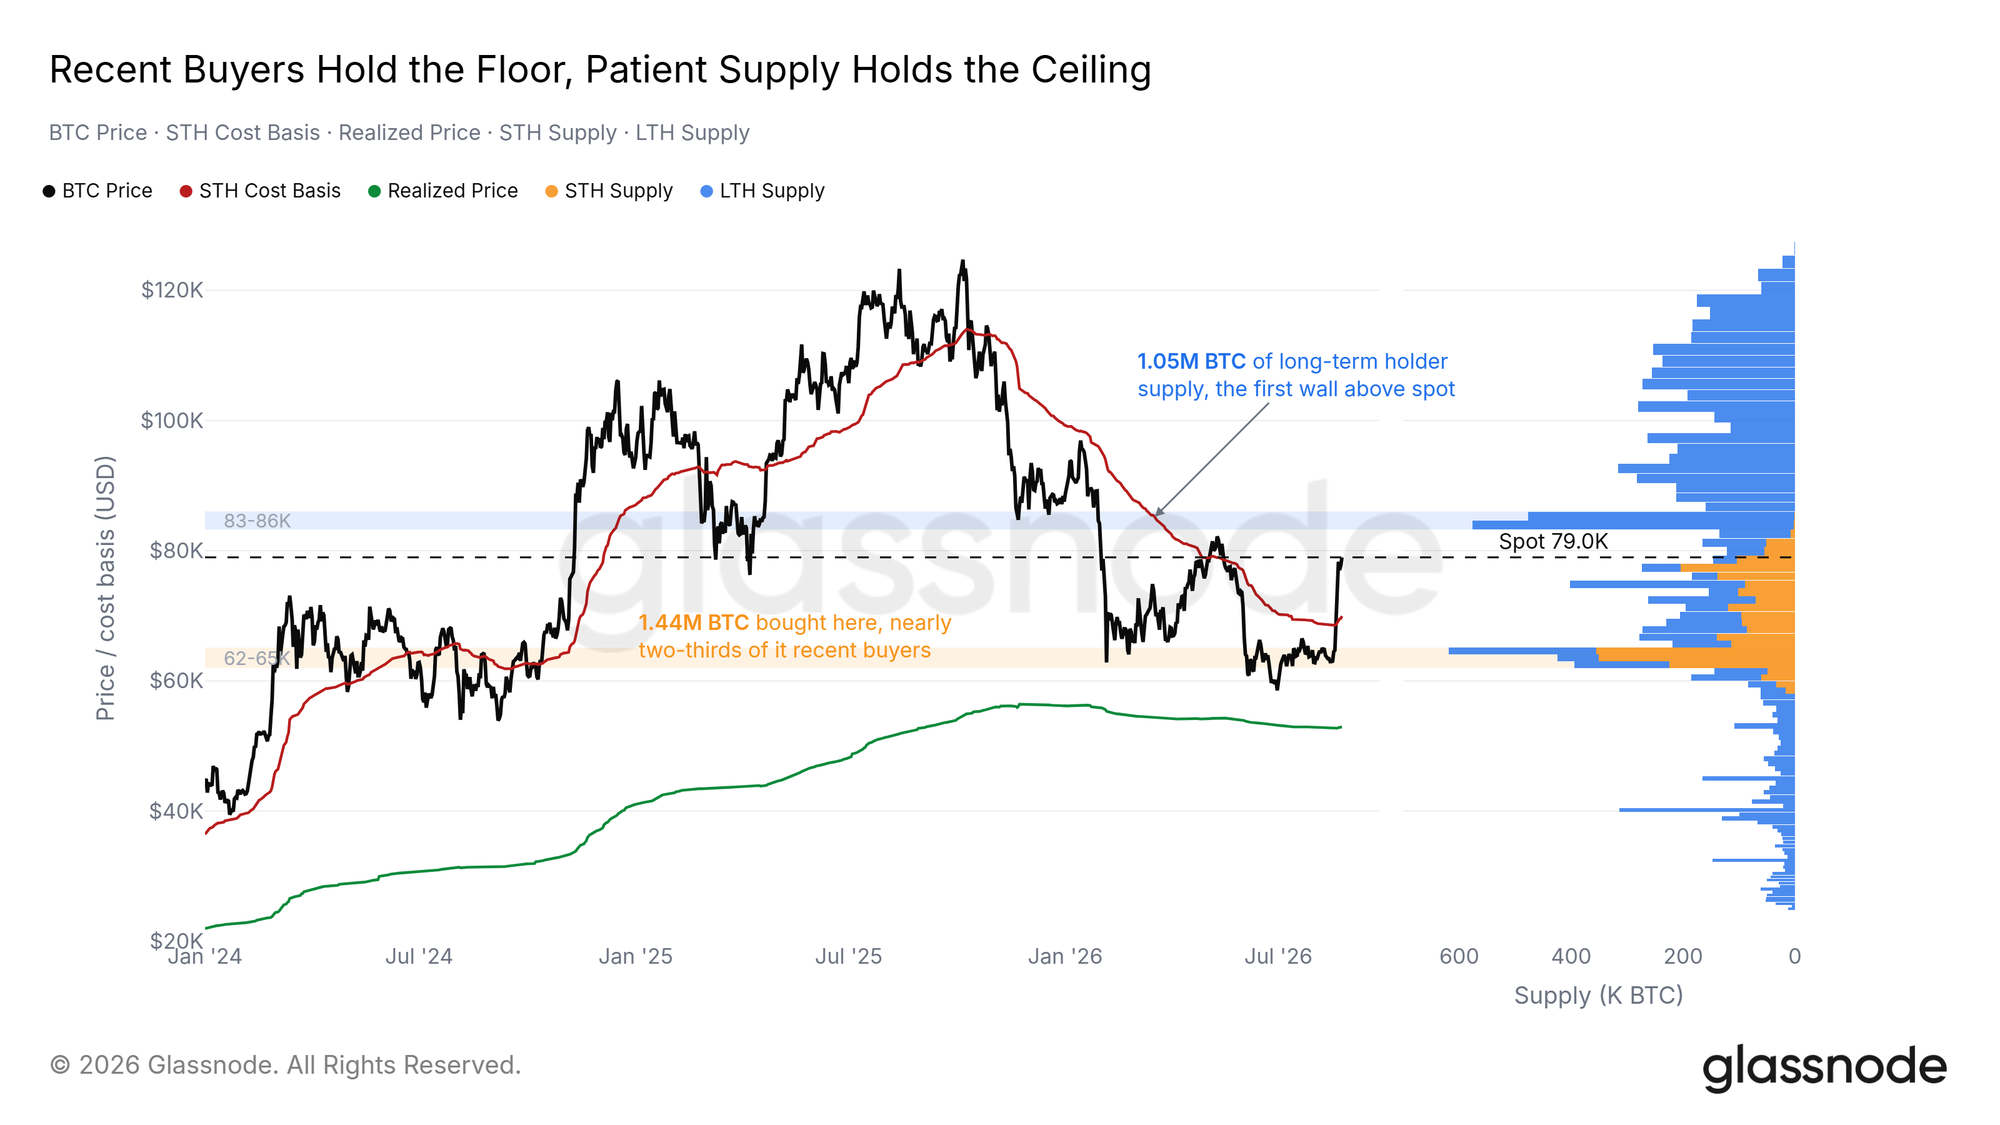
The cost-basis map now brackets price. Below, the buyers of the June-August base hold the $62K-65K band, and nearly two-thirds of that supply belongs to short-term holders: recent buyers defending recent entries. Above, the first heavy structure is $83K-86K, and effectively all of it is long-term holder supply that has sat through the entire drawdown. Spot trades in the gap, with the Short-Term Holder Cost Basis back underfoot at $70.0K.
A push into $83K-86K would test whether those long-term holders sell at break-even.
Asks Return Above Price
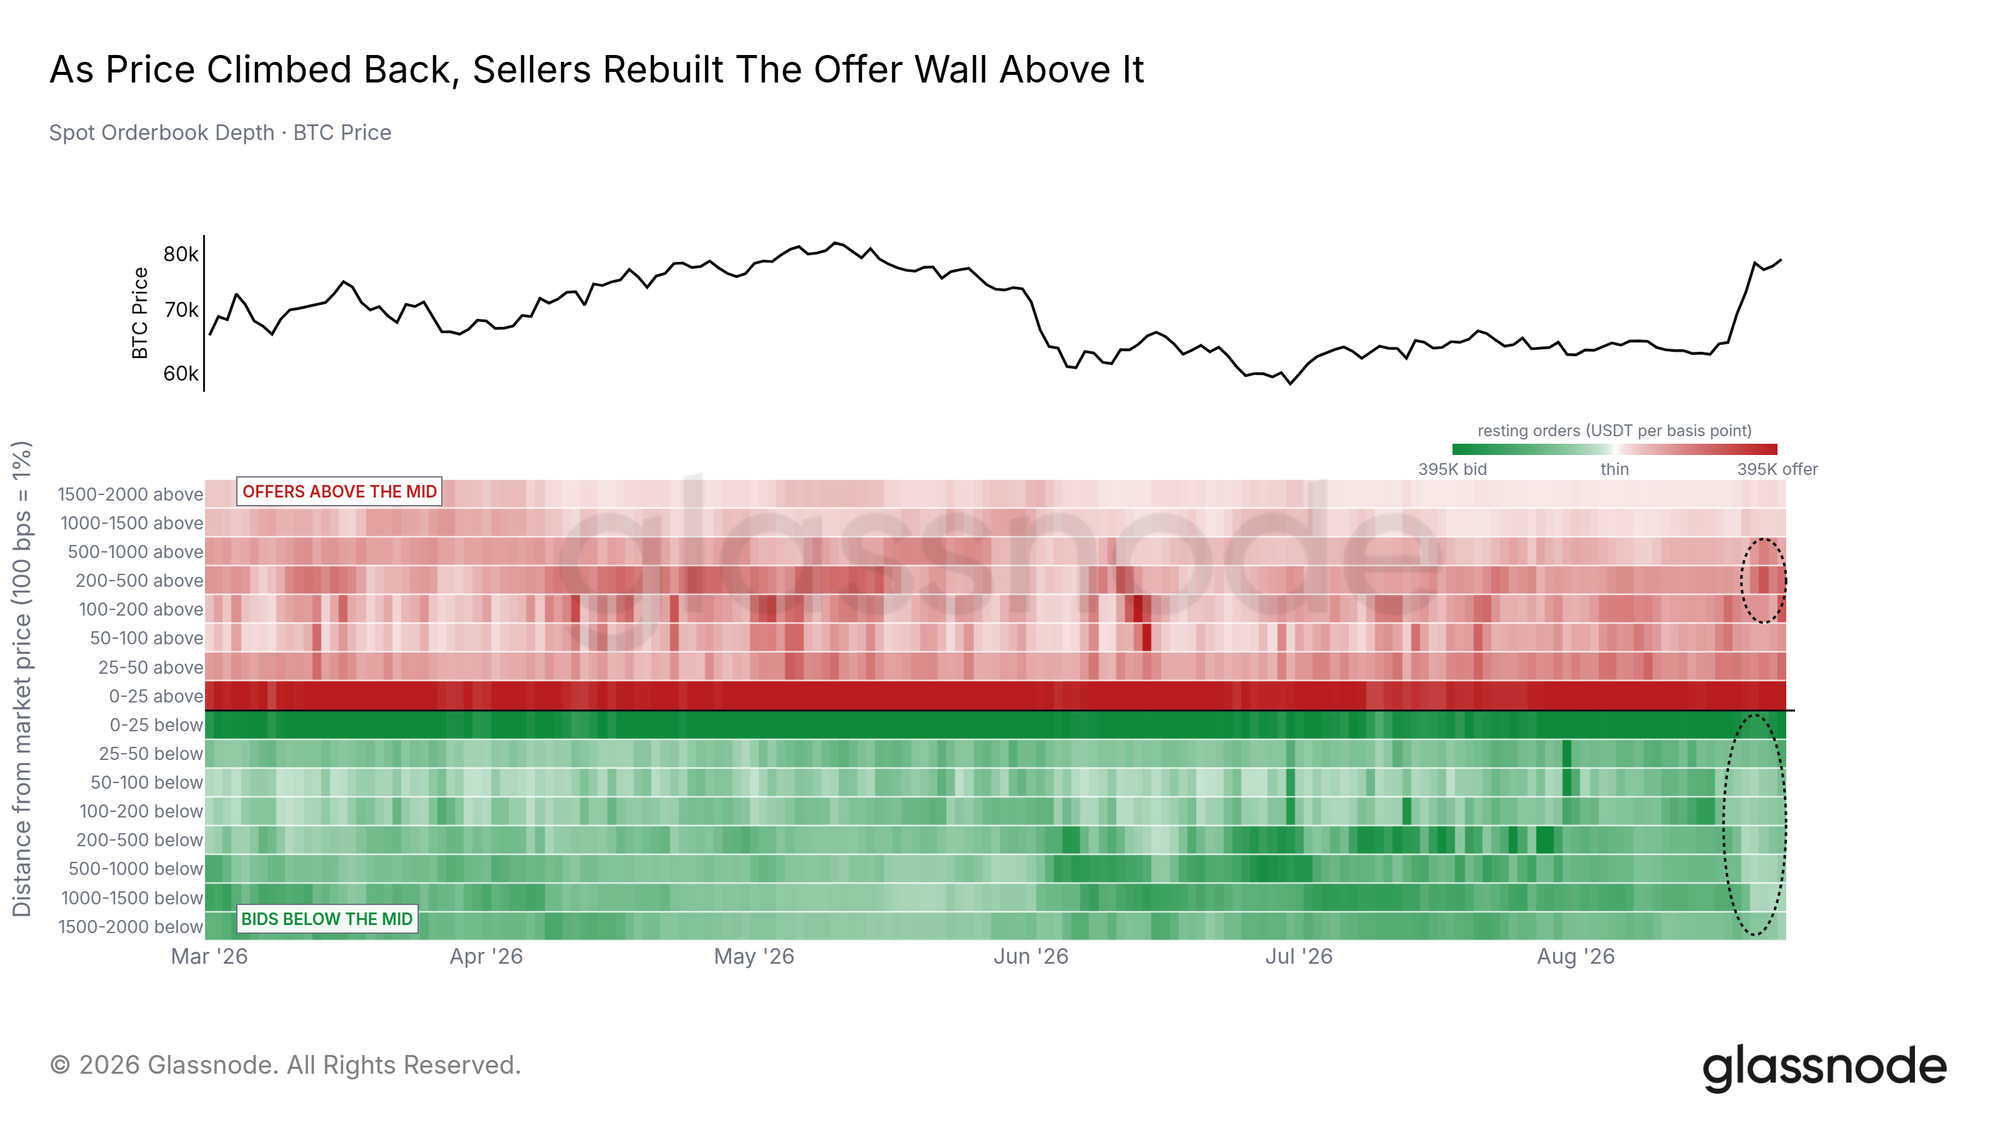
The order book rebuilt its offer side as price rose. Resting asks in the 100-1000 bps band above the mid grew 41% over the window's last five days; bids thinned 32% across the whole visible book over its last seven. Resting orders can be pulled in an instant, so the book is a map of where sellers intend to be, and they intend to be above.
The re-laddered asks join a stack of independent structure pointing at one zone. The first self-custody cost-basis shelf begins at $80.8K, dealer gamma flips negative at $82.3K, the surviving liquidation shelf runs to $86K, and the patient-supply wall fills $83K-86K. Every overhead structure we track now sits between $81K and $86K; that band is where the recovery's demand meets its test.
What Options Expect
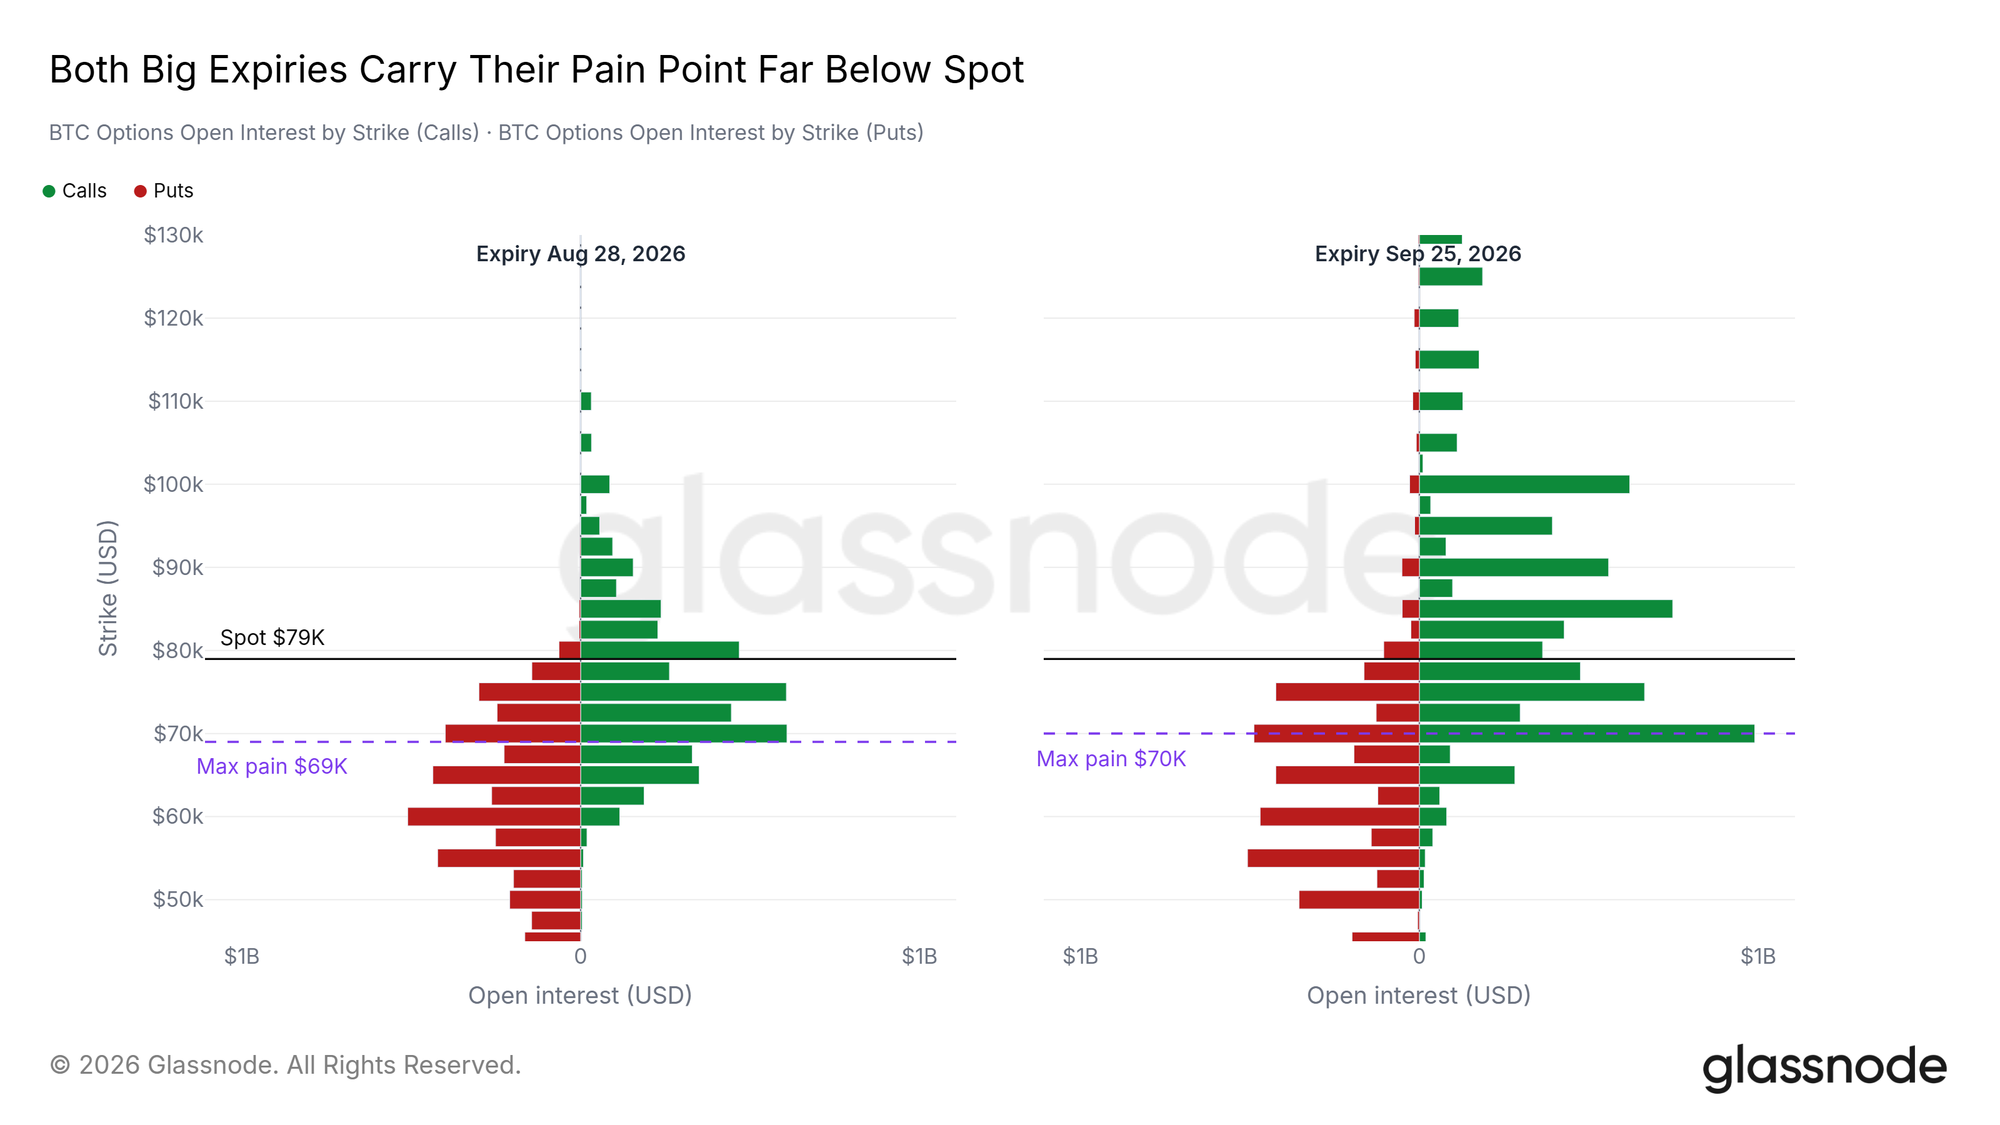
The options board prices patience. The two heaviest expiries of the coming month, this Friday's $10.4B and the $13.7B September quarterly, both carry their pain point far below the market. Max pain, the strike where the largest share of open options expires worthless, sits at $69K and $70K against spot at $79K, with the put carpet under the market and the call shelves stacked overhead.
The forward distribution is flat. By the September 25, 2026 expiry the middle 70% of strike-implied outcomes spans $69.0K-89.7K, with the median within a few hundred dollars of spot. Options are priced for a hold inside the walls: neither an extension through the $86K zone nor a return to the floor is the market's central case.
Conclusion
The largest short flush in our feed's history started the move; ETF creations, taker buying and exchange outflows paid for its continuation; the cycle board still reads early. That is the profile of a staged recovery. Confirmation comes from above: settled closes beyond $83.3K with ETF intake holding would show the wall being absorbed rather than respected. Weakness shows first at the $70.0K Short-Term Holder Cost Basis, then at the $62K-65K floor held by the same recent buyers who funded the move. A return to the $62.9K squeeze origin would unwind the episode entirely.
Disclaimer: This report does not provide any investment advice. All data is provided for informational and educational purposes only. No investment decision shall be based on the information provided here, and you are solely responsible for your own investment decisions.
Exchange balances presented are derived from Glassnode’s comprehensive database of address labels, which are amassed through both officially published exchange information and proprietary clustering algorithms. While we strive to ensure the utmost accuracy in representing exchange balances, it is important to note that these figures might not always encapsulate the entirety of an exchange’s reserves, particularly when exchanges refrain from disclosing their official addresses. We urge users to exercise caution and discretion when utilizing these metrics. Glassnode shall not be held responsible for any discrepancies or potential inaccuracies.
