Strength Meets a Wall
Bitcoin holds above its key cost bases and profit taking stays light, but ETF inflows have faded, volume is low, and a wall of sell orders at $85K-$85.5K caps the price.



Executive Summary
- US spot ETFs took in about $1B on each of two days in late September; inflows have faded since, and price has moved sideways.
- Profit taking stays light against past tops, although long-term holders stepped up their selling this week.
- Over the last 30 sessions, Bitcoin has beaten the S&P 500 more often than not, although it fell harder than stocks this week.
- A wall of sell orders at $85K-$85.5K caps the price. The True Market Mean at $77.2K is the first support below.
- Total volume sits near the bottom of its range since the US spot ETFs launched, which leaves the rally early and speculative.
- Altcoins have outpaced Bitcoin over the past month with little froth or new leverage, but their advance stalled this week.
Ready to get ahead of markets and sharpen your foresight? Try Glassnode. Sign up or talk to sales.
The ETF Bid Cools
Two Big Days, Then a Fade
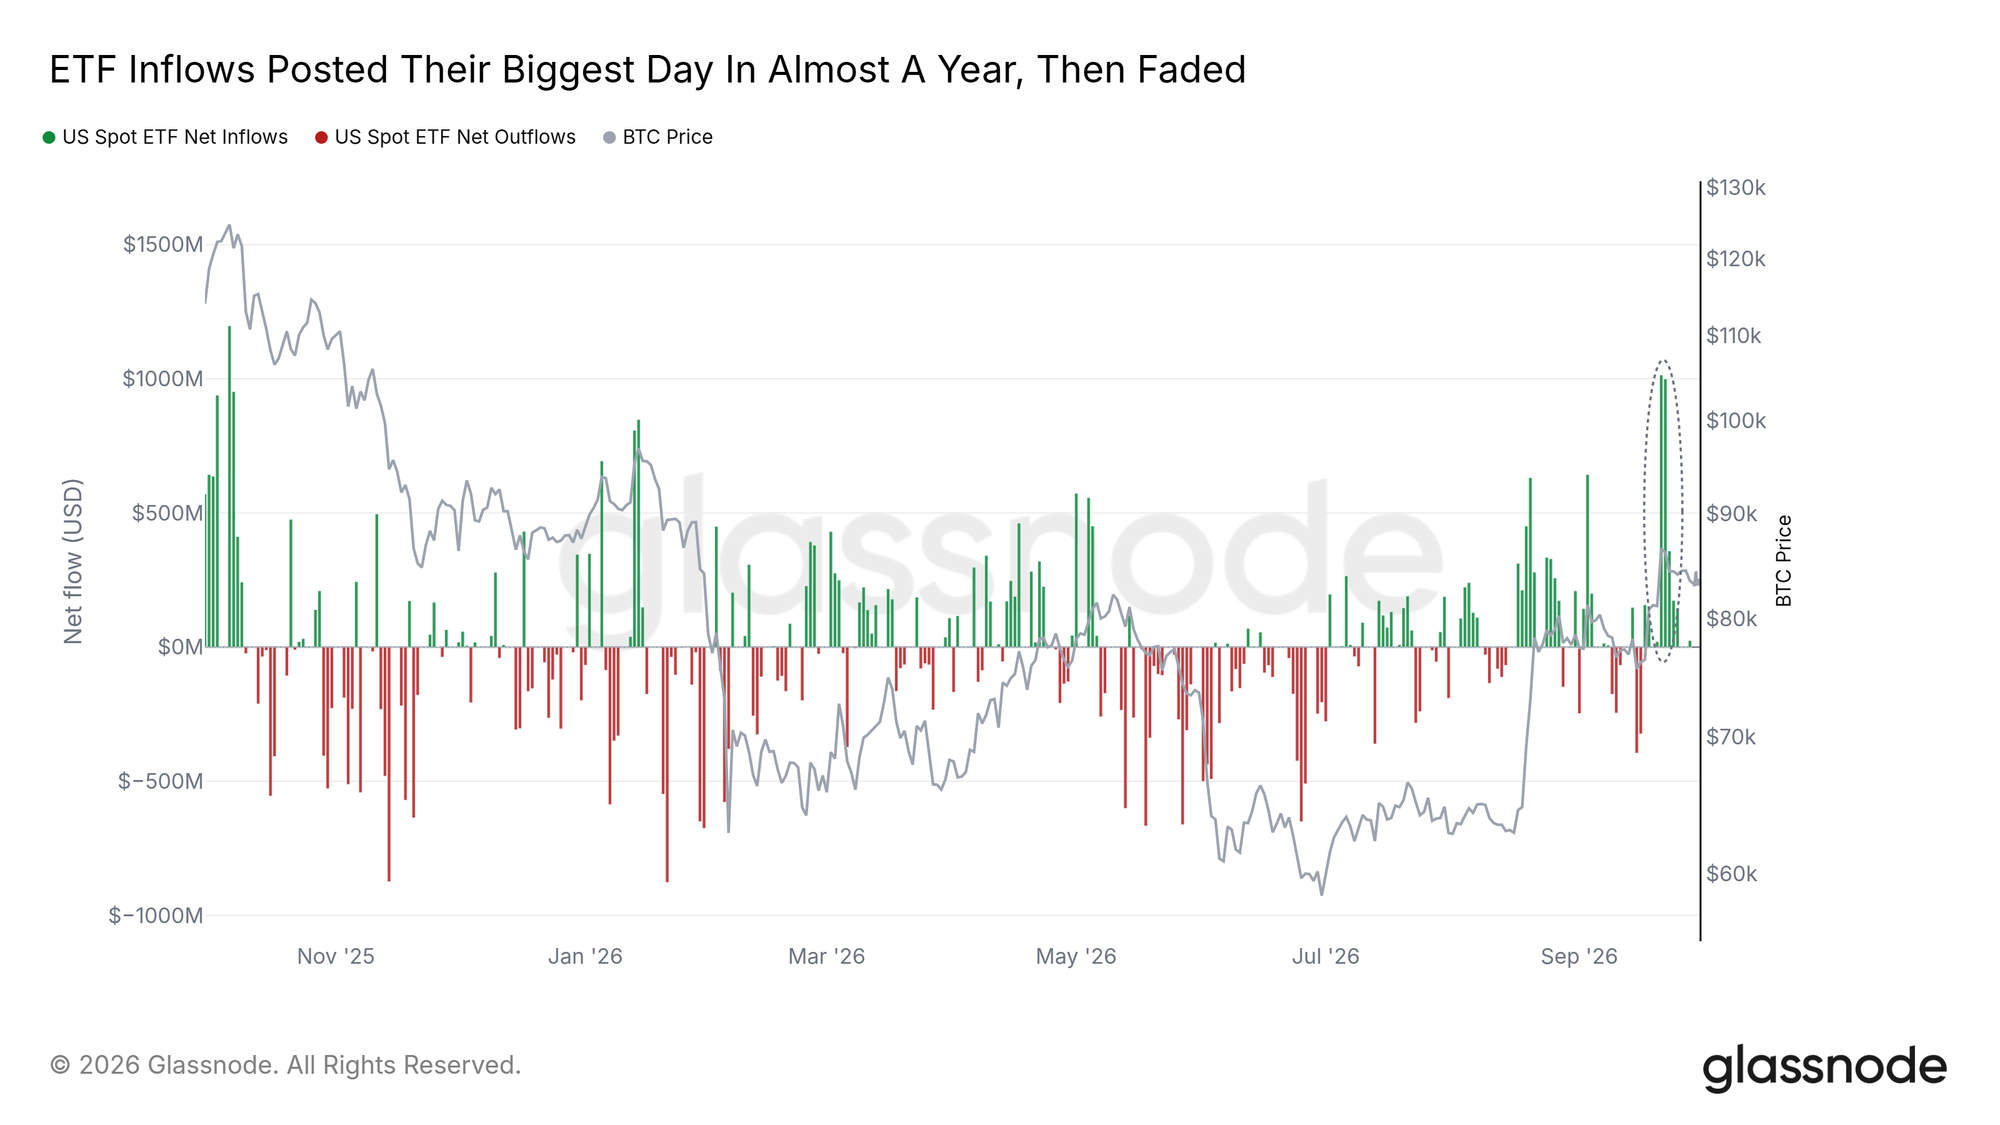
ETF buying peaked on September 21 and September 22, when US Spot ETF Net Flows posted about $1B each day. The first of those days was the largest in almost a year. Since then, inflows have shrunk on every trading day, to $24M on September 28, the latest day in the data, while price moved sideways.
Last week, this report described ETF buying picking up. The funds are still buying, but at a small fraction of the pace of those two days. A return to inflows near that pace would be the clearest sign of renewed ETF demand.
Light Selling, New Sellers
Well Below Past Tops
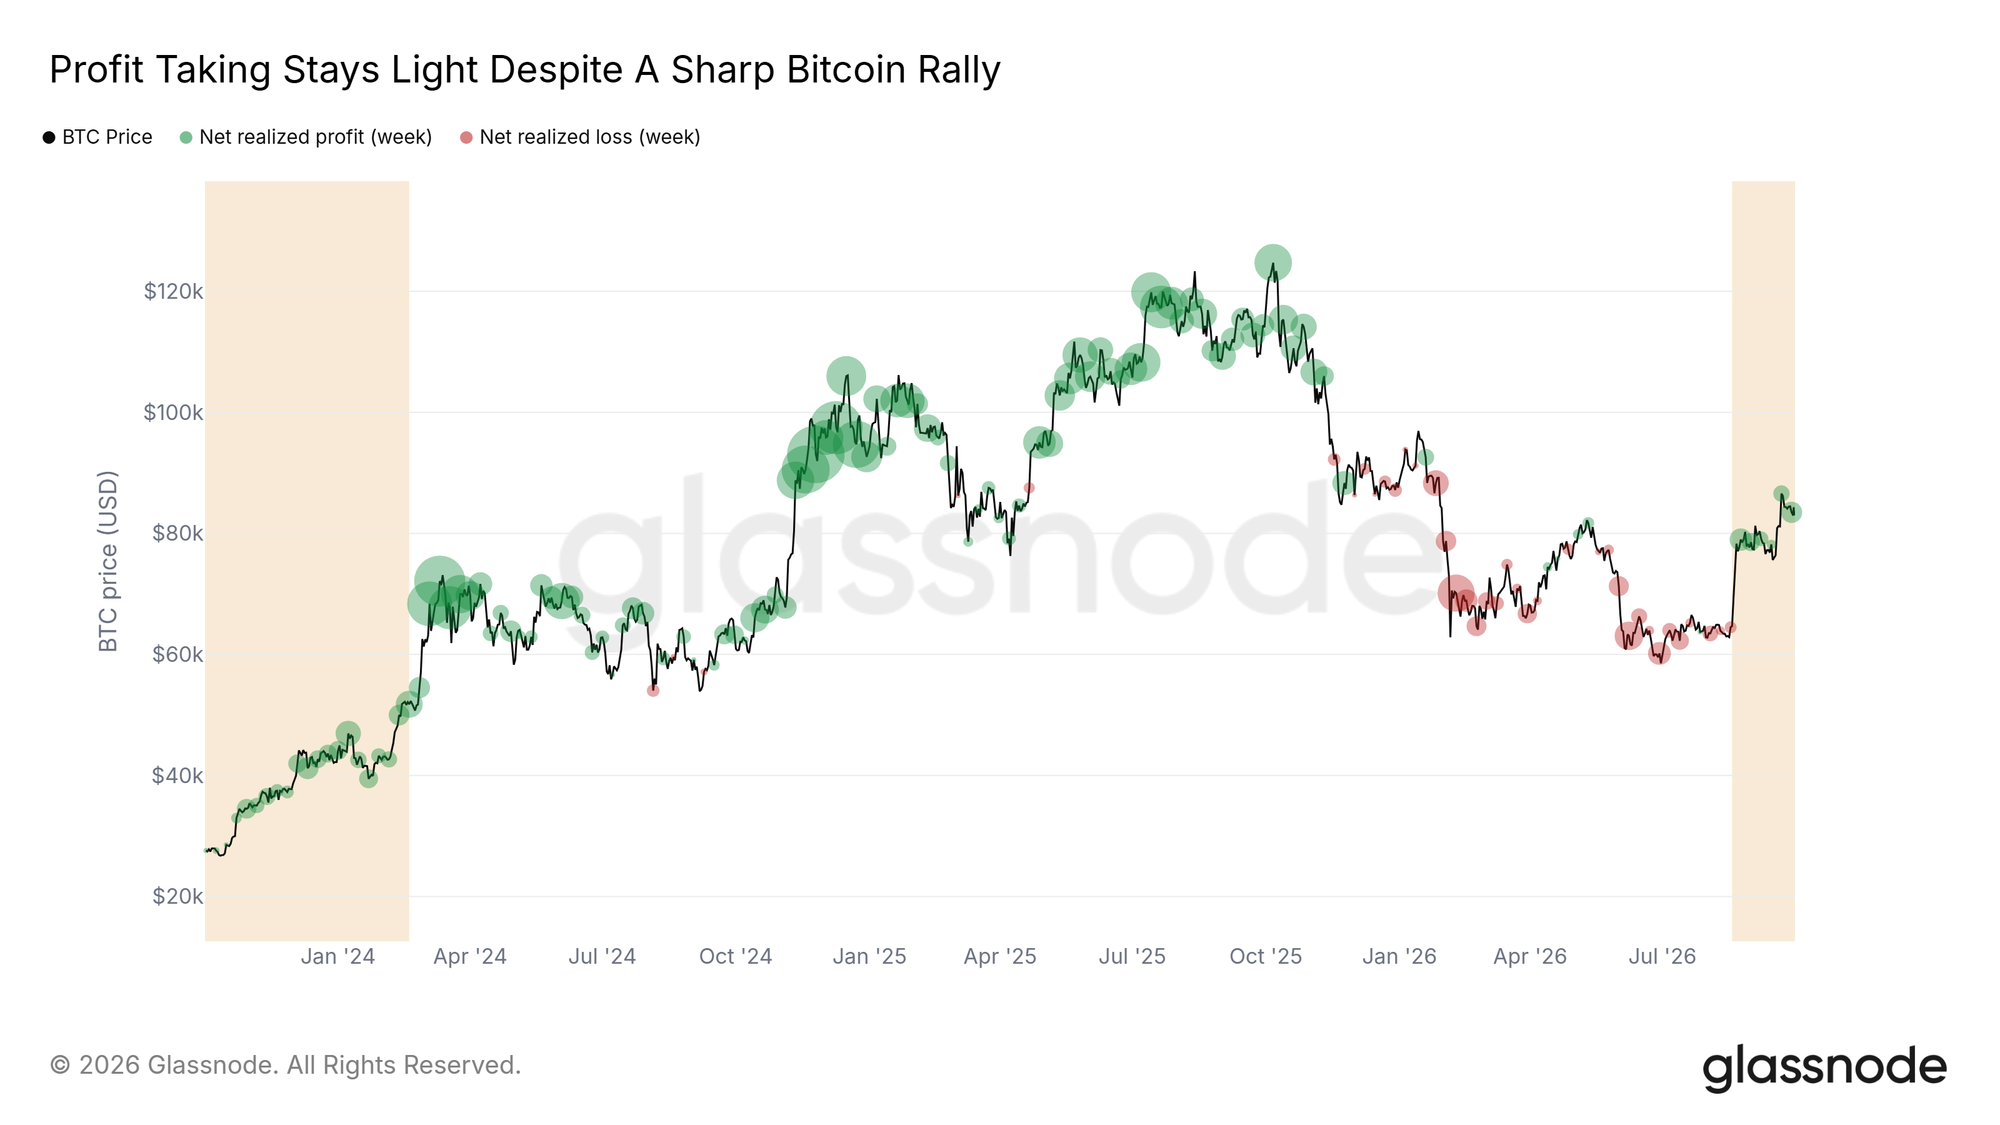
Profit taking stays light against past cycles. Weekly Net Realized Profit/Loss, the net dollar gain locked in when coins change hands, runs well below the average week at the 2024 and 2025 tops. Its pace in this rally, the right-hand band on the chart, is close to the start of the last uptrend in late 2023, the left-hand band.
The sellers have changed, though. Long-term holders, who have held their coins for more than 155 days, nearly doubled their realized profit in the week to September 29 against the week of the breakout, and their share of all realized profit rose from 34% to 55%. Should weekly profit taking climb toward the levels of past tops, it would show holders selling into strength.
A Short-Term Edge Over Stocks
Strong Over 30 Sessions
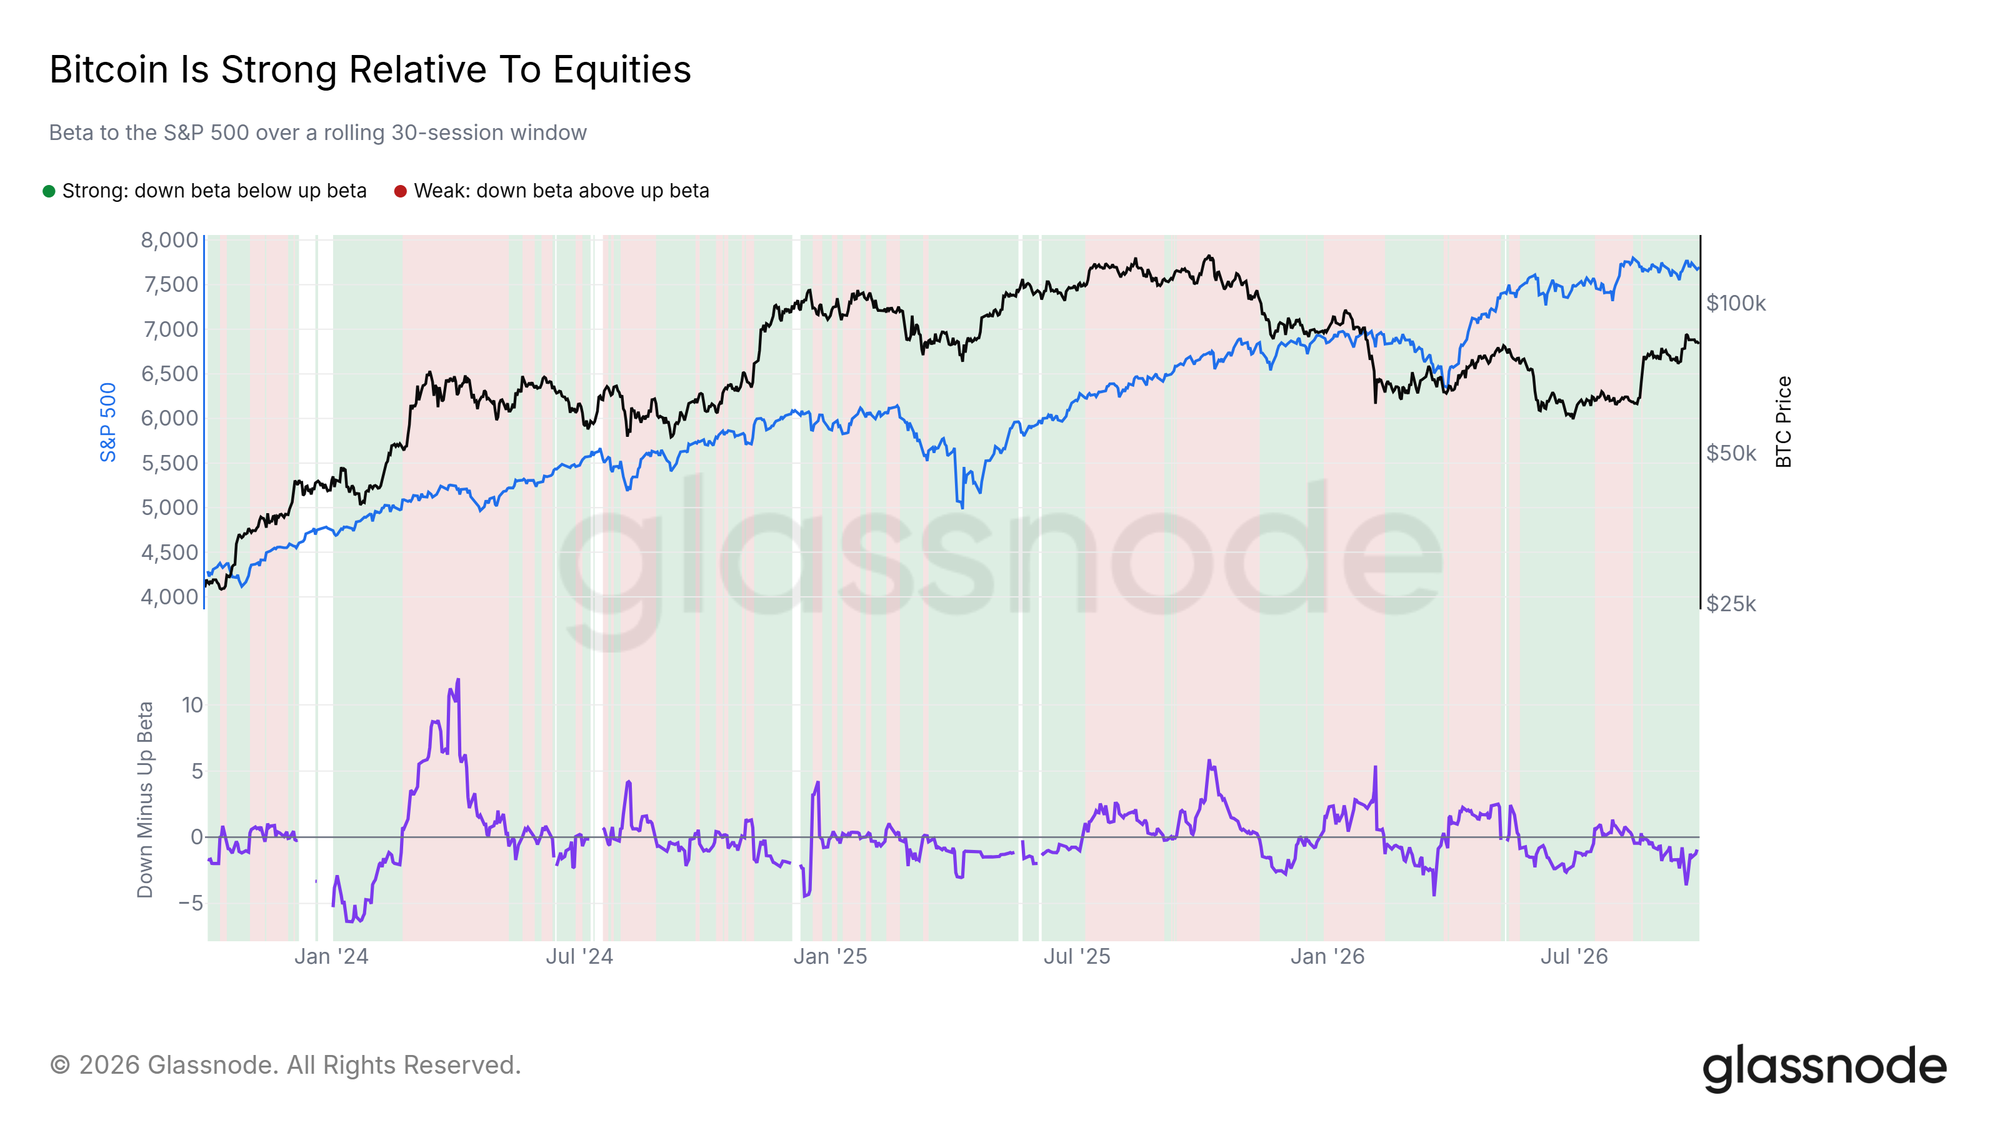
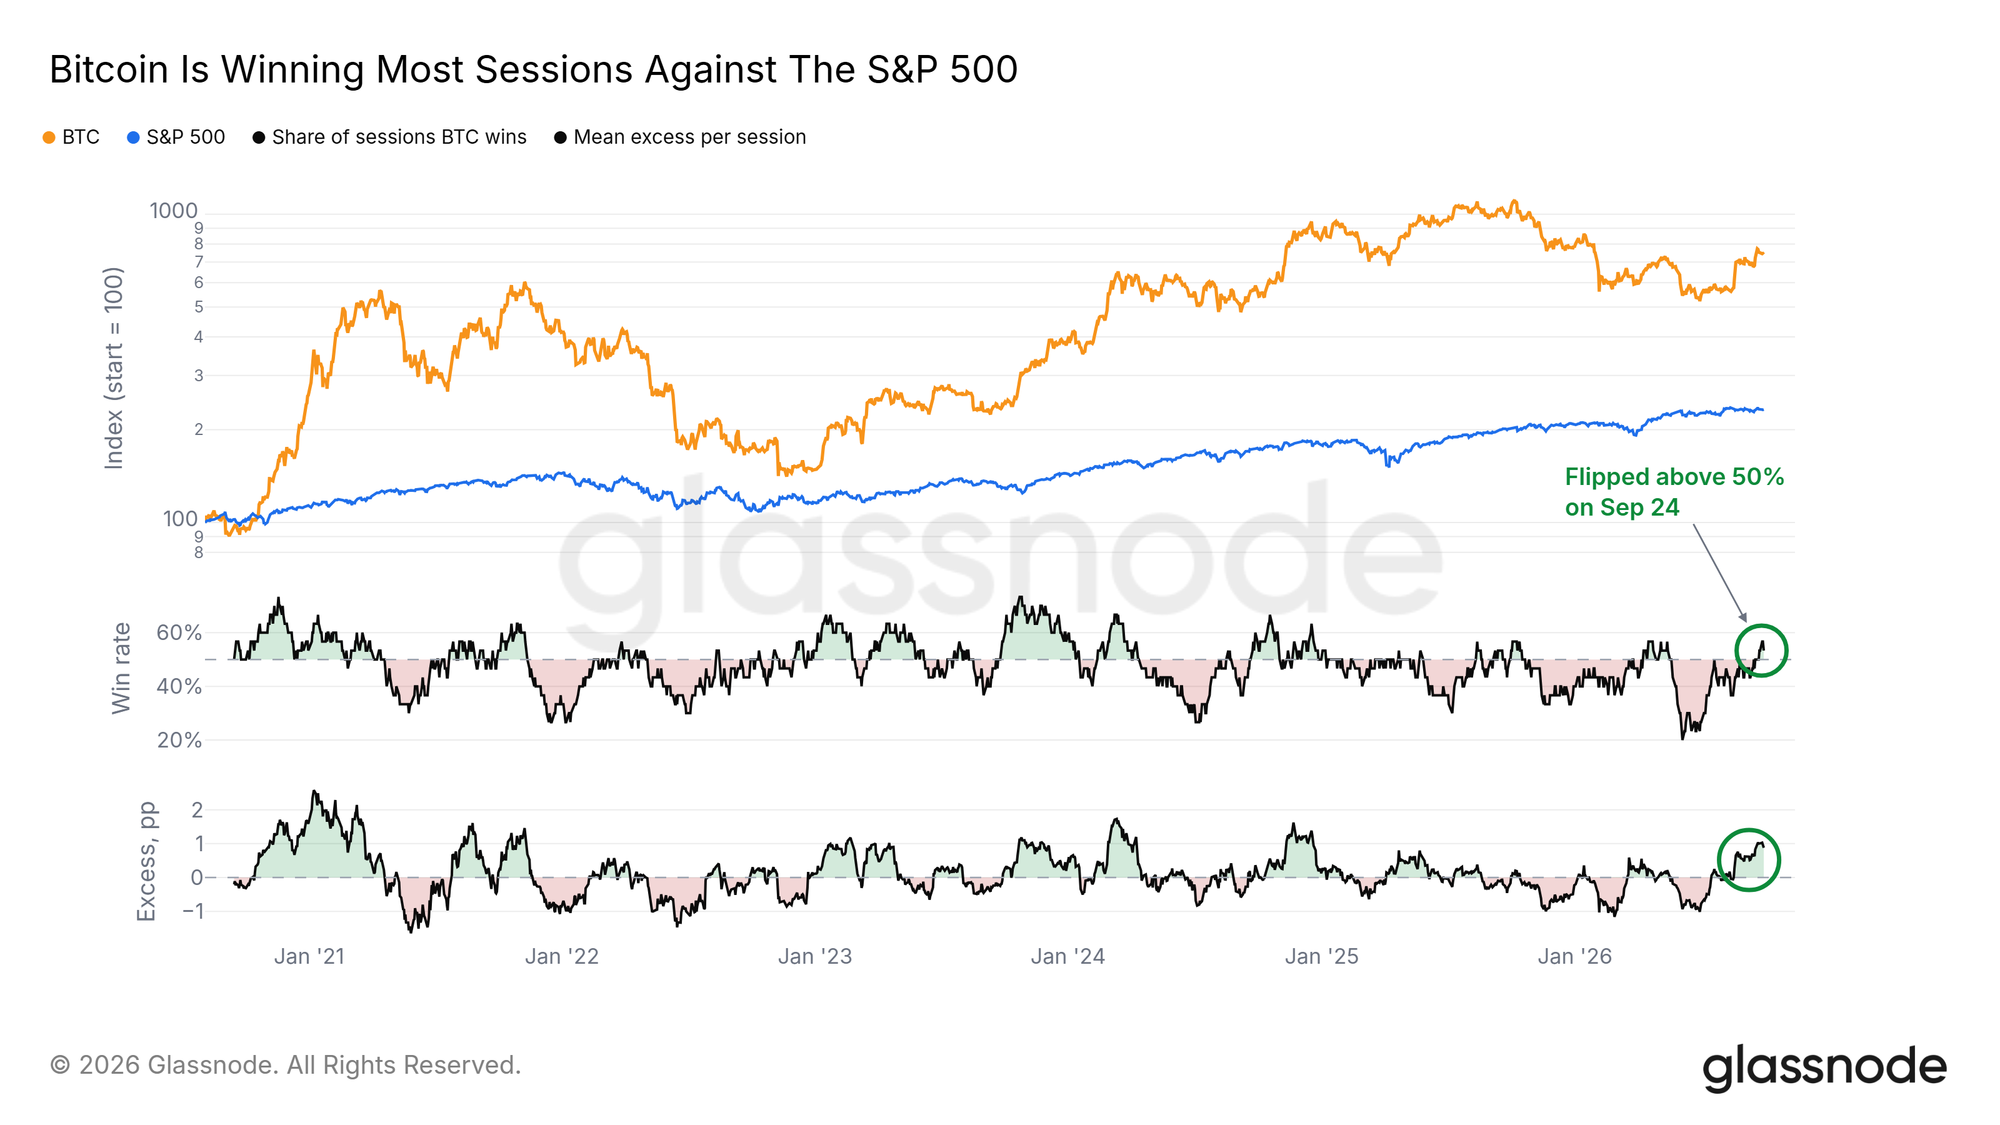
Over the last 30 sessions, Bitcoin has reacted less to the S&P 500's down days than to its up days. The chart shades this pattern green, and it has held since August 20. That window still includes August's rally.
This week, the edge slipped. From September 22 to September 29, Bitcoin fell 2.9% against 1.2% for the S&P 500, and it fell harder than the index on the index's down days. If the green stretch turns red as August's sessions leave the window, the edge over stocks would be gone.
Winning More Sessions
Bitcoin has also beaten the S&P 500 in more than half of the last 30 sessions. That share moved above half on September 24, for the first time since mid-May.
The margin is thin, and a few losing sessions would push it back below half. A share that stays above half into October would show that this edge is more than a short streak.
A Wall Overhead
Asks Stack Up at $85K
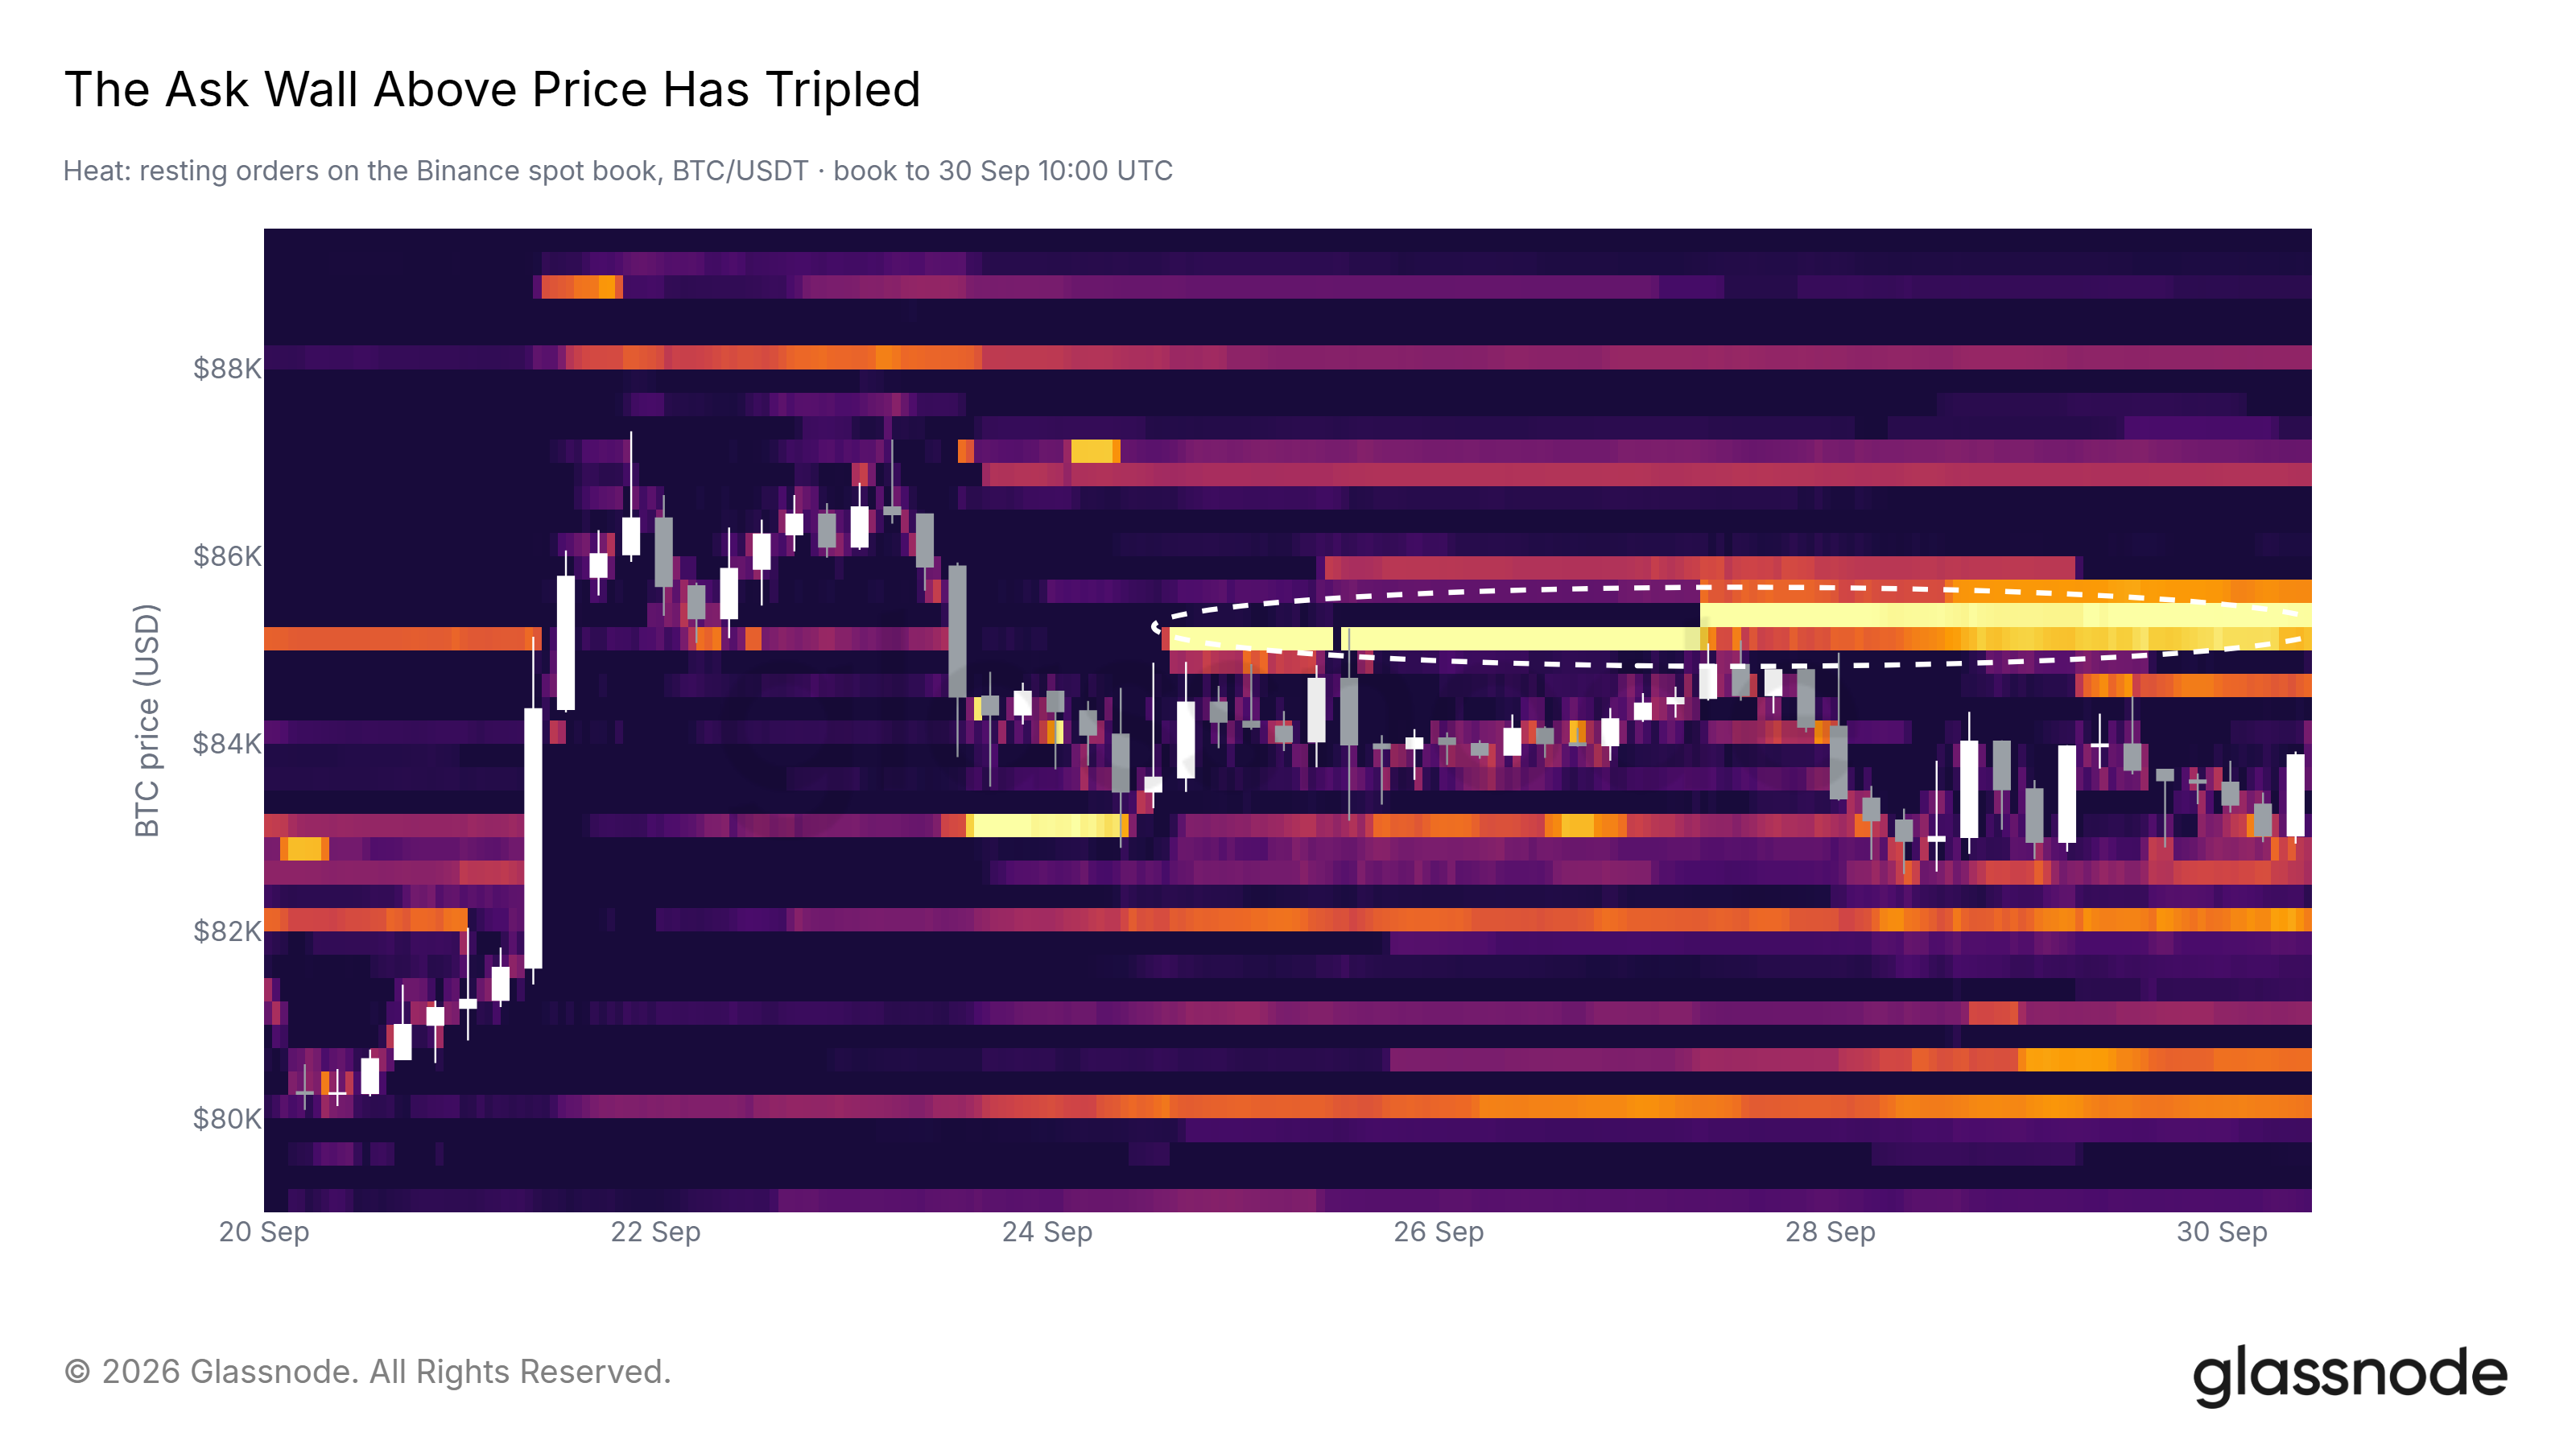
Last week, this report named $84K as the level to hold. Price has since slipped just below it, and a wall of sell orders on the Binance spot book now caps it from above.
The wall sits between $85K and $85.5K. It appeared on September 24 and has tripled in size since. Price has pushed into its lower half but never through it.
As long as those orders stay in place, the wall is the level that matters most. A sustained break above $85.5K would clear the largest resistance on the book.
Support Below
Recent Buyers in Profit
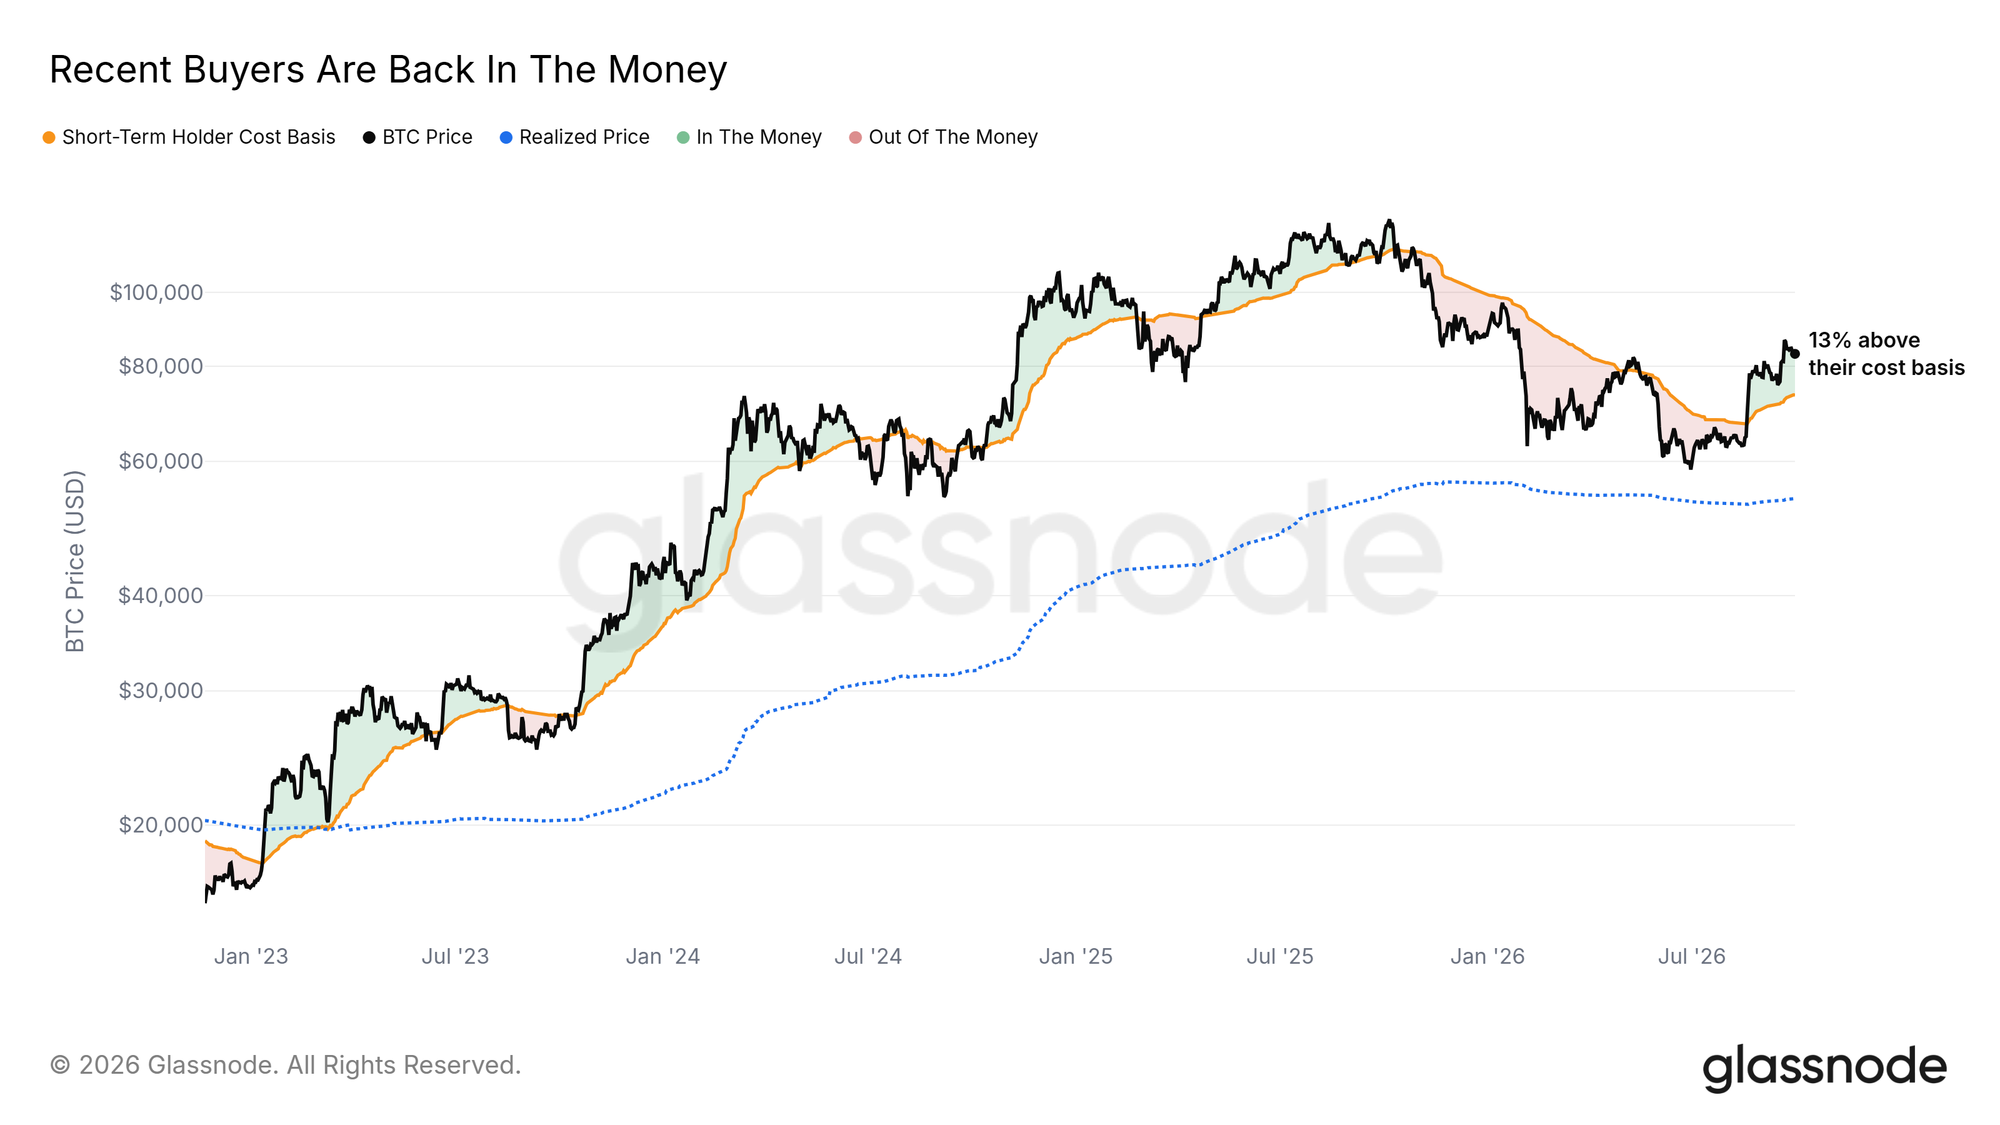
The Short-Term Holder Cost Basis, the average price paid for coins held less than 155 days, sits at $73.3K. Price trades about 13% above it, so recent buyers are in profit.
In the uptrends of 2023 and 2024, price spent months above this line, shaded green on the chart. A fall back below it would put recent buyers at a loss again, as they were for most of the first half of 2026.
Above the True Market Mean
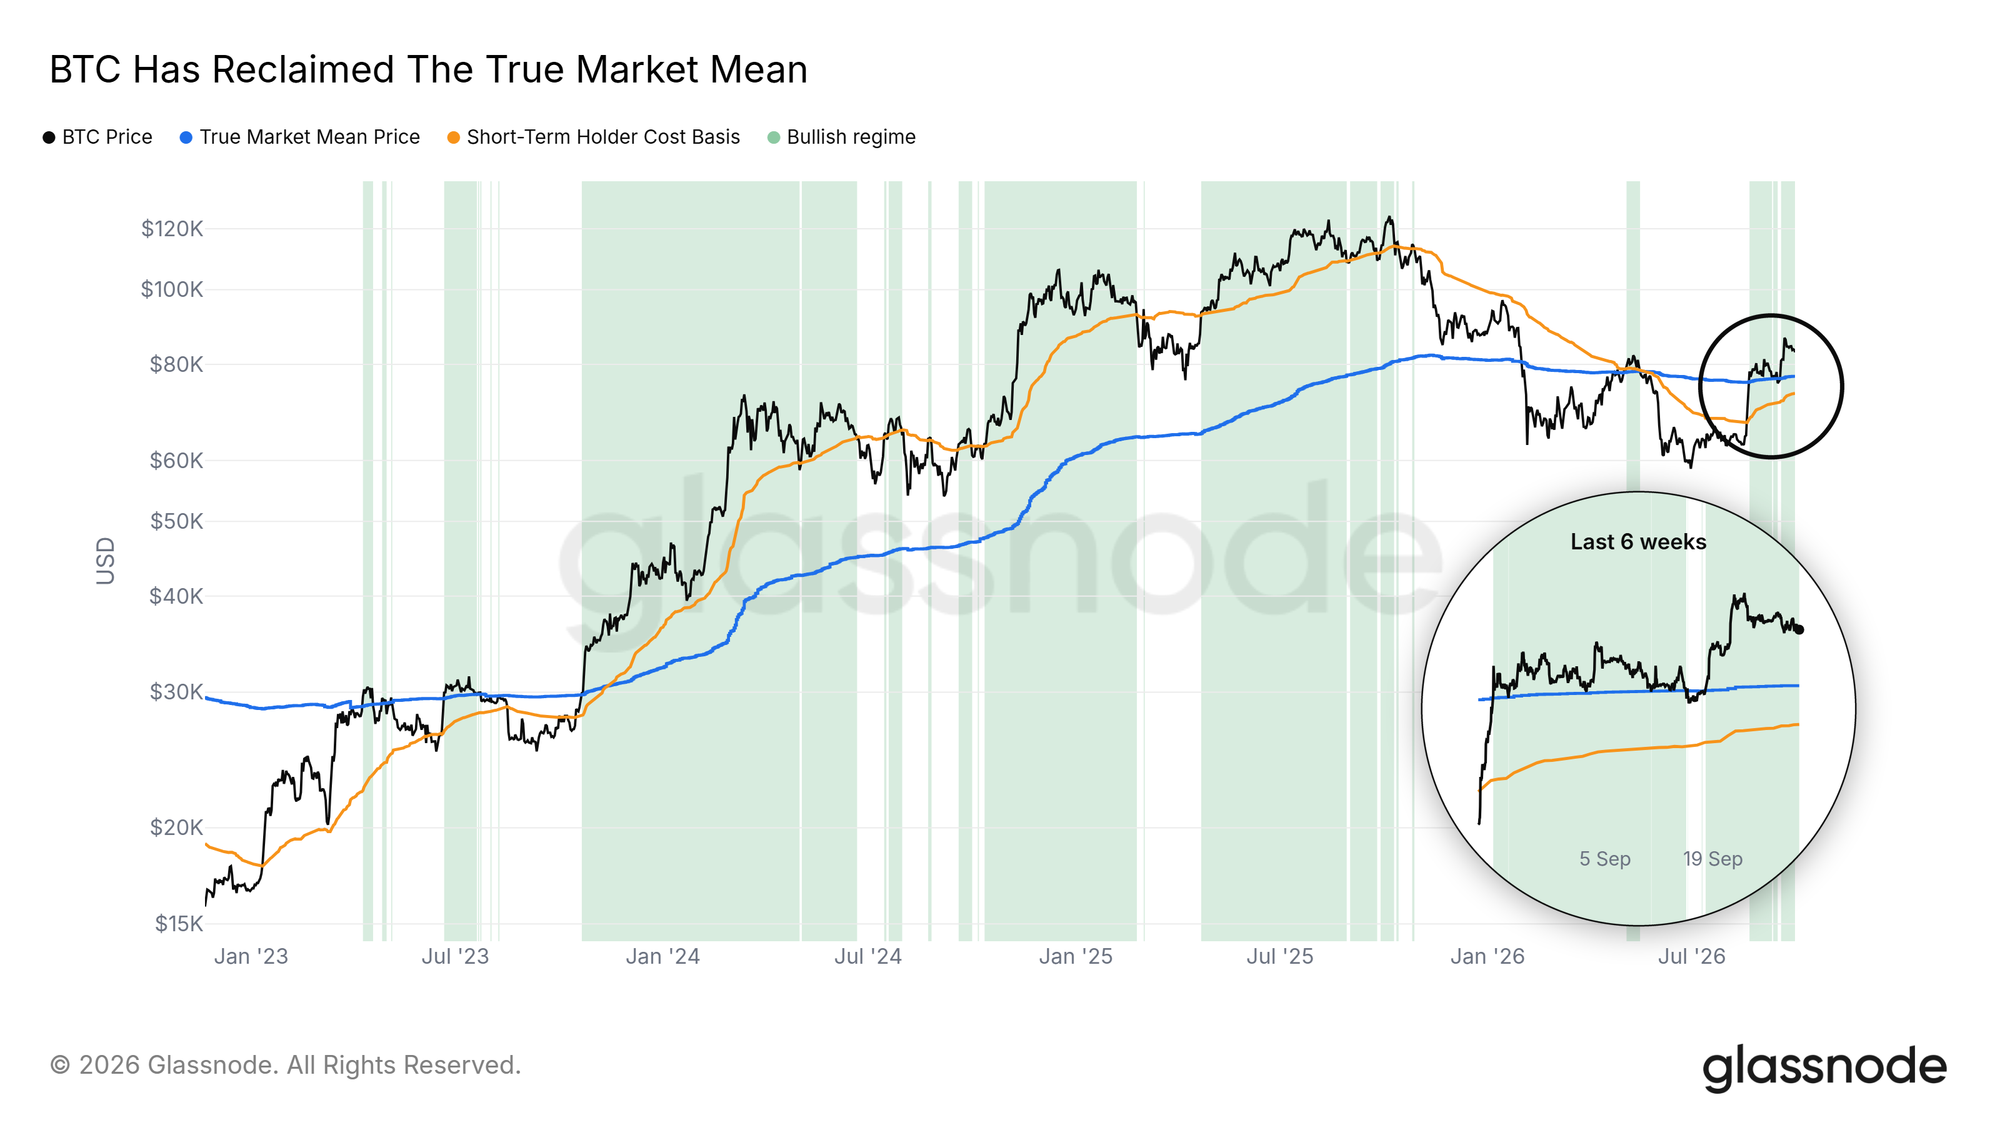
Price has also held above the True Market Mean, an estimate of the average price paid by active investors, since September 18. The mean sits at $77.2K, about 8% below price.
Over 2023-2025, stretches above both the True Market Mean and the Short-Term Holder Cost Basis marked the stronger phases of the uptrend, shaded green on the chart. The True Market Mean is the first support to watch: a daily close back below $77.2K would end the current stretch.
Volume Lags the Price
Trading Stays Quiet
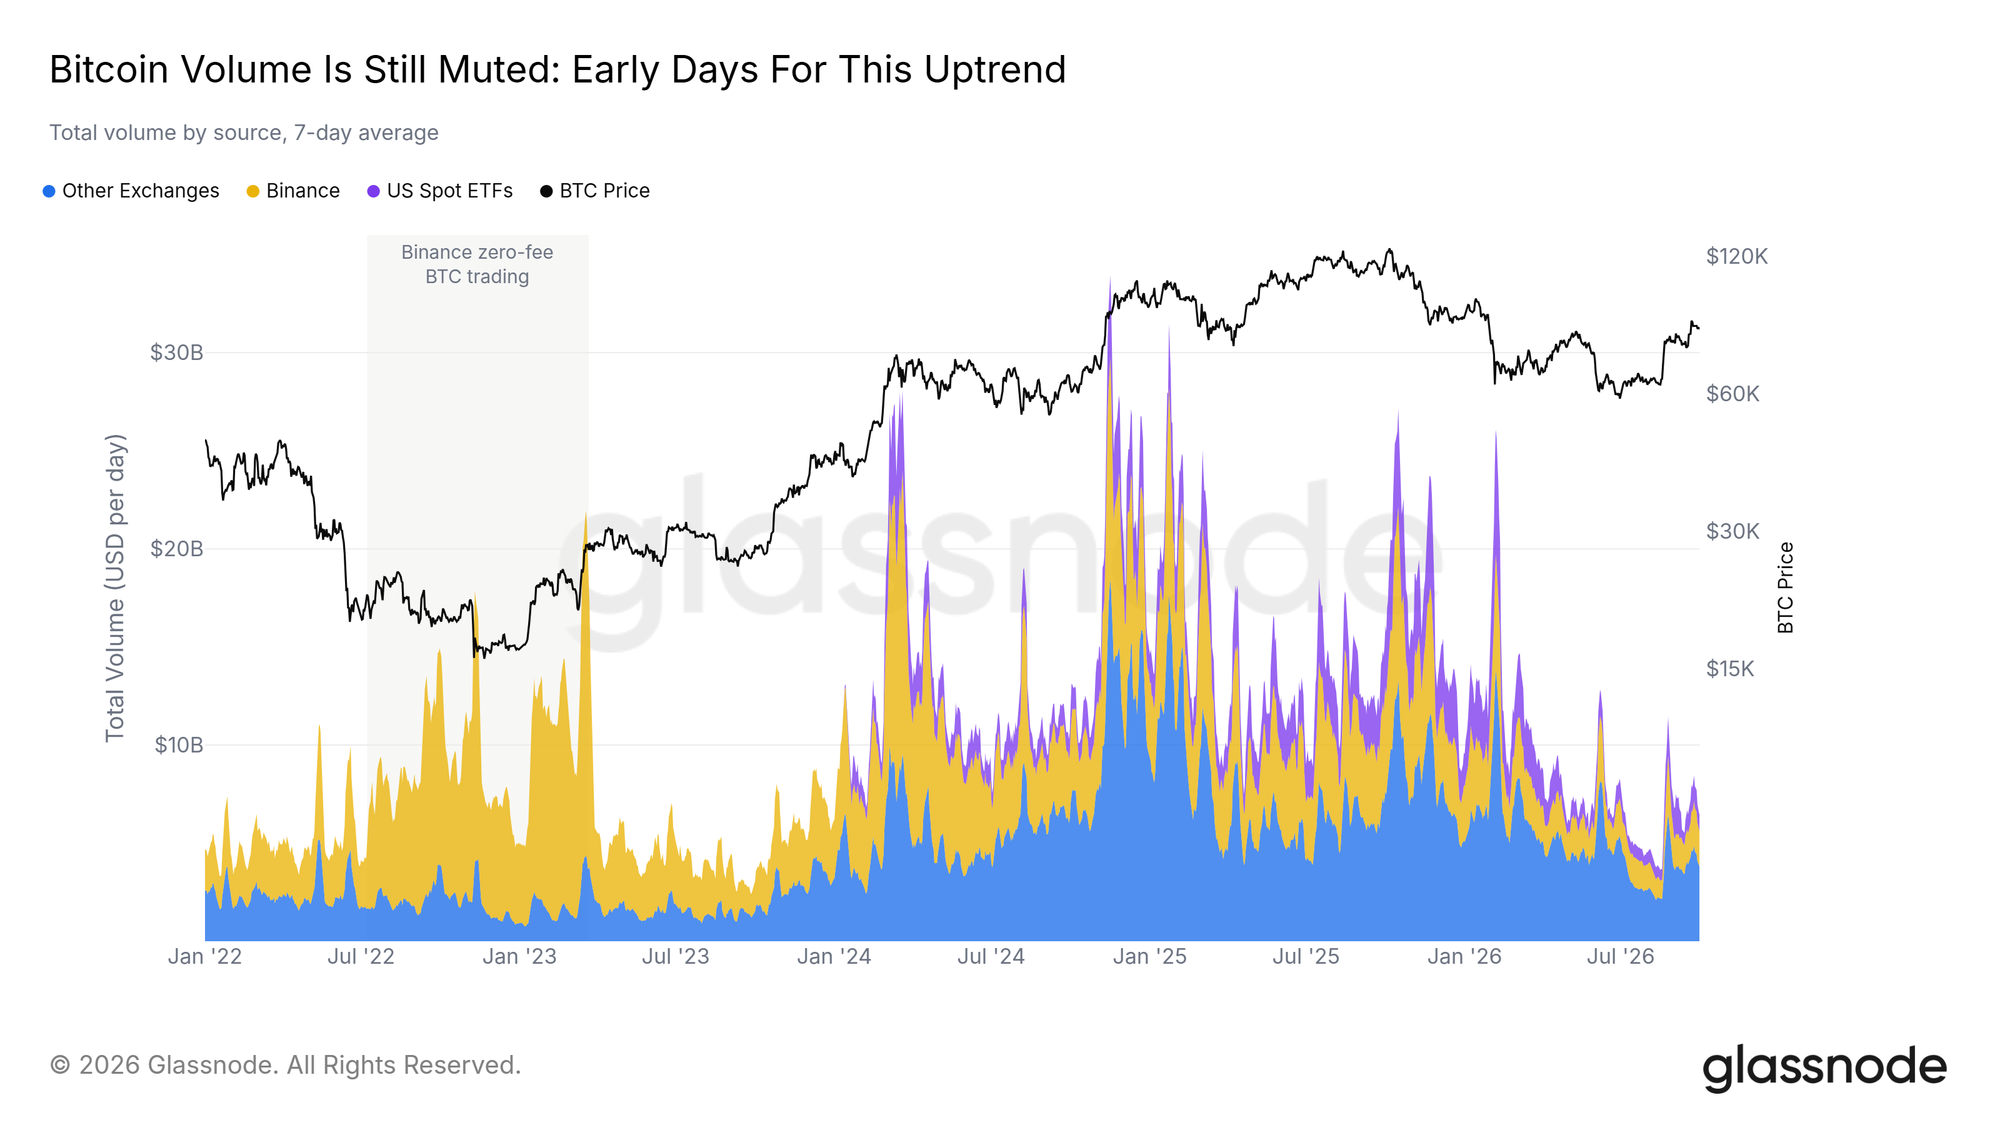
Last week, this report noted that spot volume had more than doubled from its August low. That rebound started from a very low base. Total Bitcoin volume, spot exchanges and US spot ETFs combined, averages about $6.4B a day and sits near the bottom of its range since the ETFs launched.
With so little volume behind it, the rally remains early and speculative, and broad demand has yet to arrive. A sustained rise in volume while price holds above the True Market Mean would signal that the uptrend is gaining wider support.
Altcoins Pause, Leverage Waits
Few Coins Pay Up
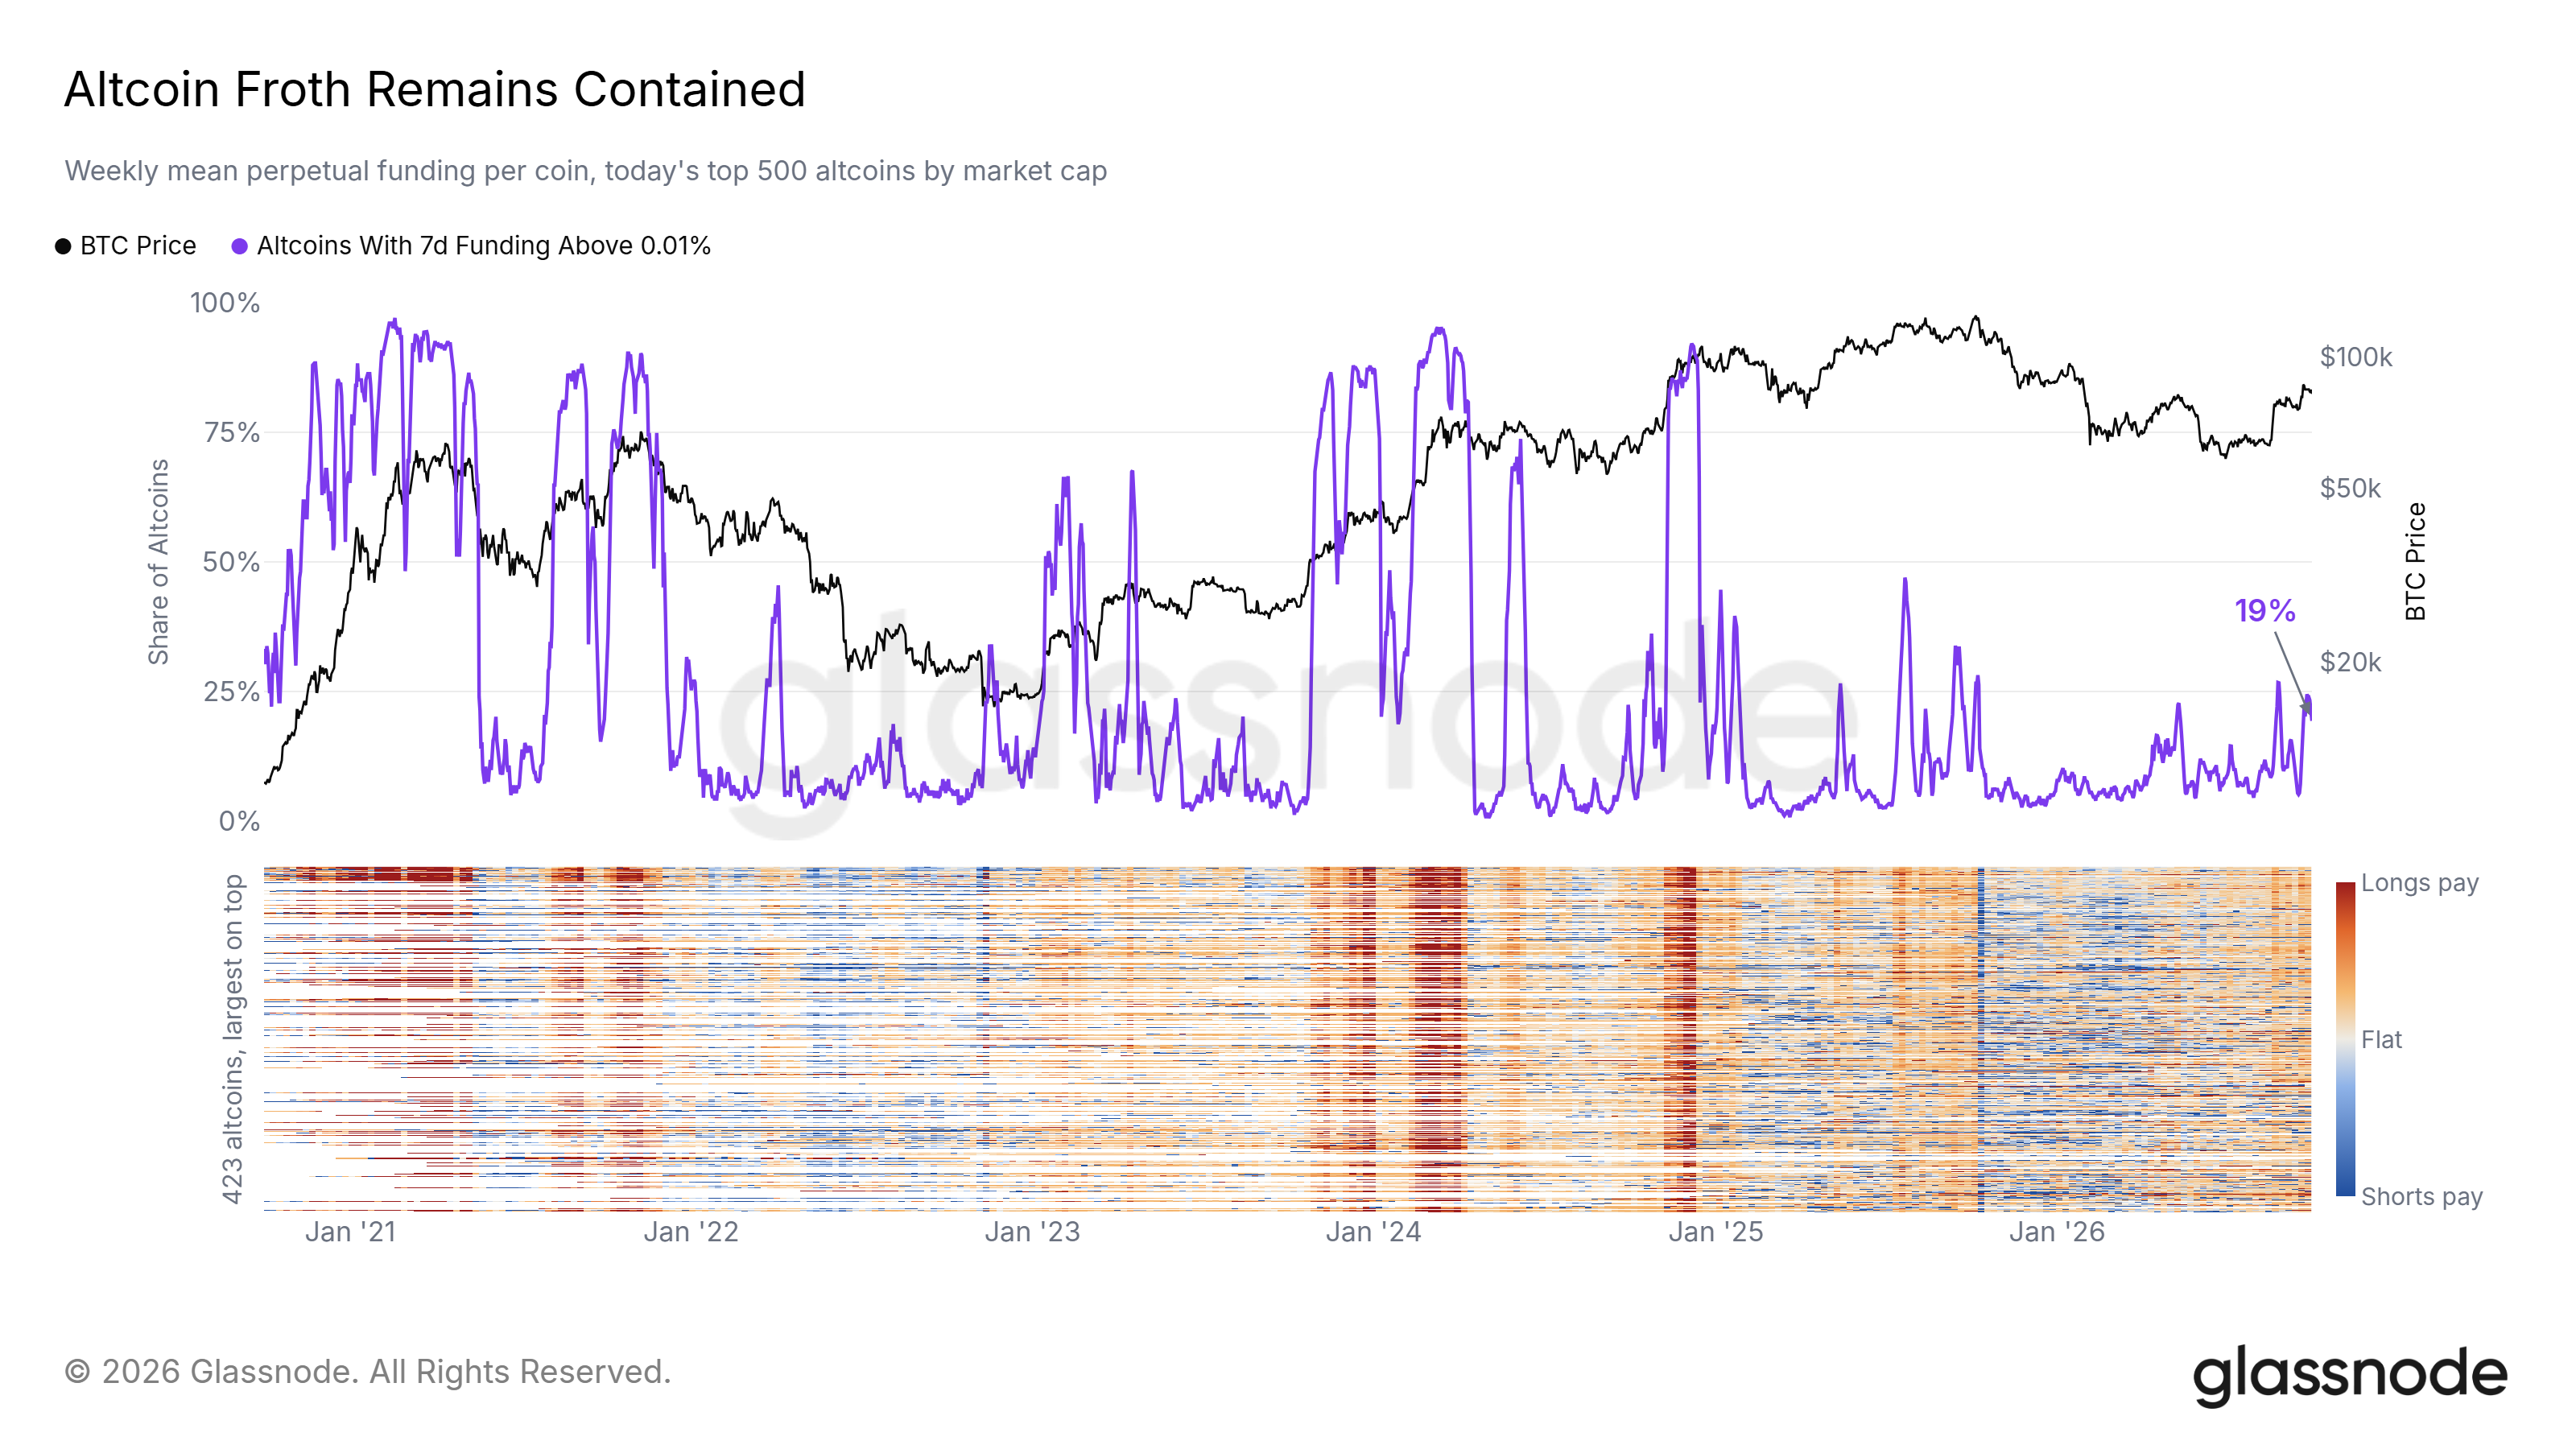
Altcoins have outpaced Bitcoin over the past month: most of the top 500 rose more than Bitcoin over 30 days. The advance stalled this week, with 6% of altcoins at a 30-day high, down from 49% on September 22.
Leverage stayed modest through the move. Funding on perpetual futures shows which side pays to hold its positions, and a high share of coins paying above the neutral rate of 0.01% signals crowded long bets. Only 19% of altcoins pay above it today, far below the share at every past altcoin top on the chart.
Holders Climb Out of Losses
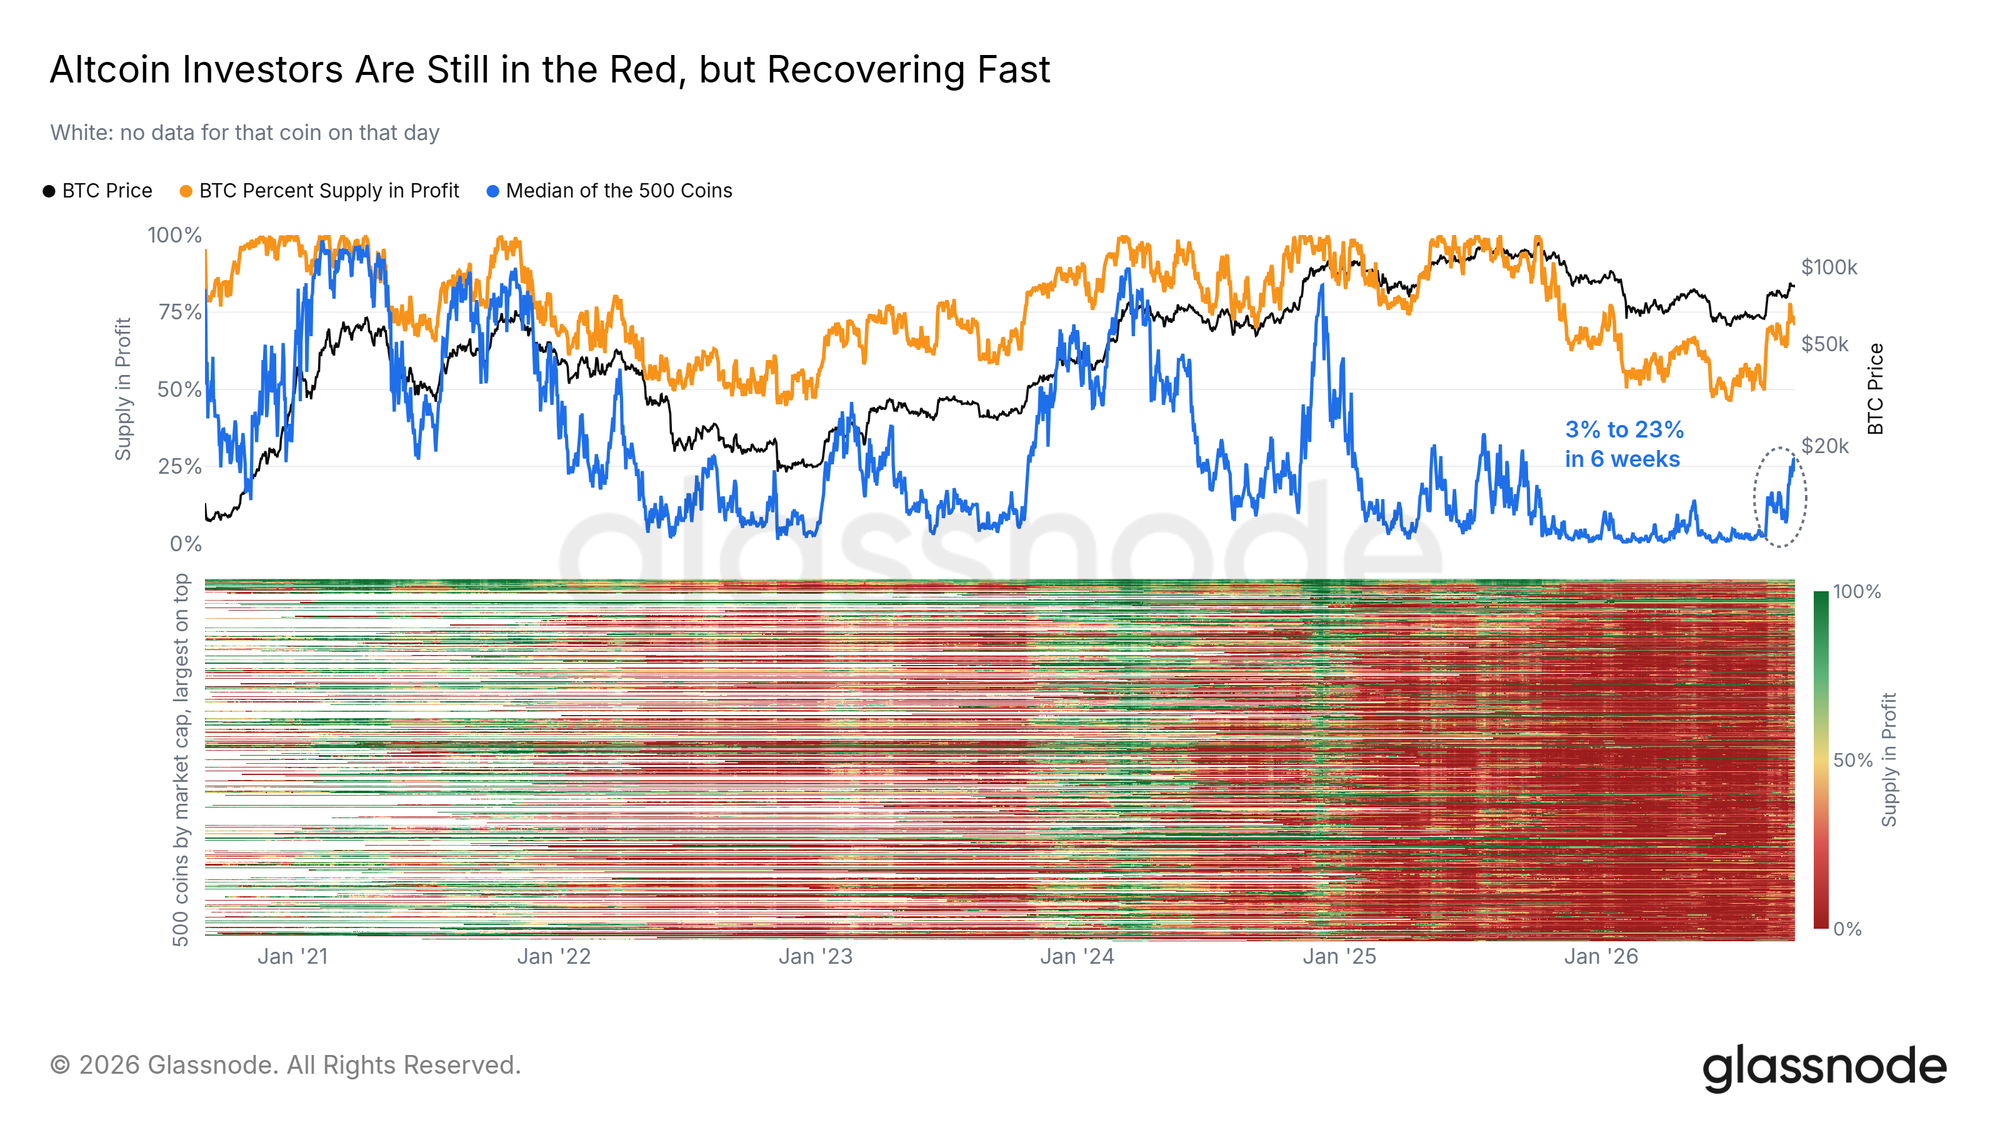
The rally is lifting altcoin holders out of deep losses. For the median altcoin, Percent Supply in Profit has risen from 3% in mid-August to 23%, the sharpest rise in over a year.
Most altcoin holders are still at a loss, far from the broad profits seen at the 2021 and 2024 peaks. A move of the median above half would show that the recovery has reached most holders.
Positions Have Not Grown
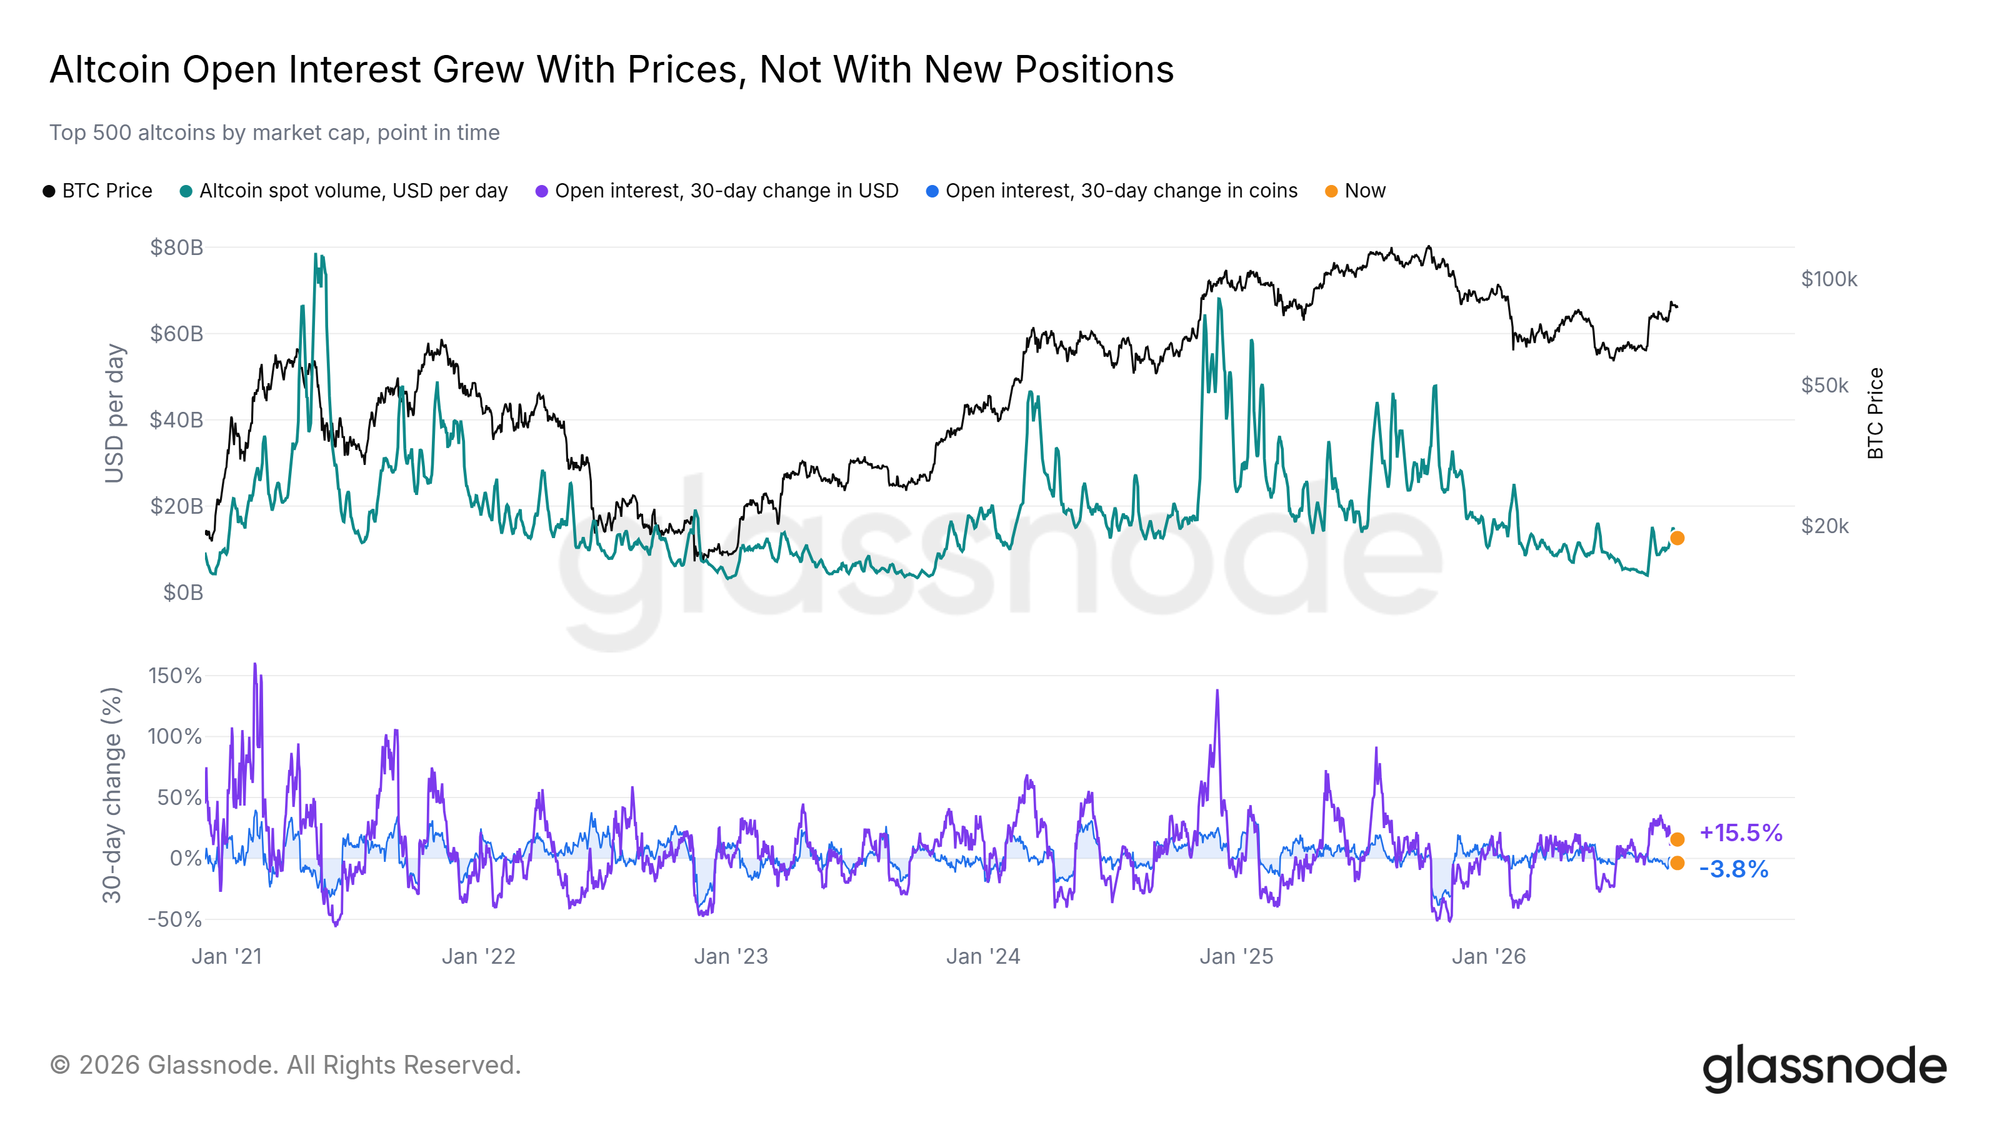
Open Interest tells the same story. The value of open altcoin perpetual futures positions has risen over the past 30 days in dollars but fallen when counted in coins: the gain comes from higher prices, and traders have not added new positions. Altcoin spot volume, in the top panel, has picked up since August but remains far below its 2024 and 2025 peaks.
As long as positions do not build in coin terms, the risk of a forced unwind stays low.
Conclusion
Bitcoin is in an early uptrend that has not yet drawn broad participation: on-chain support holds, but ETF demand has cooled and spot volume stays low. The wall of asks above price is the near-term test. A break above it on rising volume, with ETF inflows returning, would confirm that the uptrend is broadening. Heavier selling by long-term holders into a flat price, or a daily close below the True Market Mean at $77.2K, would weaken it. Altcoins have joined the rally without new leverage, which limits the risk of a forced unwind.
Data as-of September 28, 2026 for daily on-chain metrics and ETF flows, September 29, 2026 for the S&P 500 and long-term holder profit, and September 30, 2026 for hourly price, volume, funding and the Binance order book; the most recent daily points remain subject to revision.
Disclaimer: This report does not provide any investment advice. All data is provided for informational and educational purposes only. No investment decision shall be based on the information provided here, and you are solely responsible for your own investment decisions.
Exchange balances presented are derived from Glassnode’s comprehensive database of address labels, which are amassed through both officially published exchange information and proprietary clustering algorithms. While we strive to ensure the utmost accuracy in representing exchange balances, it is important to note that these figures might not always encapsulate the entirety of an exchange’s reserves, particularly when exchanges refrain from disclosing their official addresses. We urge users to exercise caution and discretion when utilizing these metrics. Glassnode shall not be held responsible for any discrepancies or potential inaccuracies.
