Running on Empty
Bitcoin has slipped below the Short-Term Holder Cost Basis and trails stocks, while stablecoins, the ETFs and US buyers all show capital leaving. Leverage has been flushed and two large wallet cohorts have started buying, which keeps the August trend change alive above the June low.


Executive Summary
- Bitcoin has slipped below the Short-Term Holder Cost Basis at $75.6K and trails stocks, while the capital that could lift it keeps leaving.
- Stablecoin supply is shrinking at the fastest pace since June 2022, the ETFs are net sellers, and Bitcoin trades at a discount on Coinbase.
- On the other side, the slide has cleared most long leverage near price, bids outweigh asks in the order book, and two large wallet cohorts have started accumulating.
- The September high was the first higher high since the 2025 all-time high, and that trend change holds as long as price stays above the June low at $58.5K.
Ready to get ahead of markets and sharpen your foresight? Try Glassnode. Sign up or talk to sales.
Recent Buyers Underwater
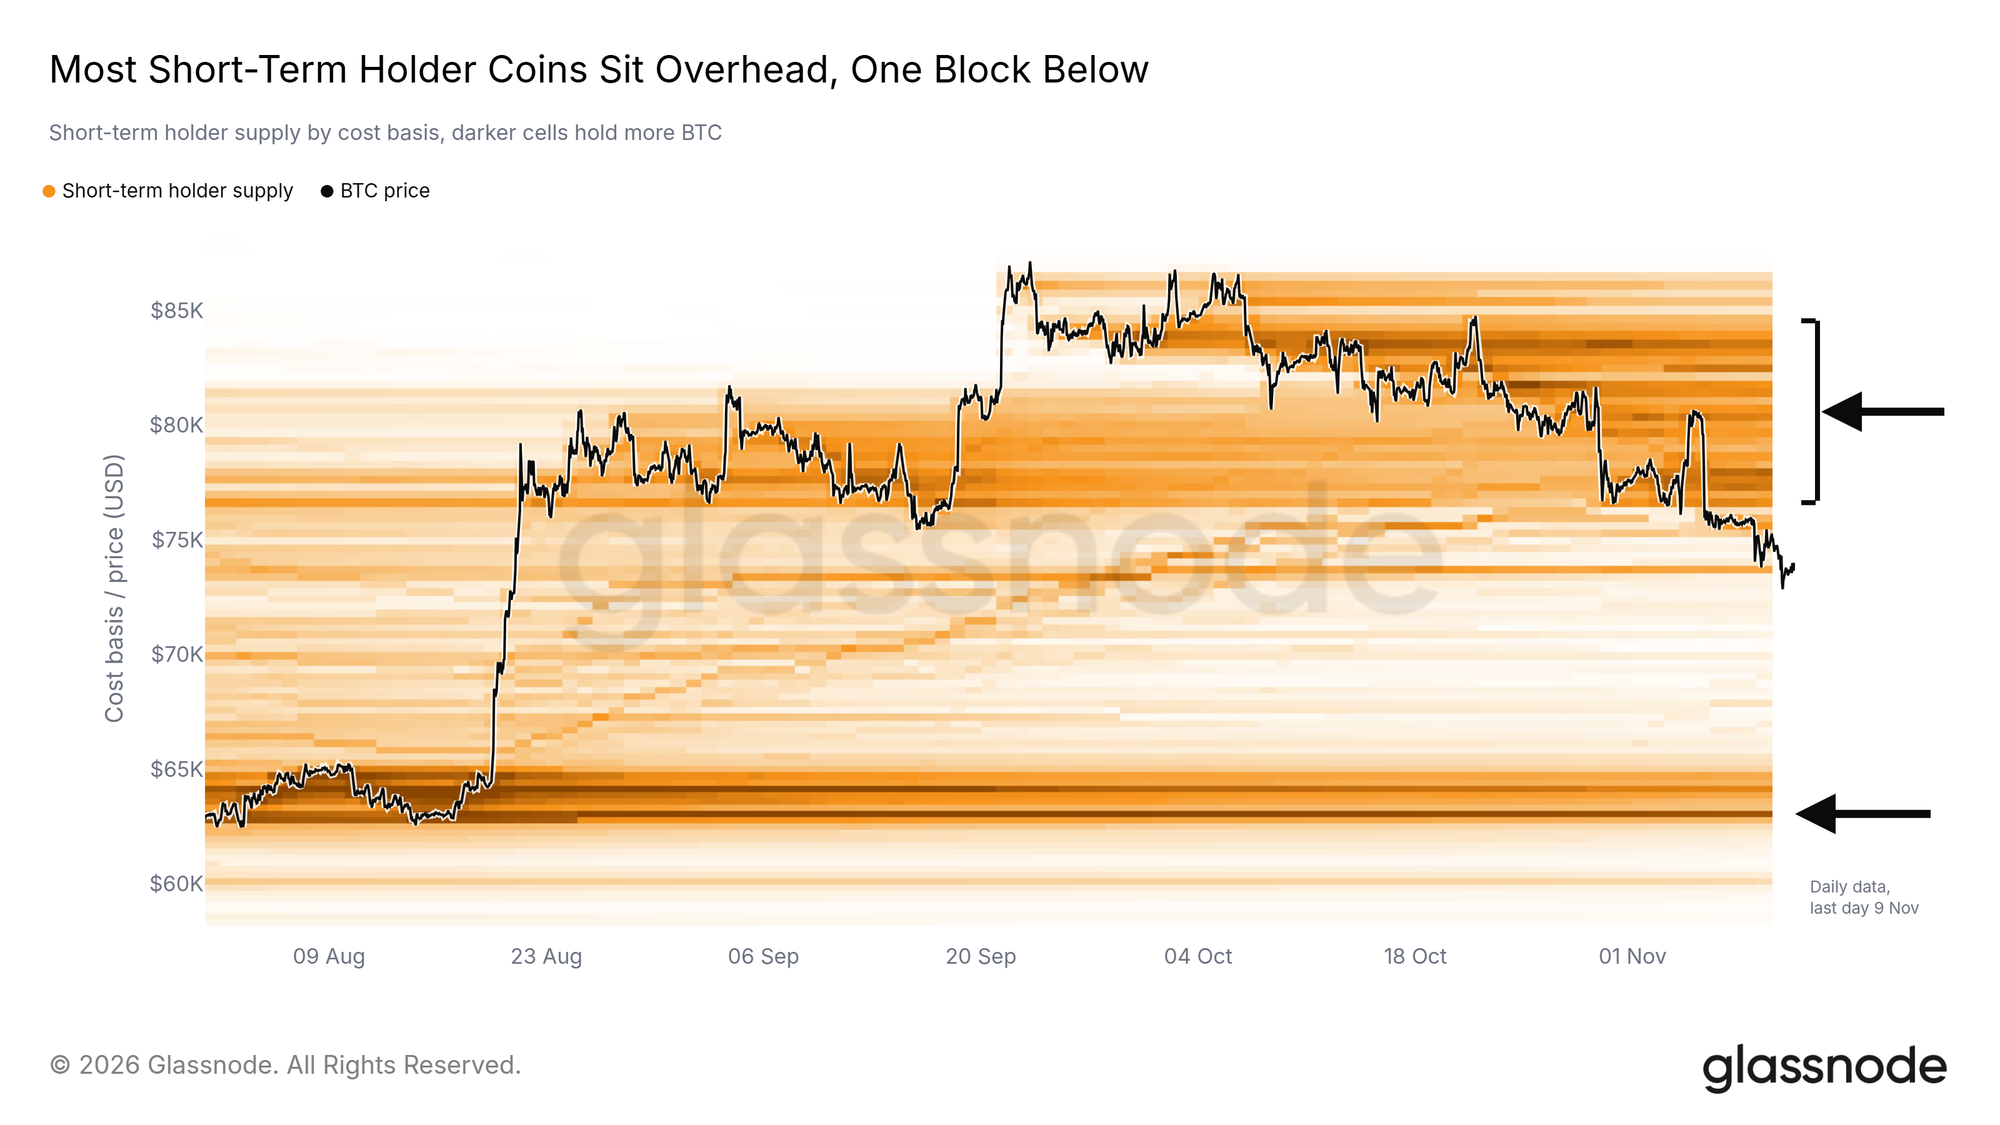
Last week we named the $73K to $76K band as the level to watch. Bitcoin has since slipped into it and trades near $74K, below the Short-Term Holder Cost Basis at $75.6K, the average price paid by investors who bought within the past 155 days. At the September high, nearly all short-term holder coins were in profit. Today about 35% are, and those who sell are doing so at a small loss on average.
The Cost Basis Distribution shows where these coins were bought. About two thirds now sit above price, in three bands bought between August and October that reach up to $83.6K. Many of these holders may use a rally to get out at breakeven. Below price, the only dense block sits between $62K and $66K, bought around the August low.
Note that the larger structure from August still stands. The September high was the first higher high since the 2025 all-time high, and price remains well above the June low at $58.5K. A reclaim of the True Market Mean at $77.5K would put about half of short-term holder coins back in profit.
Left Behind by Stocks
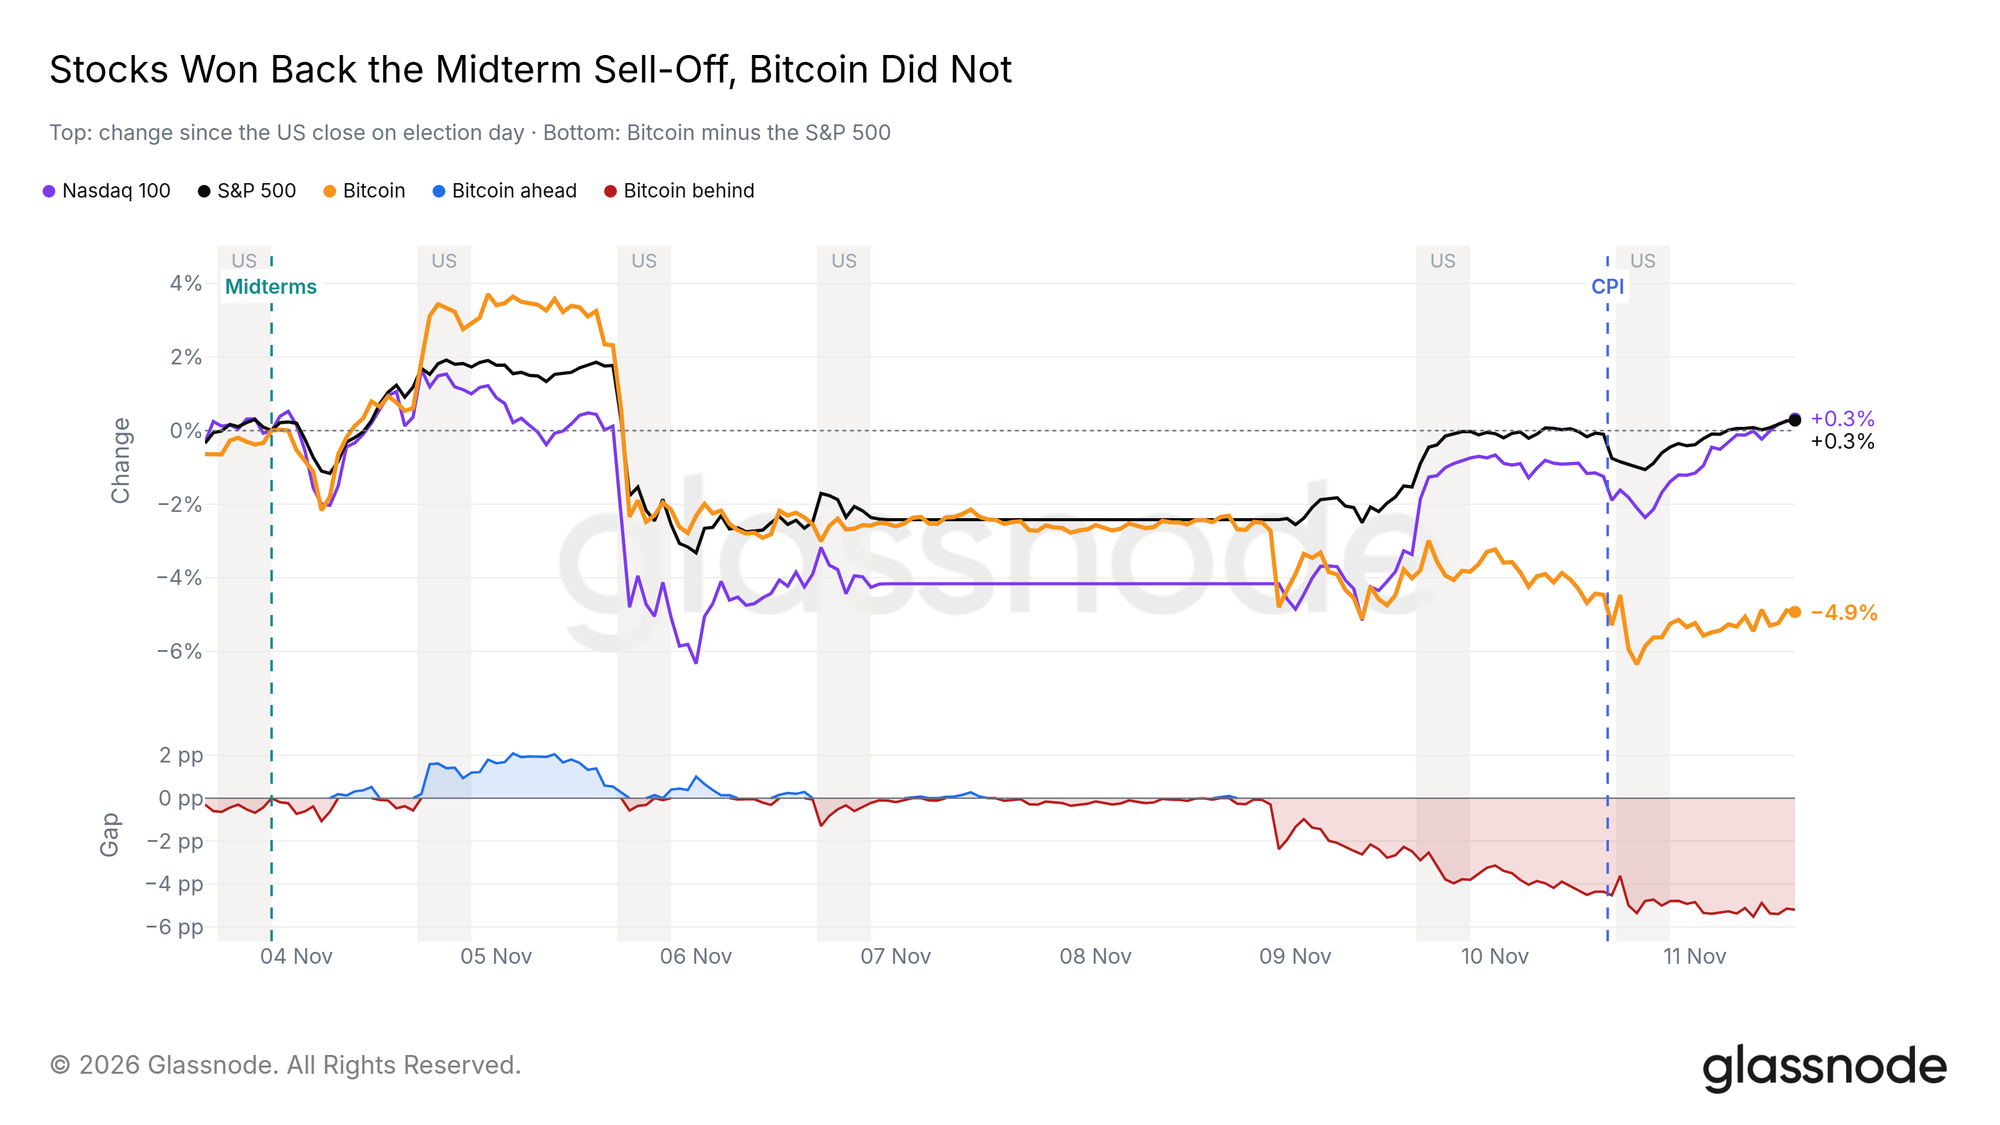
Last week we noted that most of Bitcoin's midterm decline came before the vote. The sell-off that began on November 5 then hit stocks and Bitcoin alike. Since November 9 their paths have split: the S&P 500 and the Nasdaq 100 have recovered above their election-day close, while Bitcoin fell again after the CPI release on November 10 and is still down about 5%.
A move back above its election-day close of $77.8K would put Bitcoin back in step with equities.
Bonds Price More Hikes
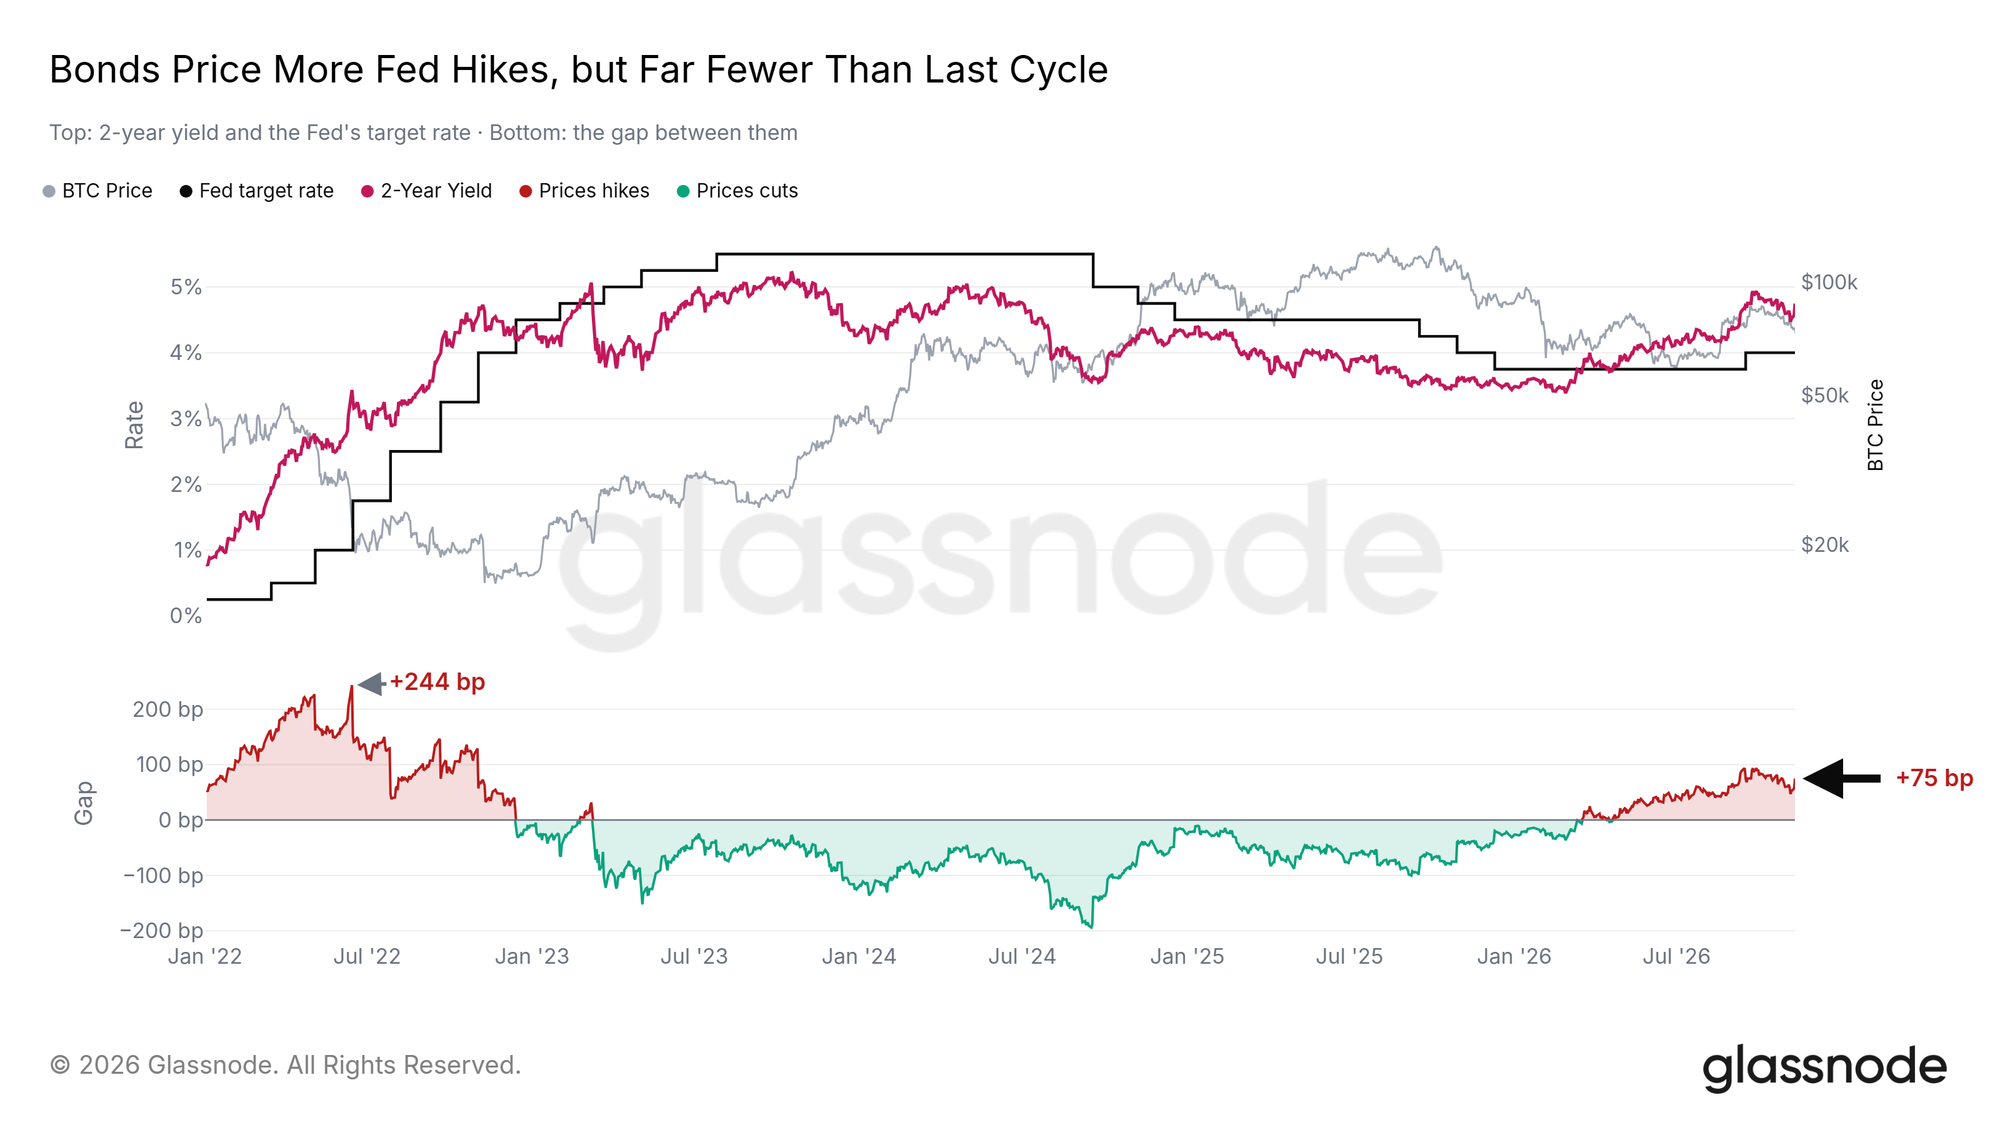
Rates add to the pressure. The two-year Treasury yield reflects where traders expect the Fed's policy rate to average over the next two years. At 4.75%, it sits 75 basis points above the Fed's current rate of 4%, so the bond market prices further hikes.
Note that this is far from the shock of 2022. In June 2022, the same gap peaked at 244 basis points, and today's gap is about a third of that. It has also narrowed since late October. Higher rates remain a headwind for risk assets, but the bond market does not expect a repeat of 2022.
Stablecoins Leave
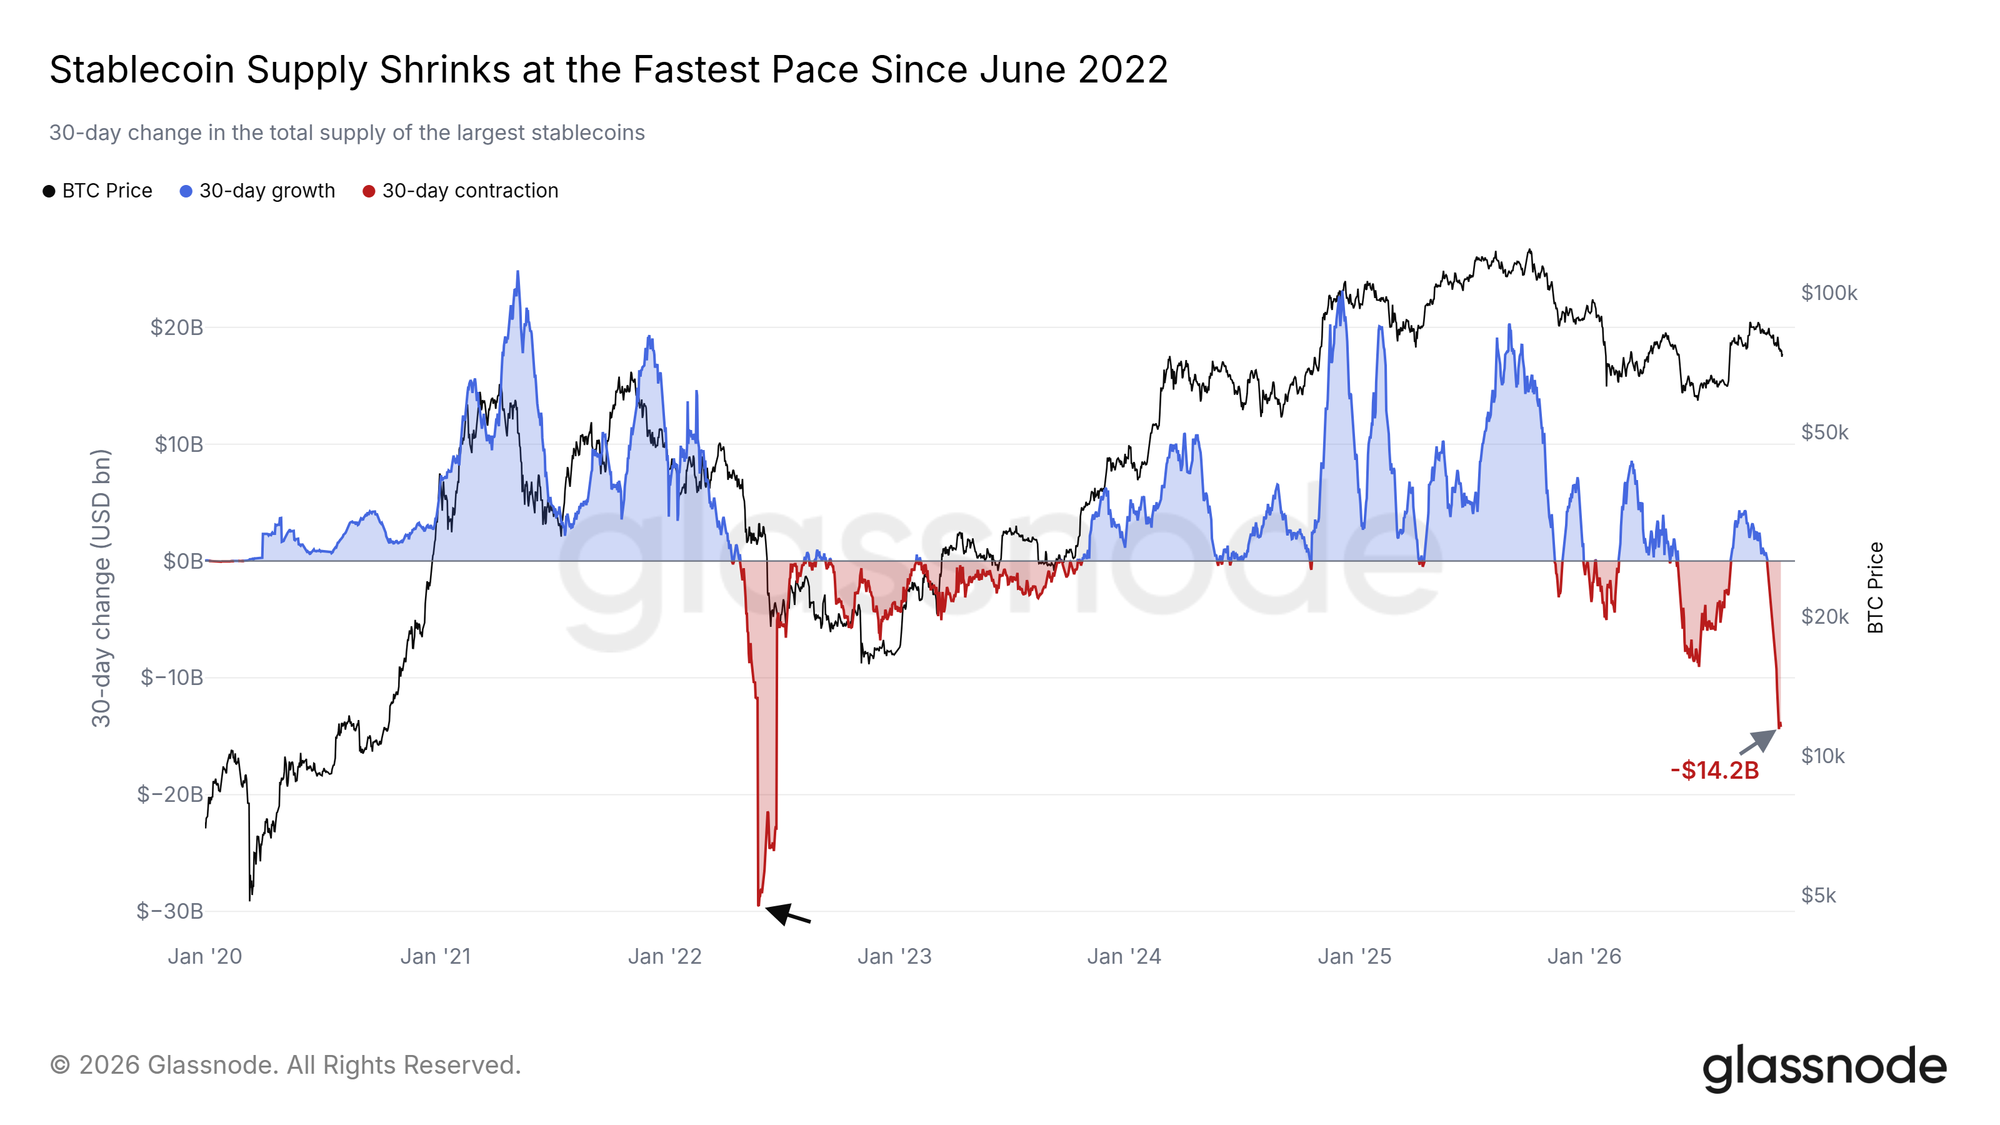
Stablecoins are the cash of the crypto market: the dollars traders hold on exchanges and on-chain before they buy. Over the past 30 days, total stablecoin supply has fallen by $14.2B, the fastest contraction since June 2022.
A shrinking supply means holders are redeeming stablecoins for dollars and taking that cash out of the market, which leaves less fuel for a rally. The same pressure shows in Tether, which trades slightly below $1. Should the 30-day change turn back to growth, it would be the first sign that new money is coming in.
US Demand Fades
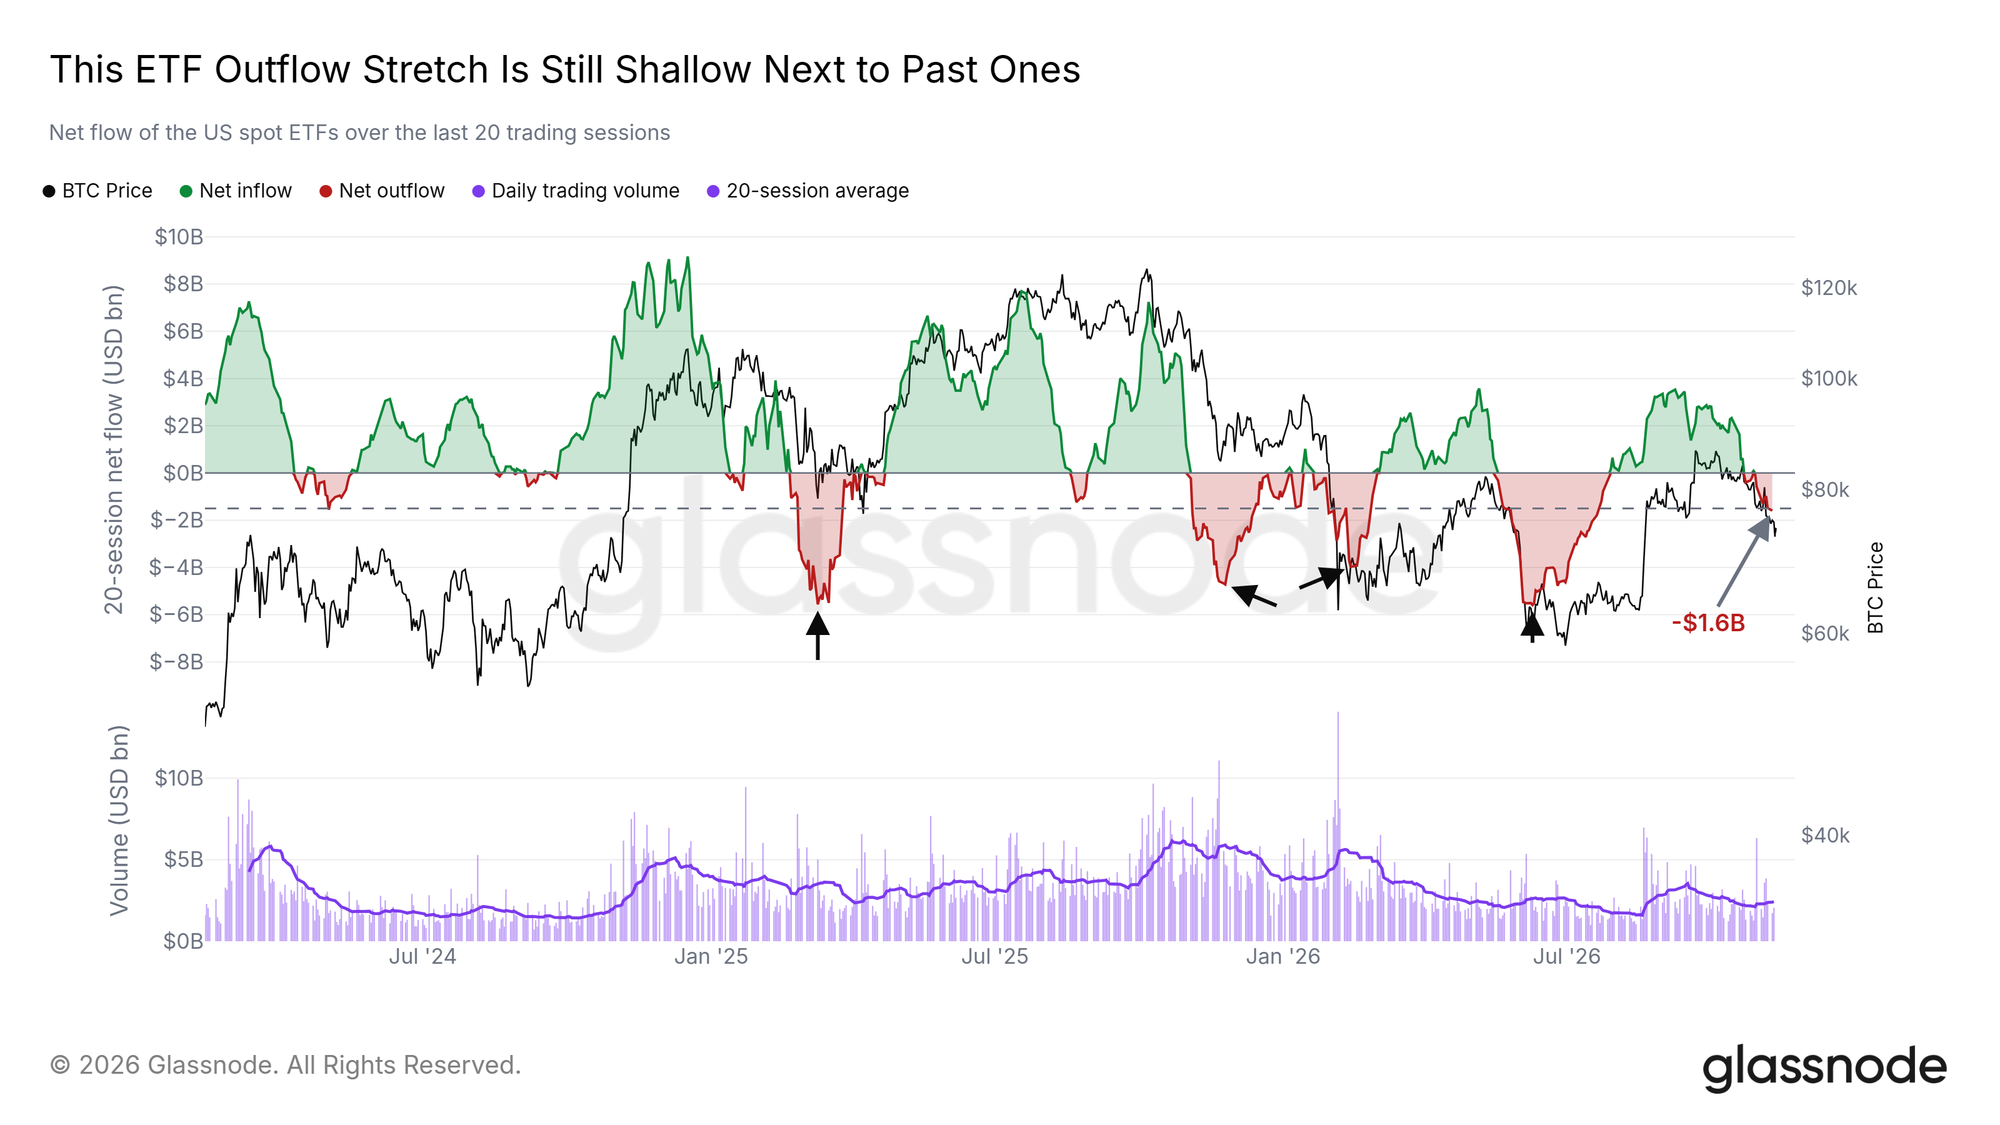
The US spot ETFs have turned to redemptions. Over the past 20 sessions, the funds saw $1.6B in net outflows, and on November 9 that total crossed the $1.5B mark we use to define an outflow stretch.
By the standards of past stretches, this one is still shallow: most of the earlier ones went far deeper. Each time, inflows returned only after Bitcoin had made its low, so a return of inflows would confirm a low after the fact.
No Premium on Coinbase
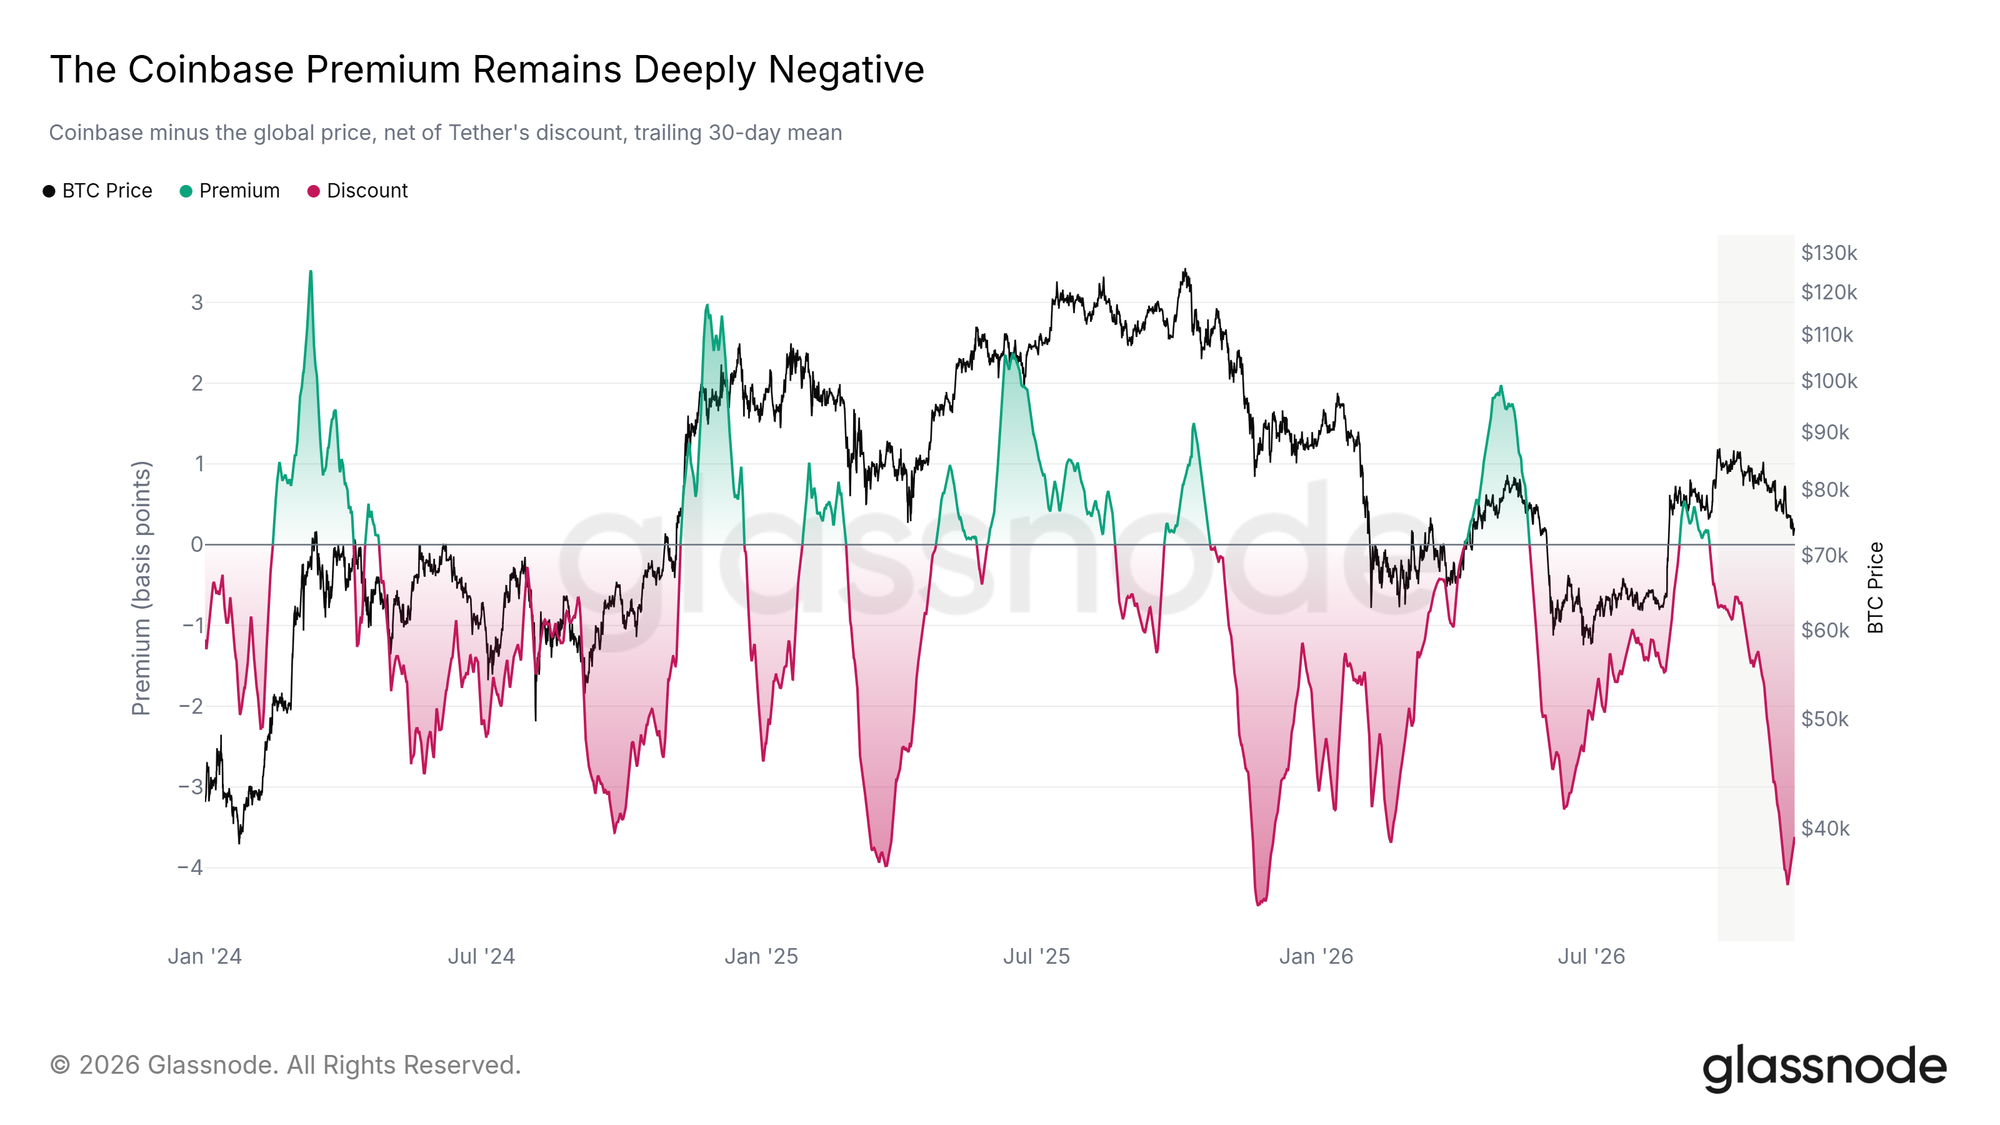
The Coinbase Premium compares Bitcoin's price on Coinbase, the main venue for US investors, with the global price. We strip out the part caused by Tether trading below $1, which otherwise makes the discount look deeper than it is. On a 30-day average, the premium has stayed negative through the whole slide from the September high, and the discount is now the deepest since February.
In past rallies, the premium ran positive as US buyers paid up for Bitcoin. Today they are not. Should the premium turn positive and hold there for weeks, it would show demand from the US returning.
Thin Near Price, Heavy Below
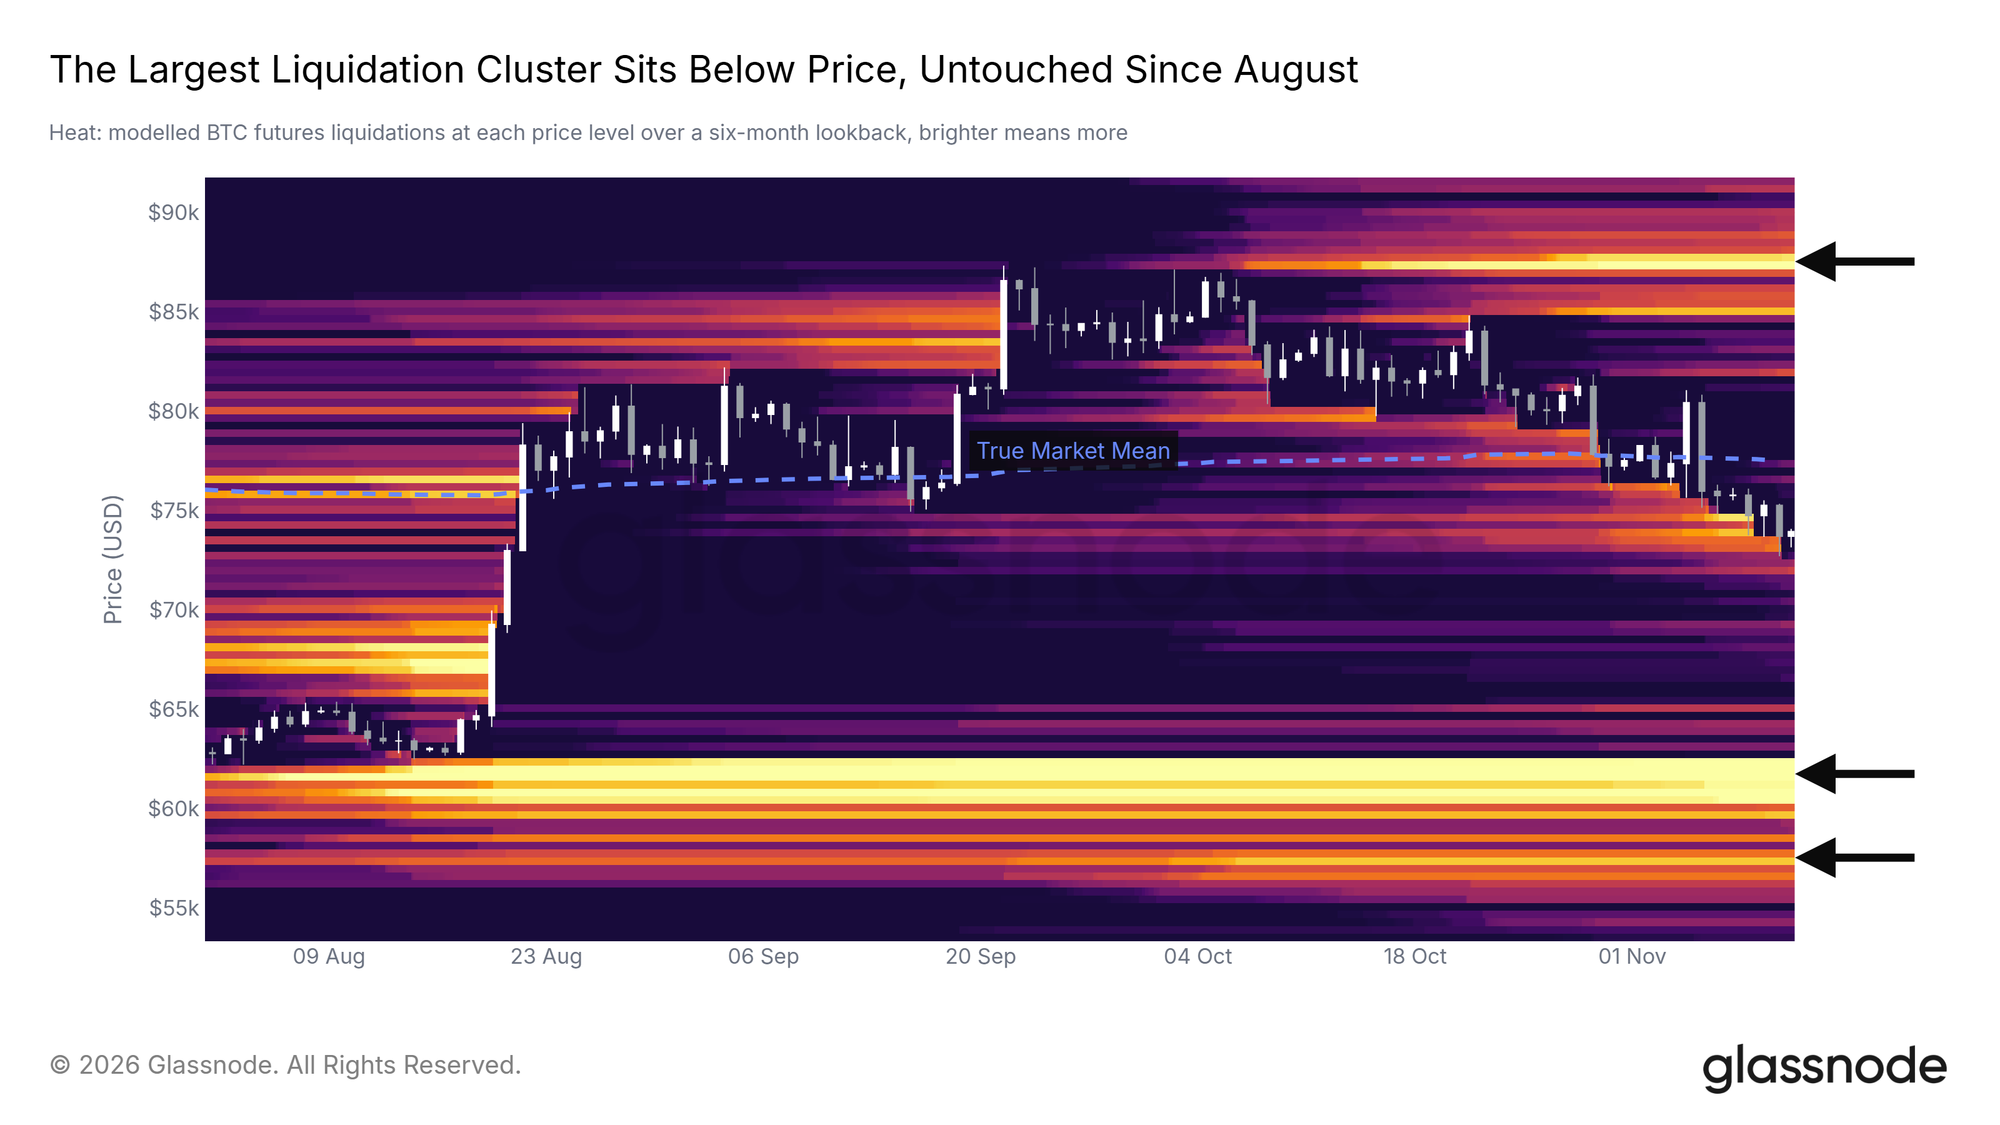
The liquidation heatmap models the prices at which leveraged futures positions would be forced to close. On the positive side, the slow grind from the September high has run through most of the long liquidation levels built up on the way down, as the dark area trailing the candles shows. That removes much of the fuel for a forced-selling cascade near price.
The largest cluster on the six-month map sits well below, between $59.5K and $62.6K, and has stood untouched since the August low. Between it and price, the map is thin. Meanwhile, open interest has rebuilt to its level at the September high even as price fell about 15%, which suggests traders have added short positions into the decline. Should price turn higher, those shorts would have to buy back; the largest cluster above price sits near $87.5K.
Bids Below, Thin Above
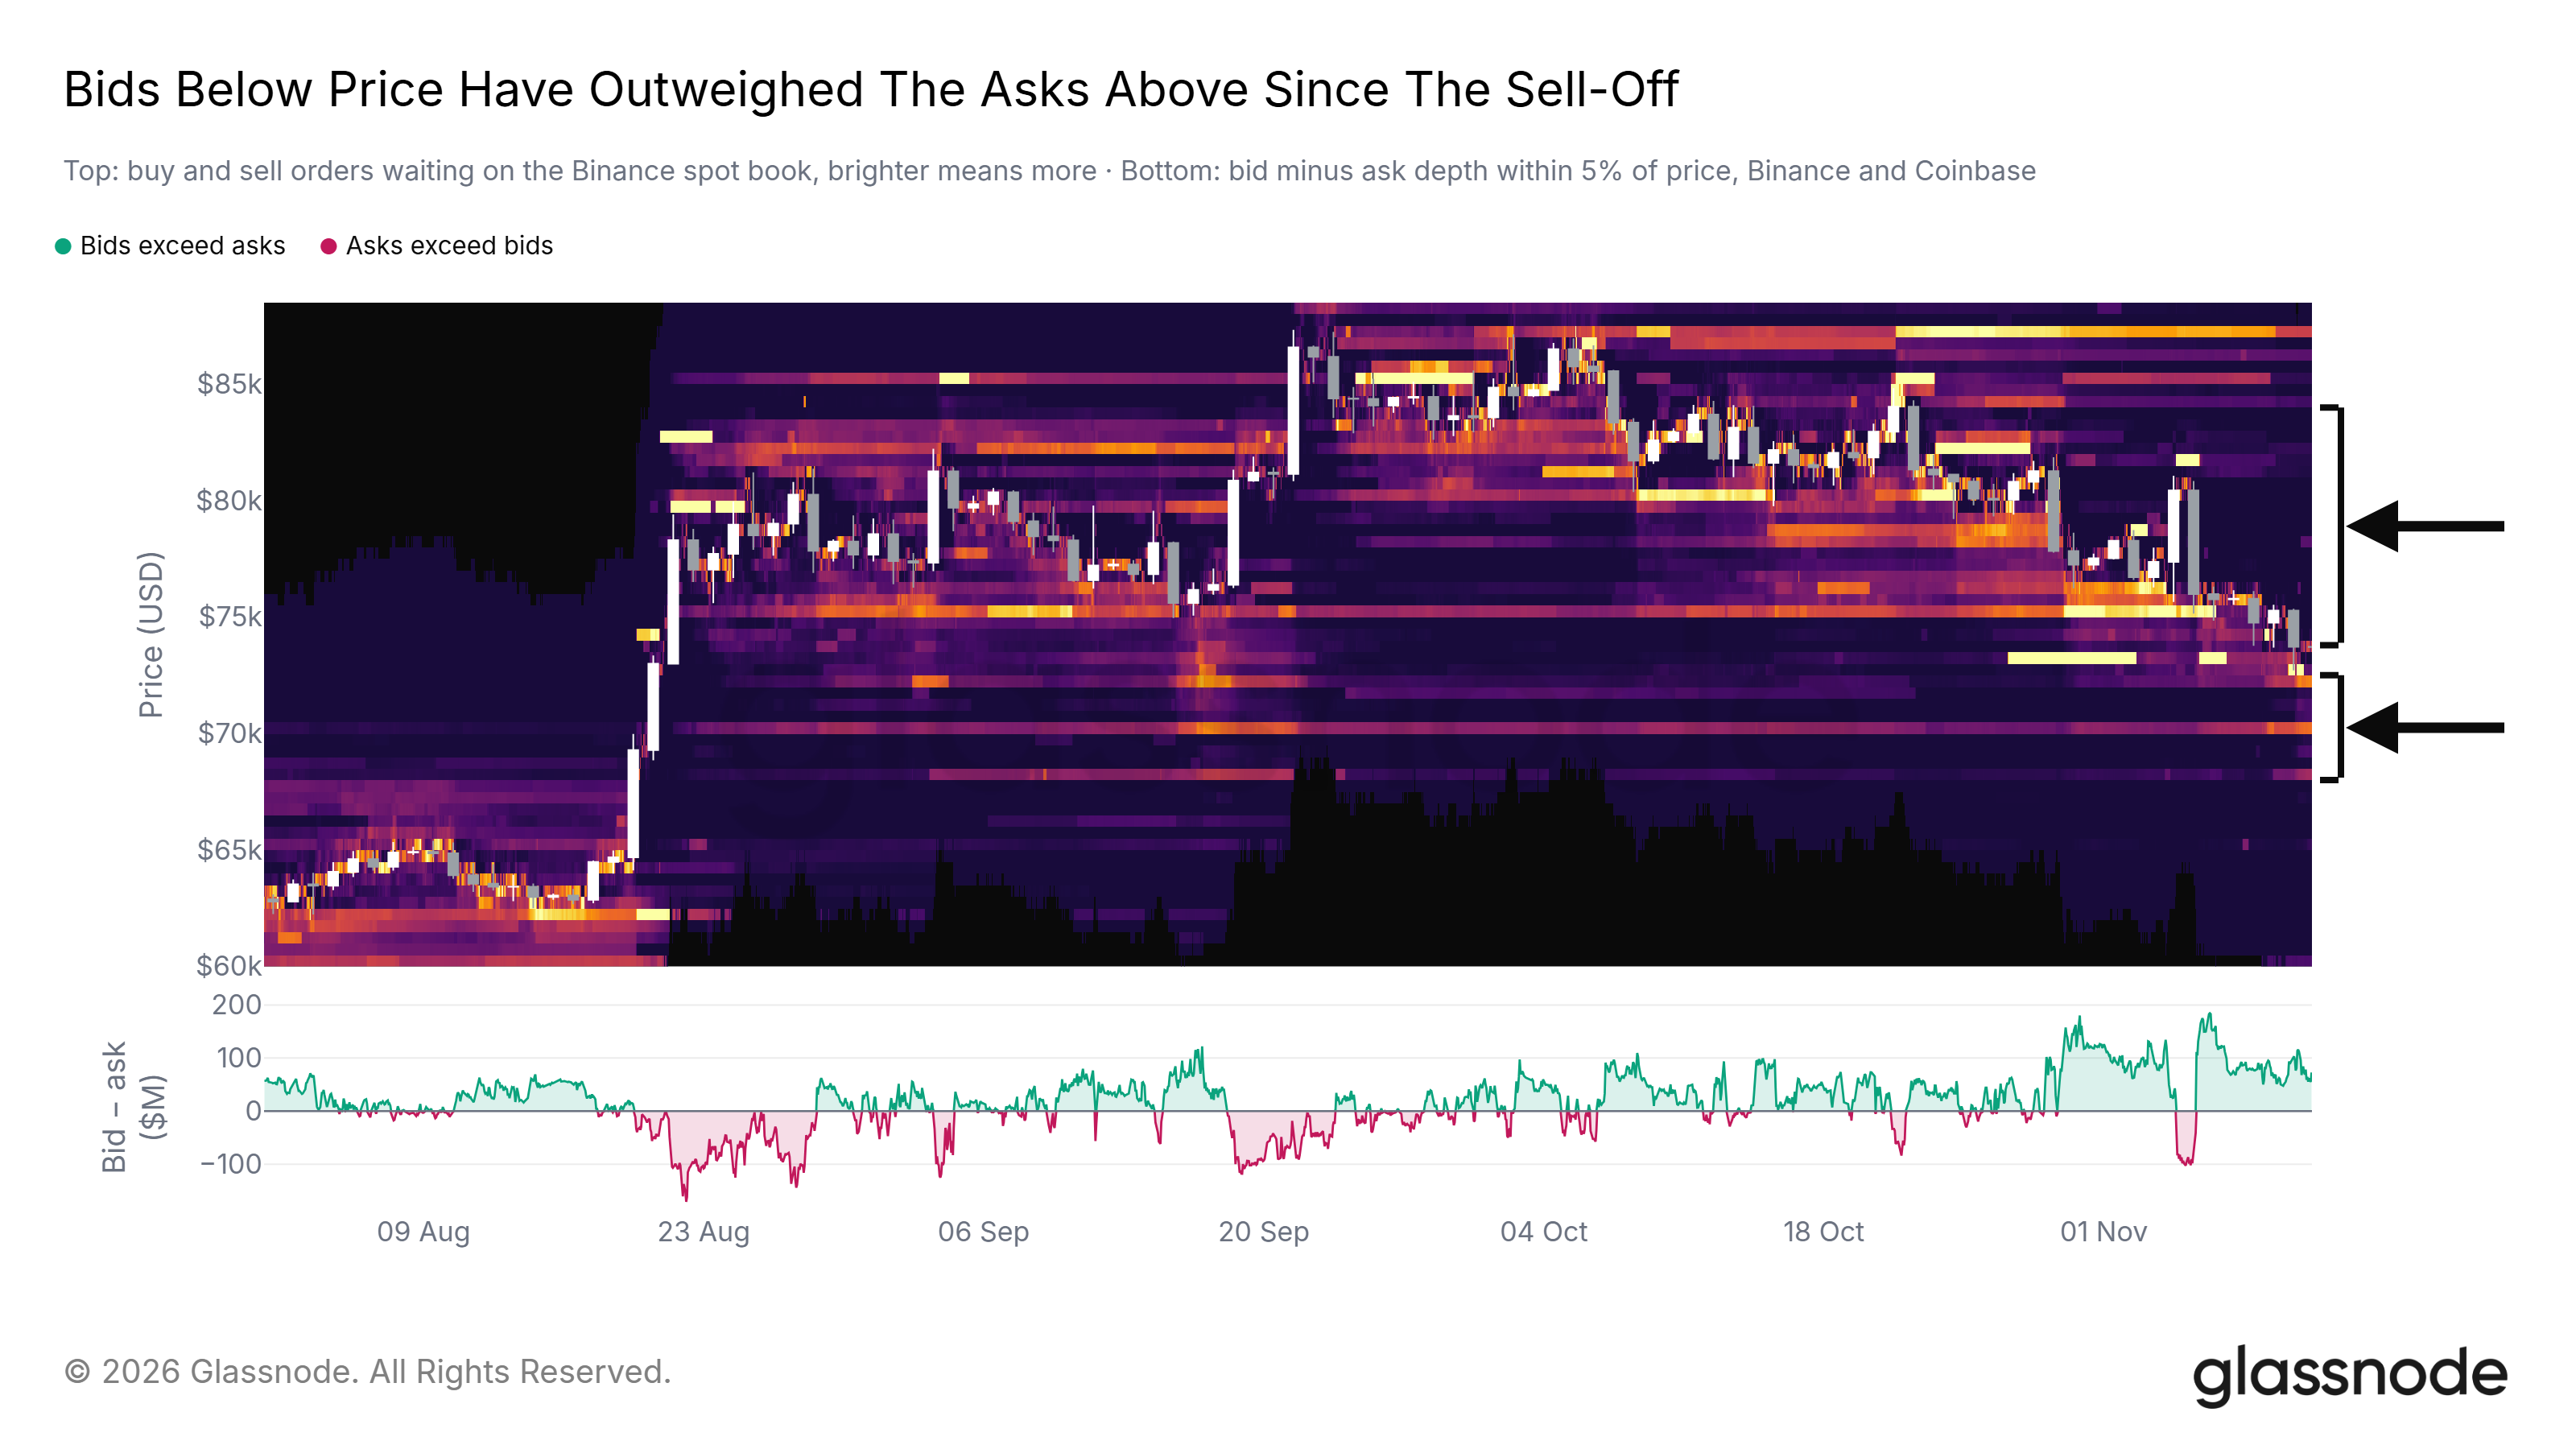
The spot order book leans the same way. Since the sell-off on November 5, resting buy orders within 5% of price on Binance and Coinbase have outweighed sell orders in every hour. The lower bracket on the chart marks the largest bids, in a block between $68K and $72.5K.
The upper bracket marks the opposite: beyond the sell orders just above price, the book is thin up to about $84K, the dark stretch on the heatmap. A move higher would meet little resistance from the book itself, although it would still have to get through the short-term holders waiting to break even. Note that resting orders can be pulled at any time, and some of these bids were pulled during the sell-off before they were placed again.
Large Wallets Step In
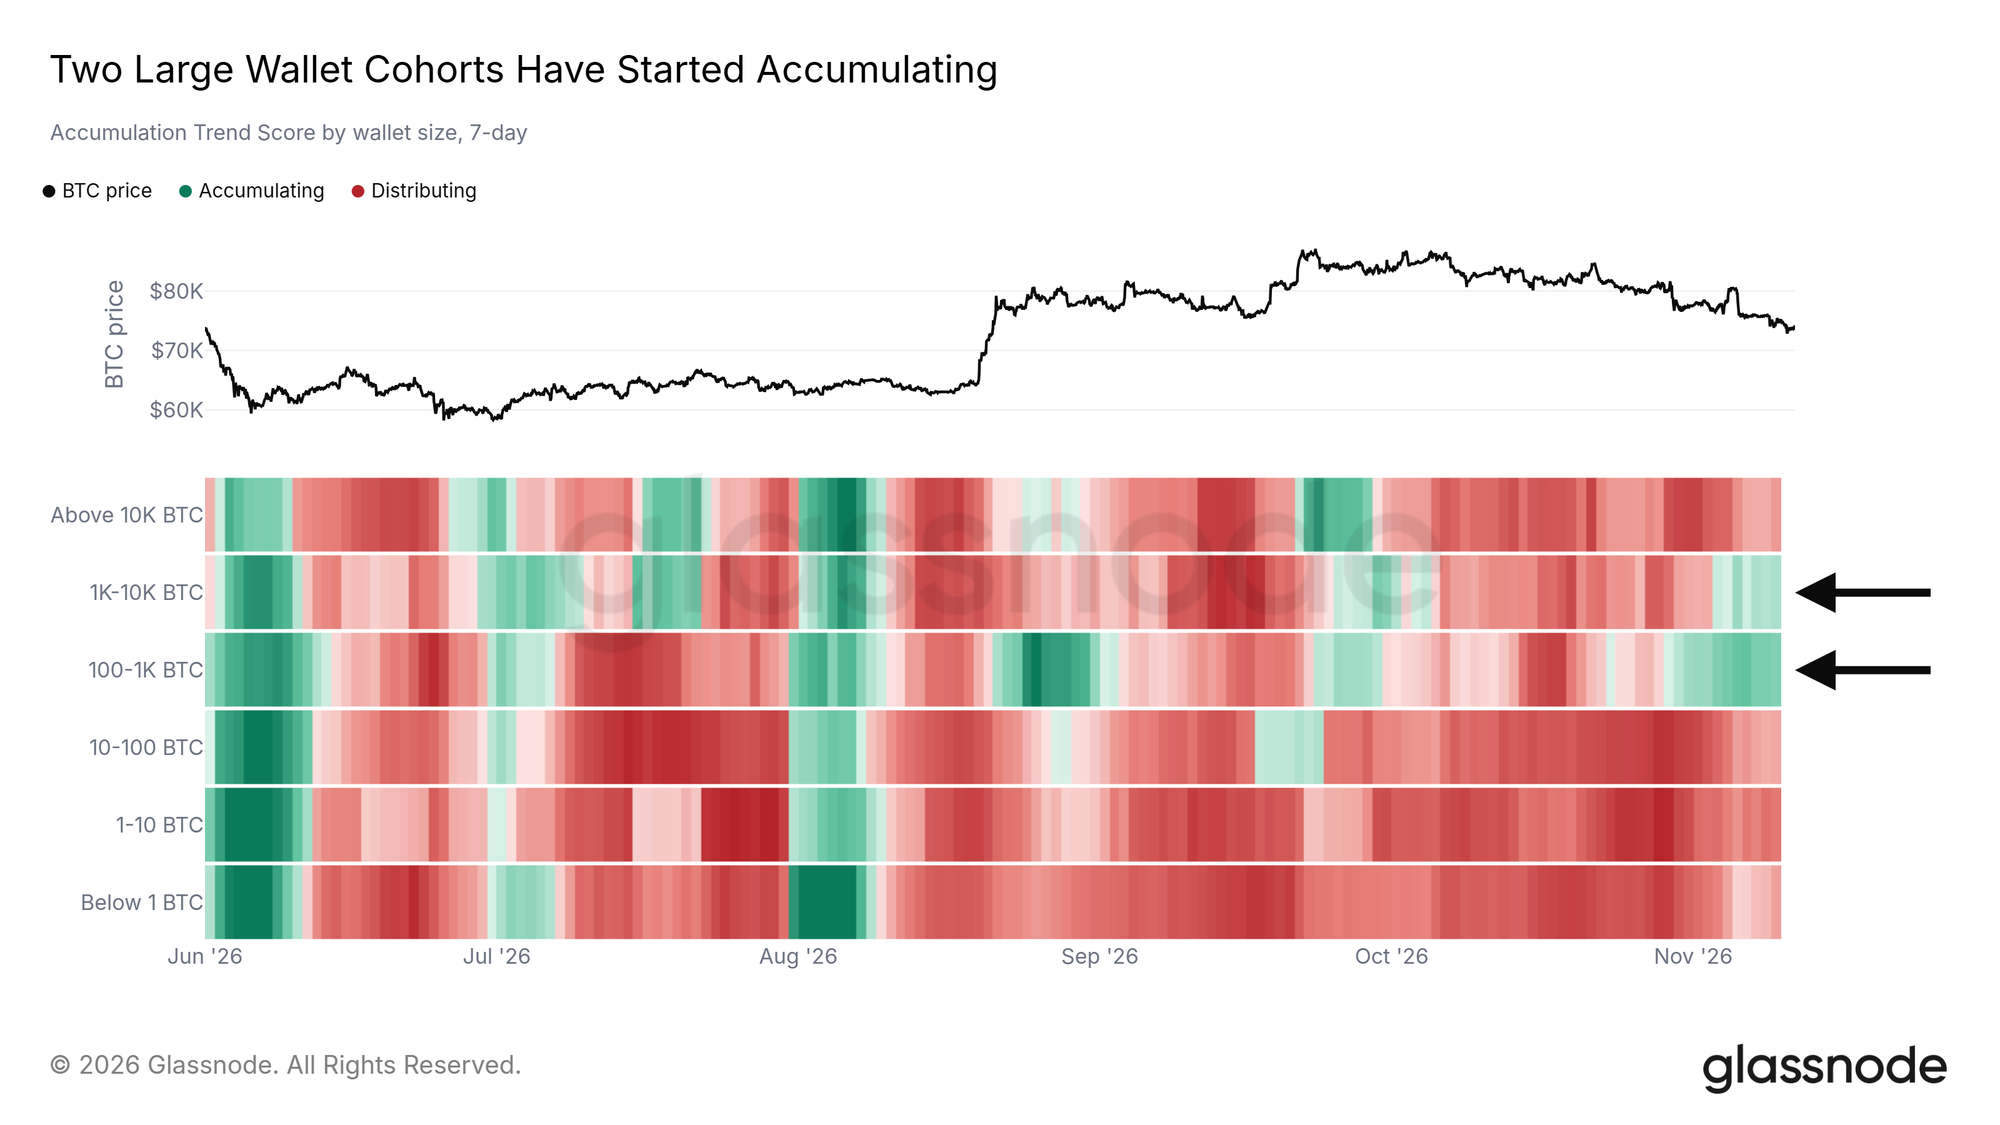
The Accumulation Trend Score tracks whether each wallet cohort is adding to its balance (a score near 1) or reducing it (near 0), weighted by the size of the wallets. Over the past week, two cohorts score above 0.5: wallets holding 100 to 1K BTC and those holding 1K to 10K BTC. Both had spent much of October distributing. Note that both cohorts also turned to buying in late September, and it did not last.
Every other cohort is still reducing its holdings, from the largest wallets above 10K BTC down to those holding less than 1 BTC. This is early dip buying from a narrow group. Should the smaller cohorts join, it would show buyers returning across the market.
Conclusion
Bitcoin is correcting with little new capital behind it: recent buyers sit at a loss, it trails stocks, and stablecoins, the ETFs and US buyers all show money leaving. Near-term reasons for optimism are few. Against that, leverage near price has been cleared and two large wallet cohorts are buying.
For investors who read August as the start of a higher-timeframe reversal, this is the zone where a mean reversion would begin. A reclaim of the Short-Term Holder Cost Basis at $75.6K would support that view. A sustained break below $73K, the floor of last week's band, would point to a longer consolidation, and a close below the June low at $58.5K would undo the August trend change.
Data as of November 11, 2026, 11:00 UTC for price and derivatives, 09:00 UTC for the order book; ETF flows, stablecoin supply, cost basis and accumulation scores through November 9.
Disclaimer: This report does not provide any investment advice. All data is provided for informational and educational purposes only. No investment decision shall be based on the information provided here, and you are solely responsible for your own investment decisions.
Exchange balances presented are derived from Glassnode’s comprehensive database of address labels, which are amassed through both officially published exchange information and proprietary clustering algorithms. While we strive to ensure the utmost accuracy in representing exchange balances, it is important to note that these figures might not always encapsulate the entirety of an exchange’s reserves, particularly when exchanges refrain from disclosing their official addresses. We urge users to exercise caution and discretion when utilizing these metrics. Glassnode shall not be held responsible for any discrepancies or potential inaccuracies.
