Escape Velocity
Bitcoin has moved above the cost bases that held it back this year, and the question now is how far it can go. Profit taking is light, ETF buying is picking up, and the next major resistance sits at the mean MVRV price near $96.7K.


Executive Summary
- Bitcoin never closed below the Realized Price in this bear market. The share of coins in profit fell as far as in 2022, but NUPL stayed positive.
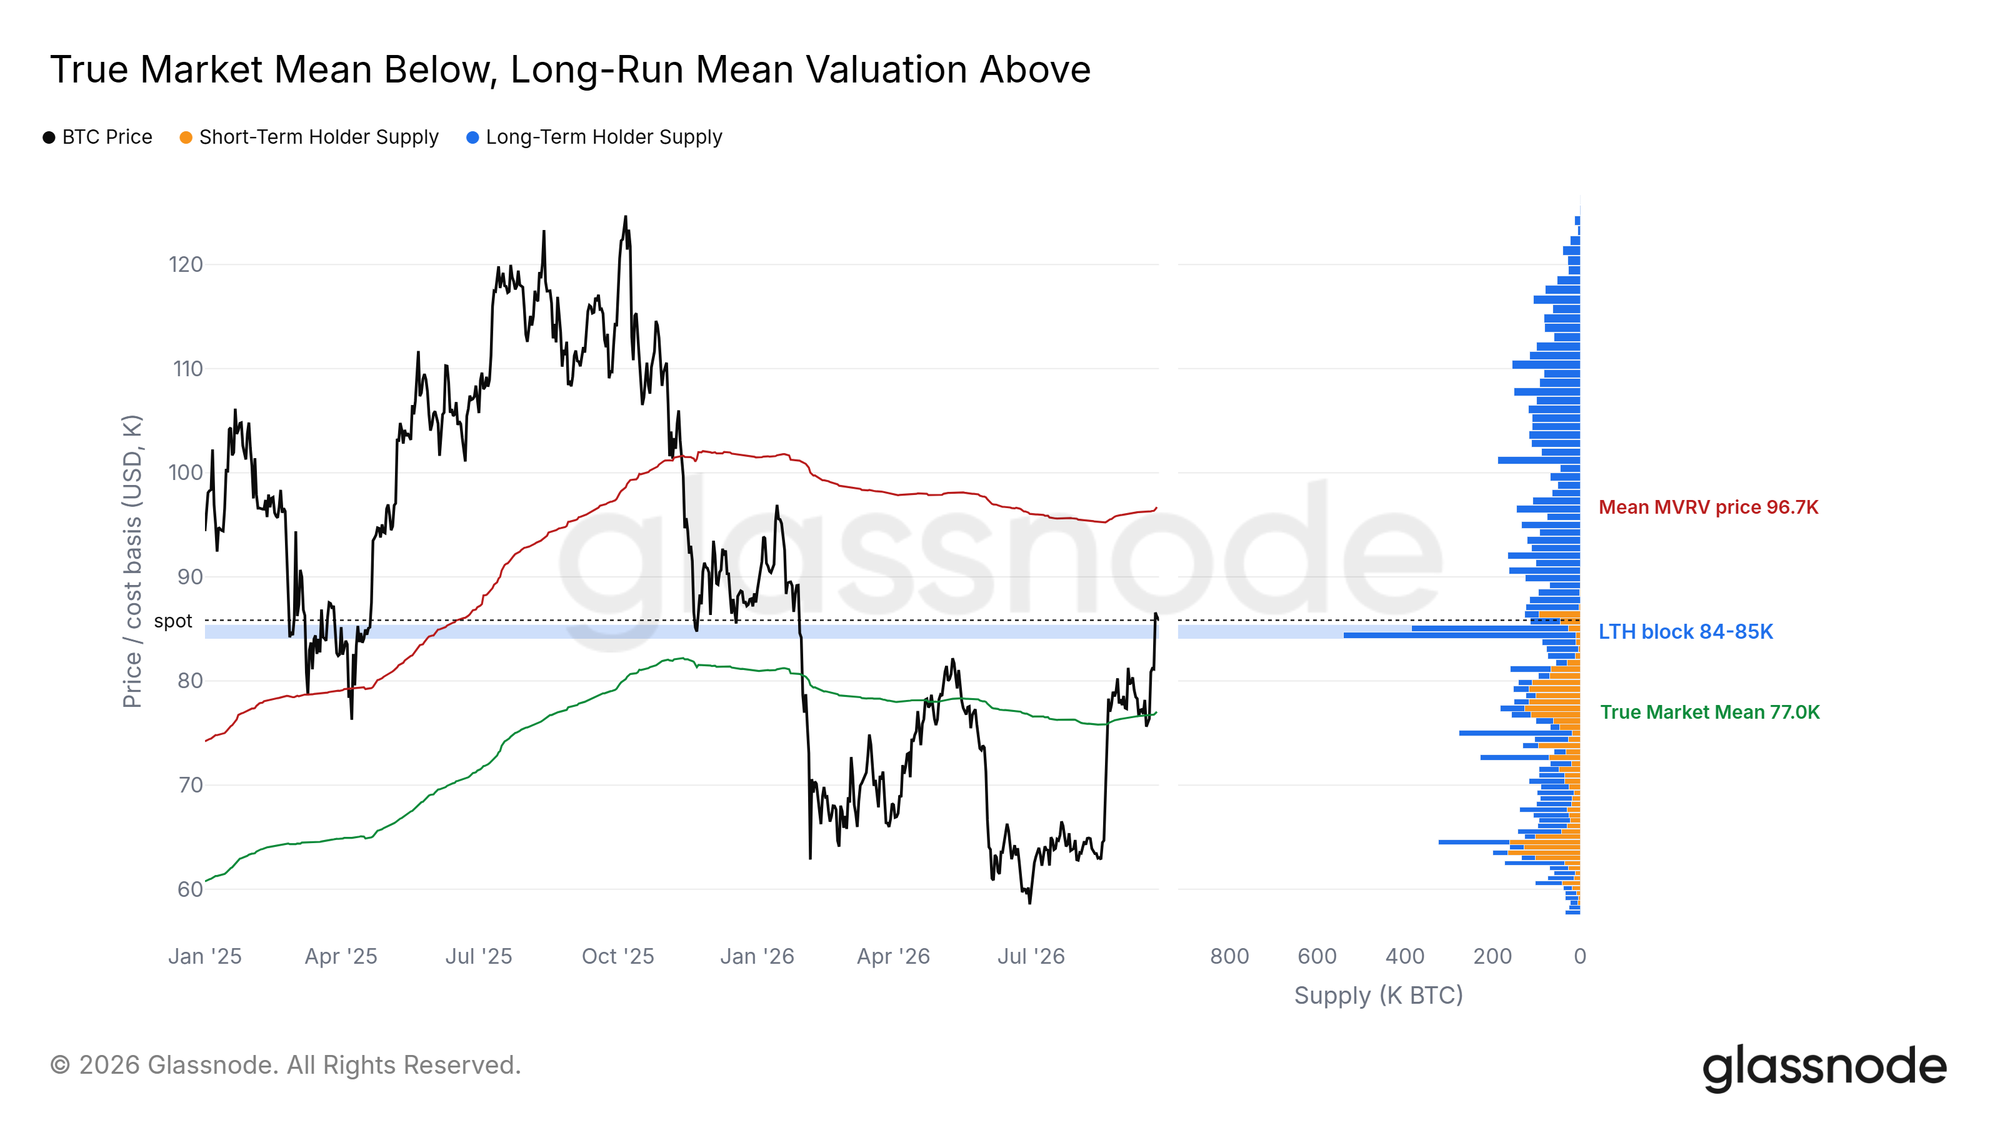
- Price sits just above a large block of long-term holder supply at $84K-$85K. The next major on-chain resistance is the mean MVRV price at $96.7K.
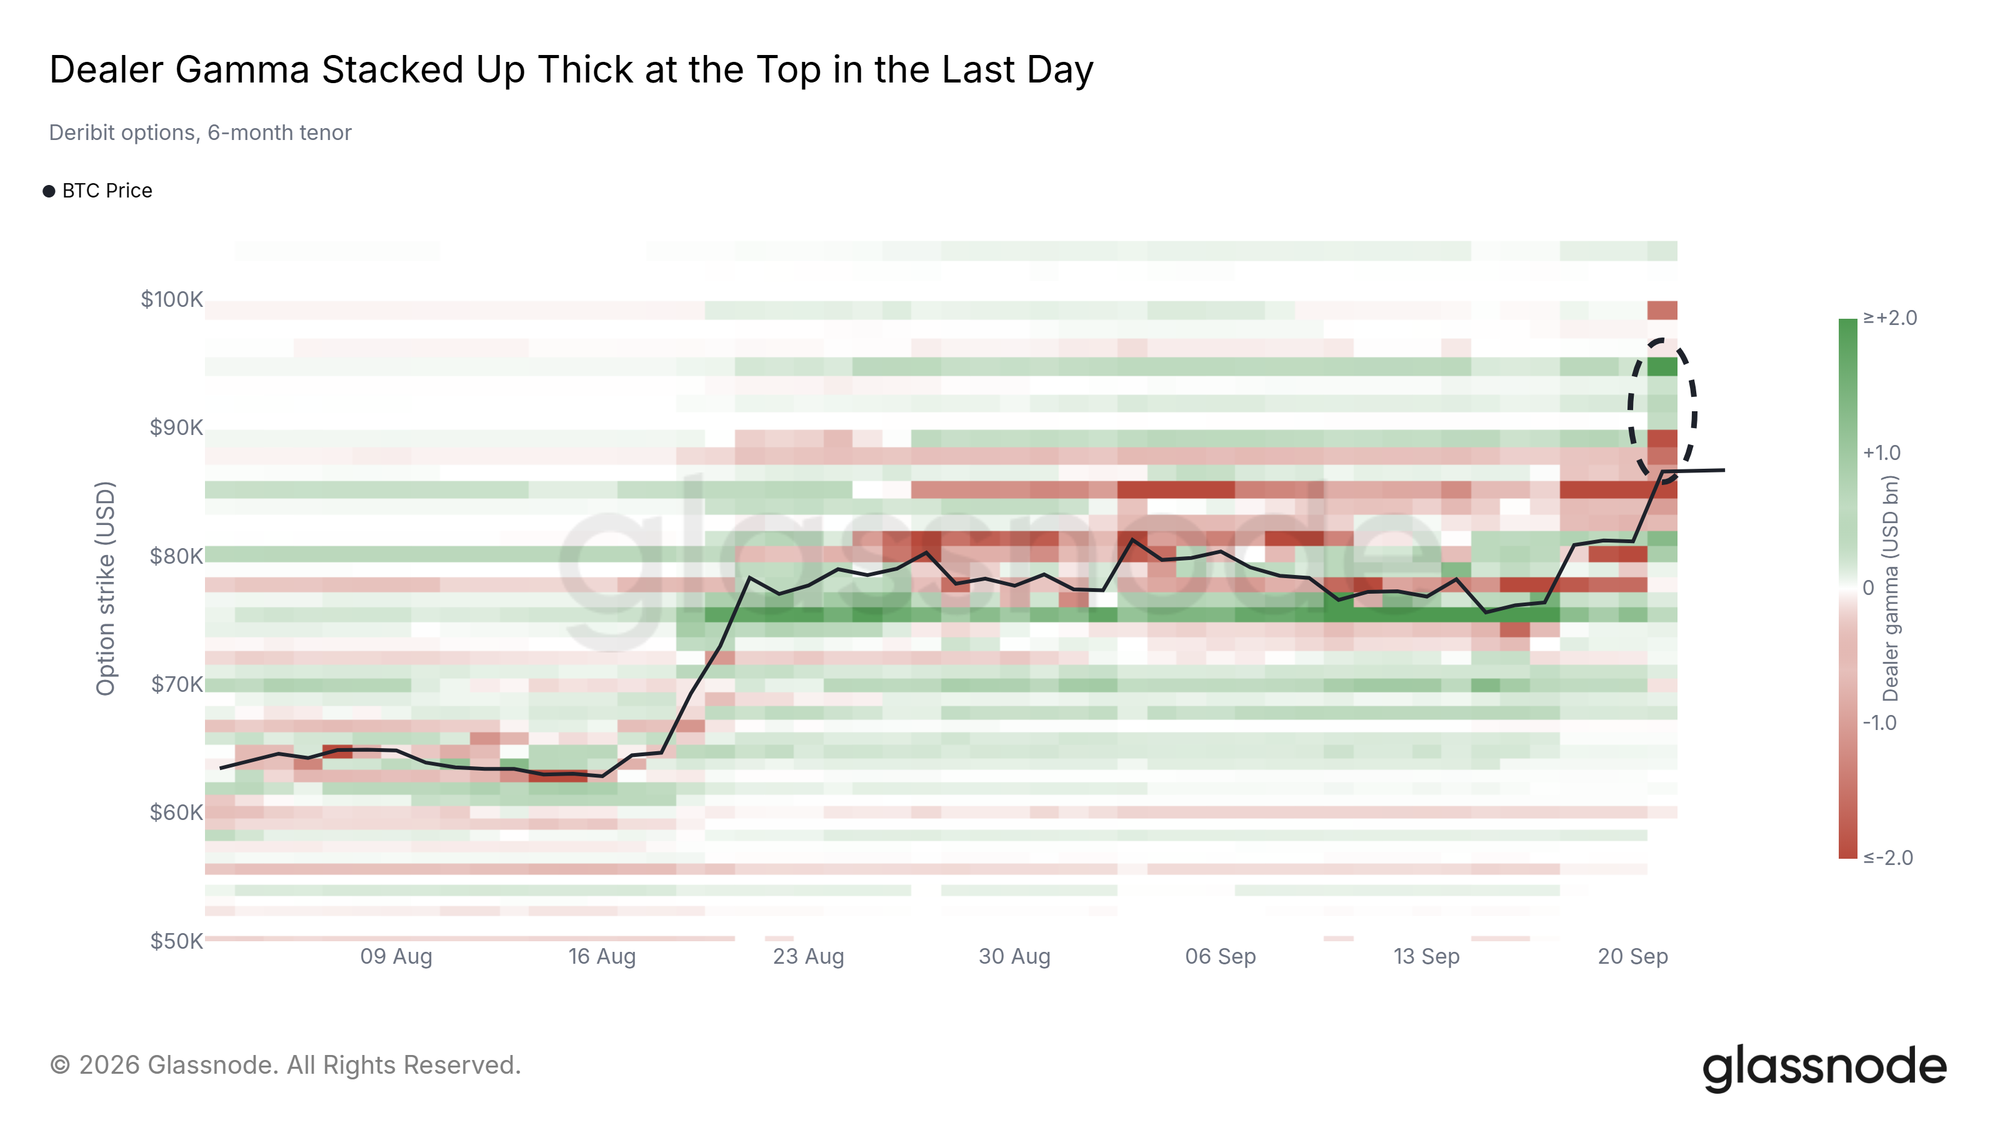
- Options positioning built up in one day: dealer hedging could speed up moves between spot and $92K and slow them near $95K.
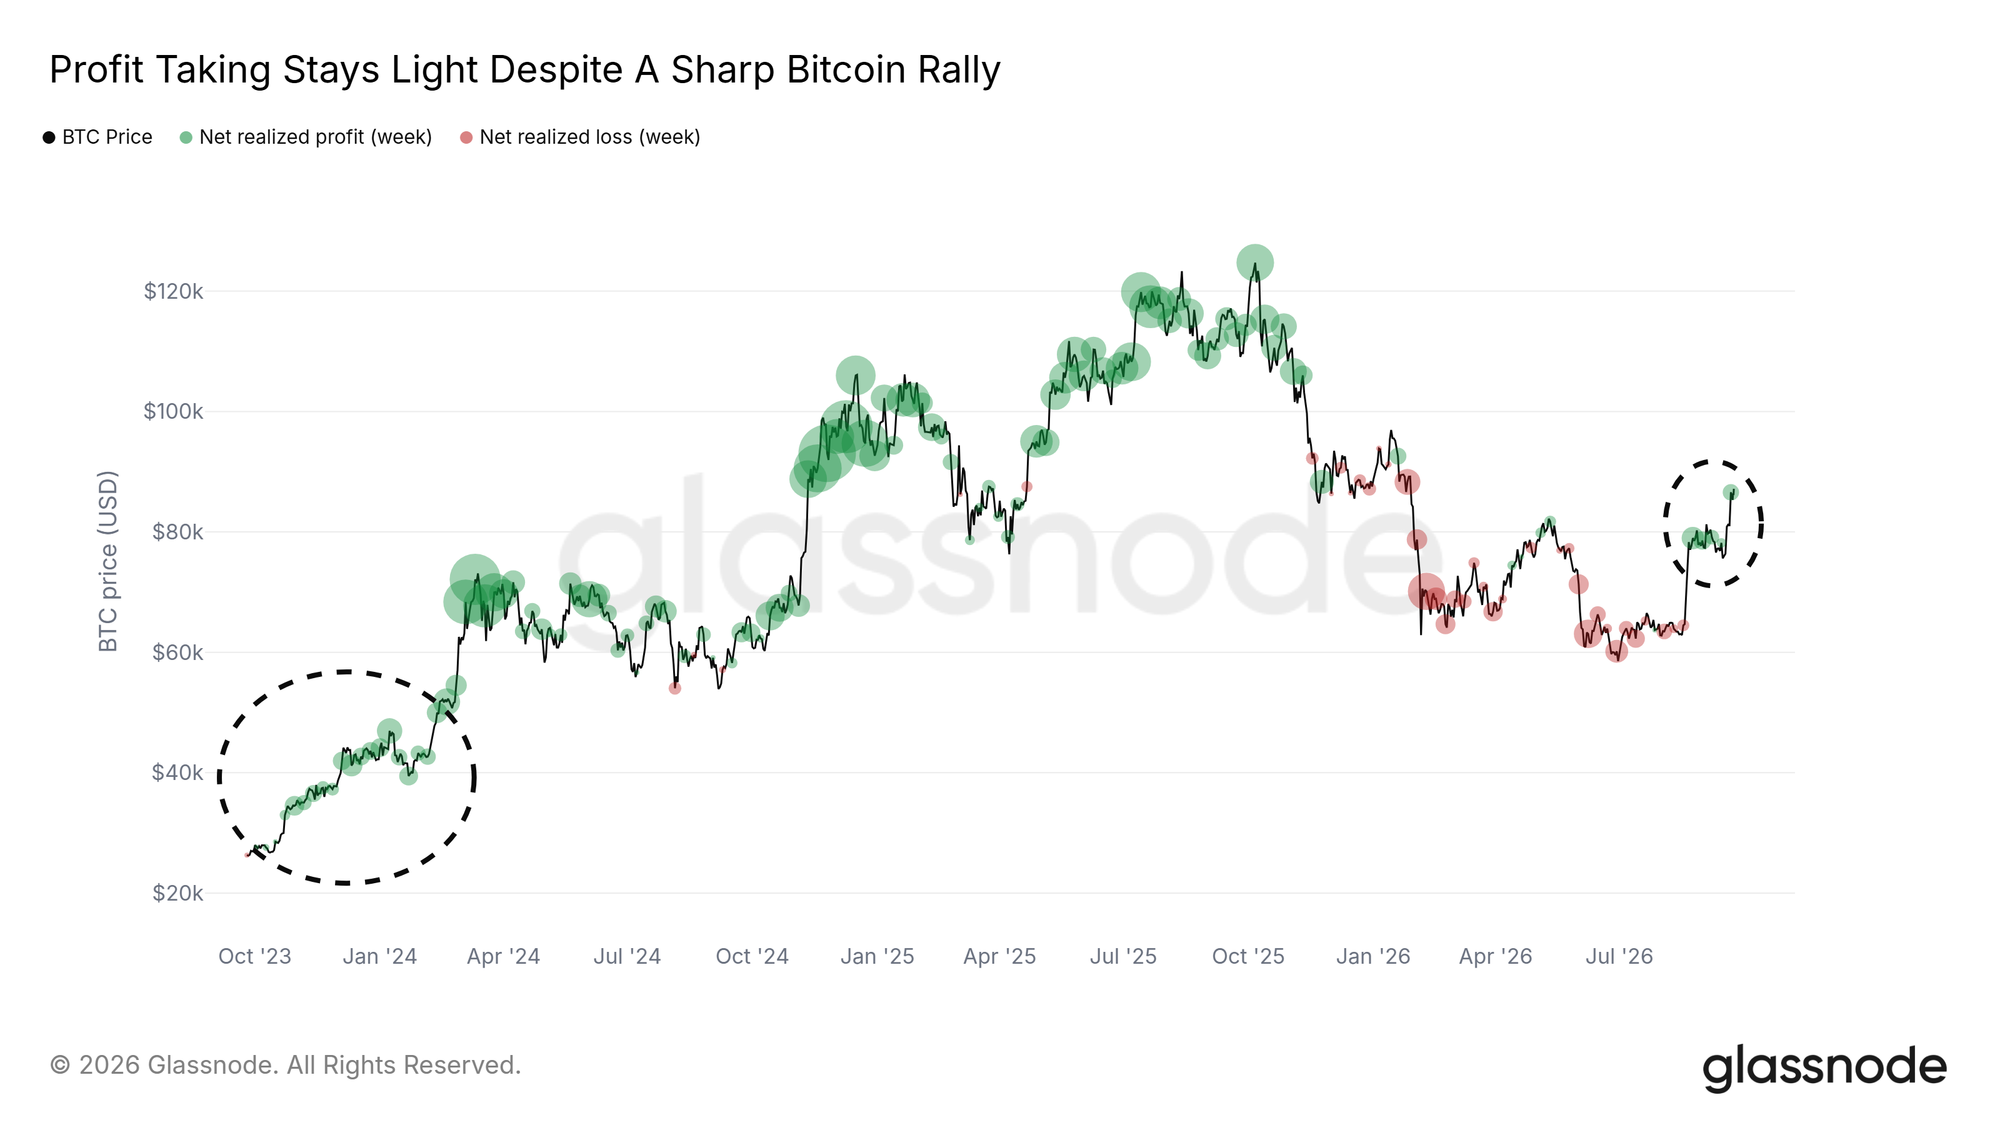
- Profit taking is a fraction of what it was at the 2024-2025 tops, even though almost all short-term holders are in profit.
- ETF buying is picking up, and spot volume has more than doubled from its August low, this time with price rising and spread across many exchanges.
- Altcoins are rising broadly, but traders have added very little leverage.
Ready to get ahead of markets and sharpen your foresight? Try Glassnode. Sign up or talk to sales.
A Shallower Low
Never Below the Realized Price
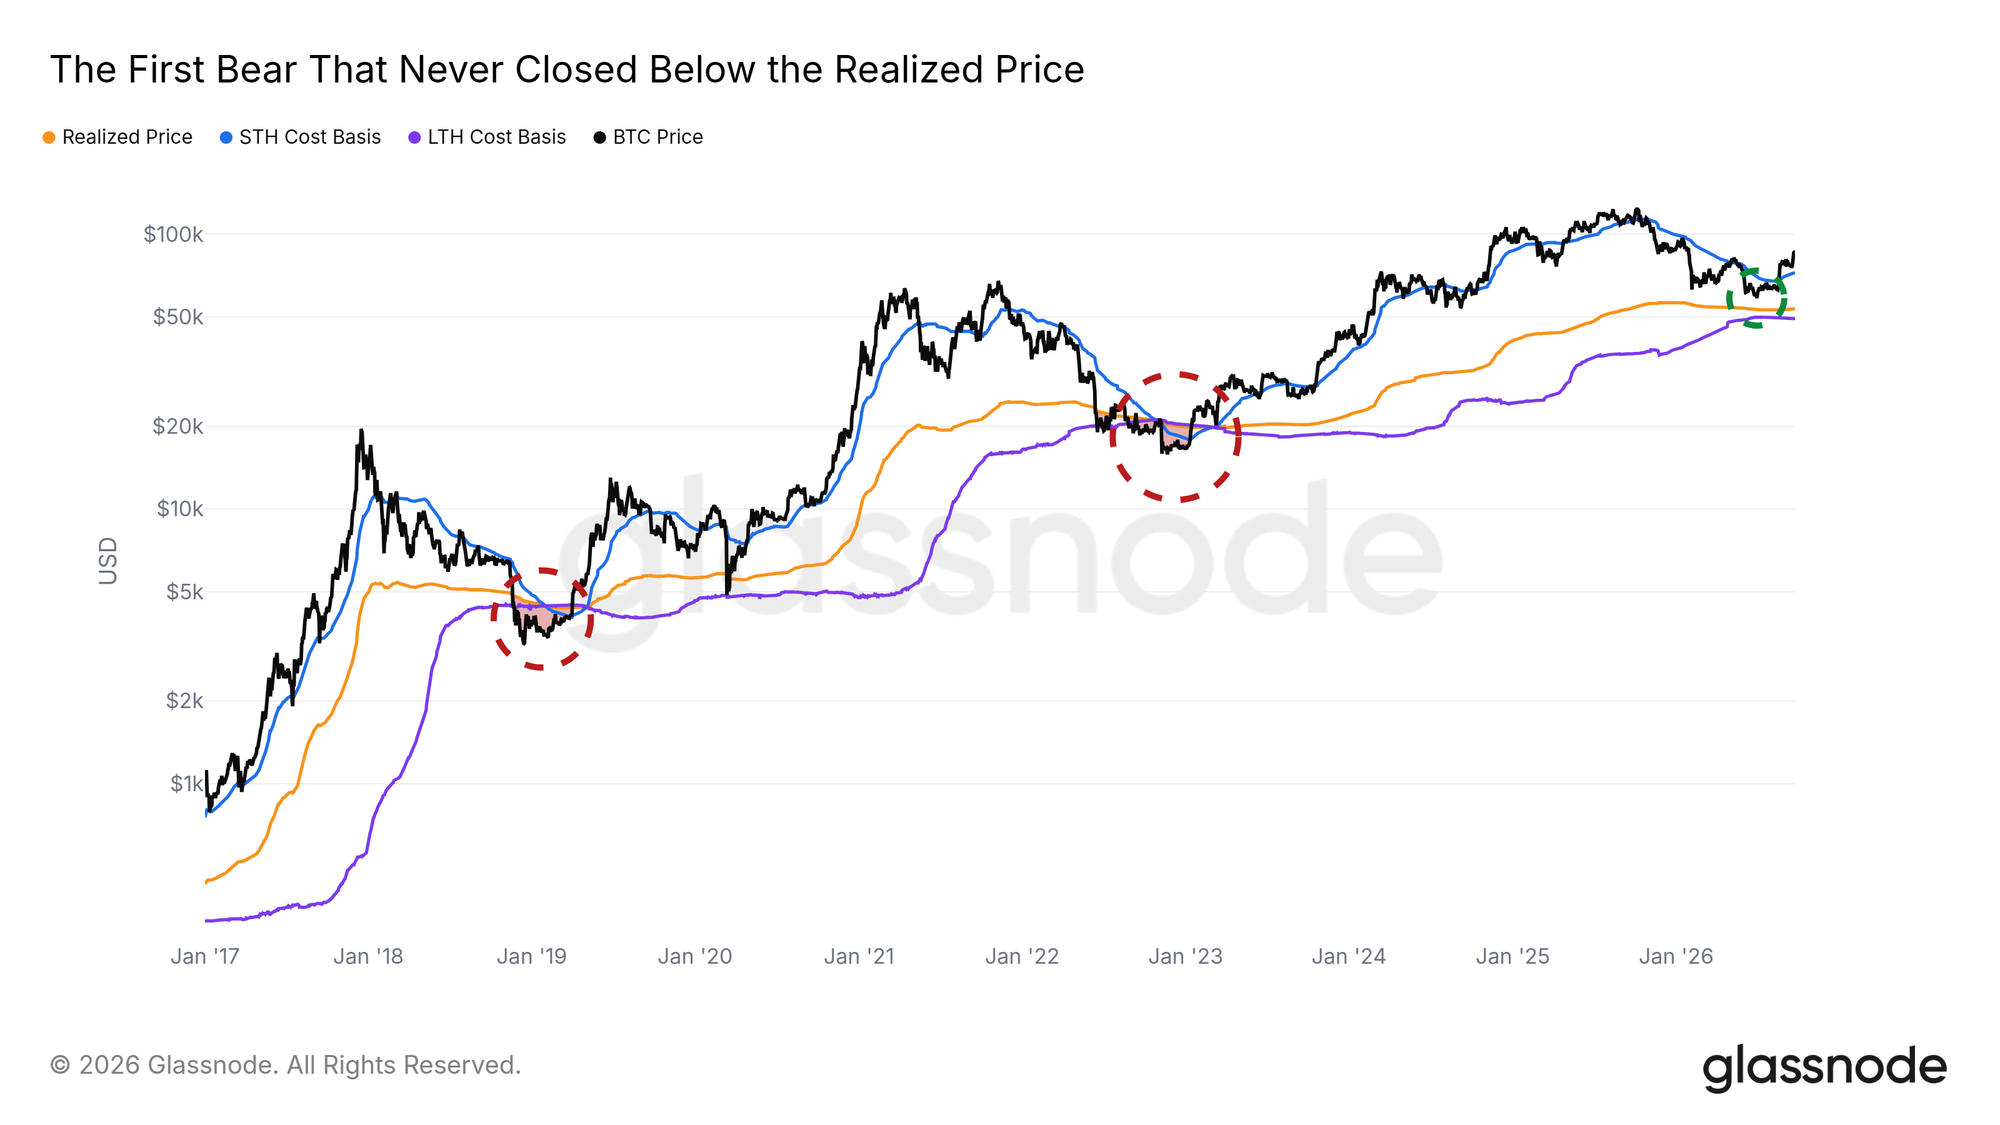
Last week, this report described a break below the True Market Mean. Within days, price moved back above it. Bitcoin now trades above the True Market Mean at $77K and the Short-Term Holder Cost Basis.
The Realized Price is the average price paid for all coins in circulation. In the 2018-2019 and 2022-2023 bear markets, price traded below it for months. This time, price never closed a day below it. The June low stayed above the Realized Price, which none of the bear markets on this chart since 2017 managed.
If price holds above the True Market Mean, the June low will be the shallowest of the three bear-market lows.
Losses Were Wide but Shallow
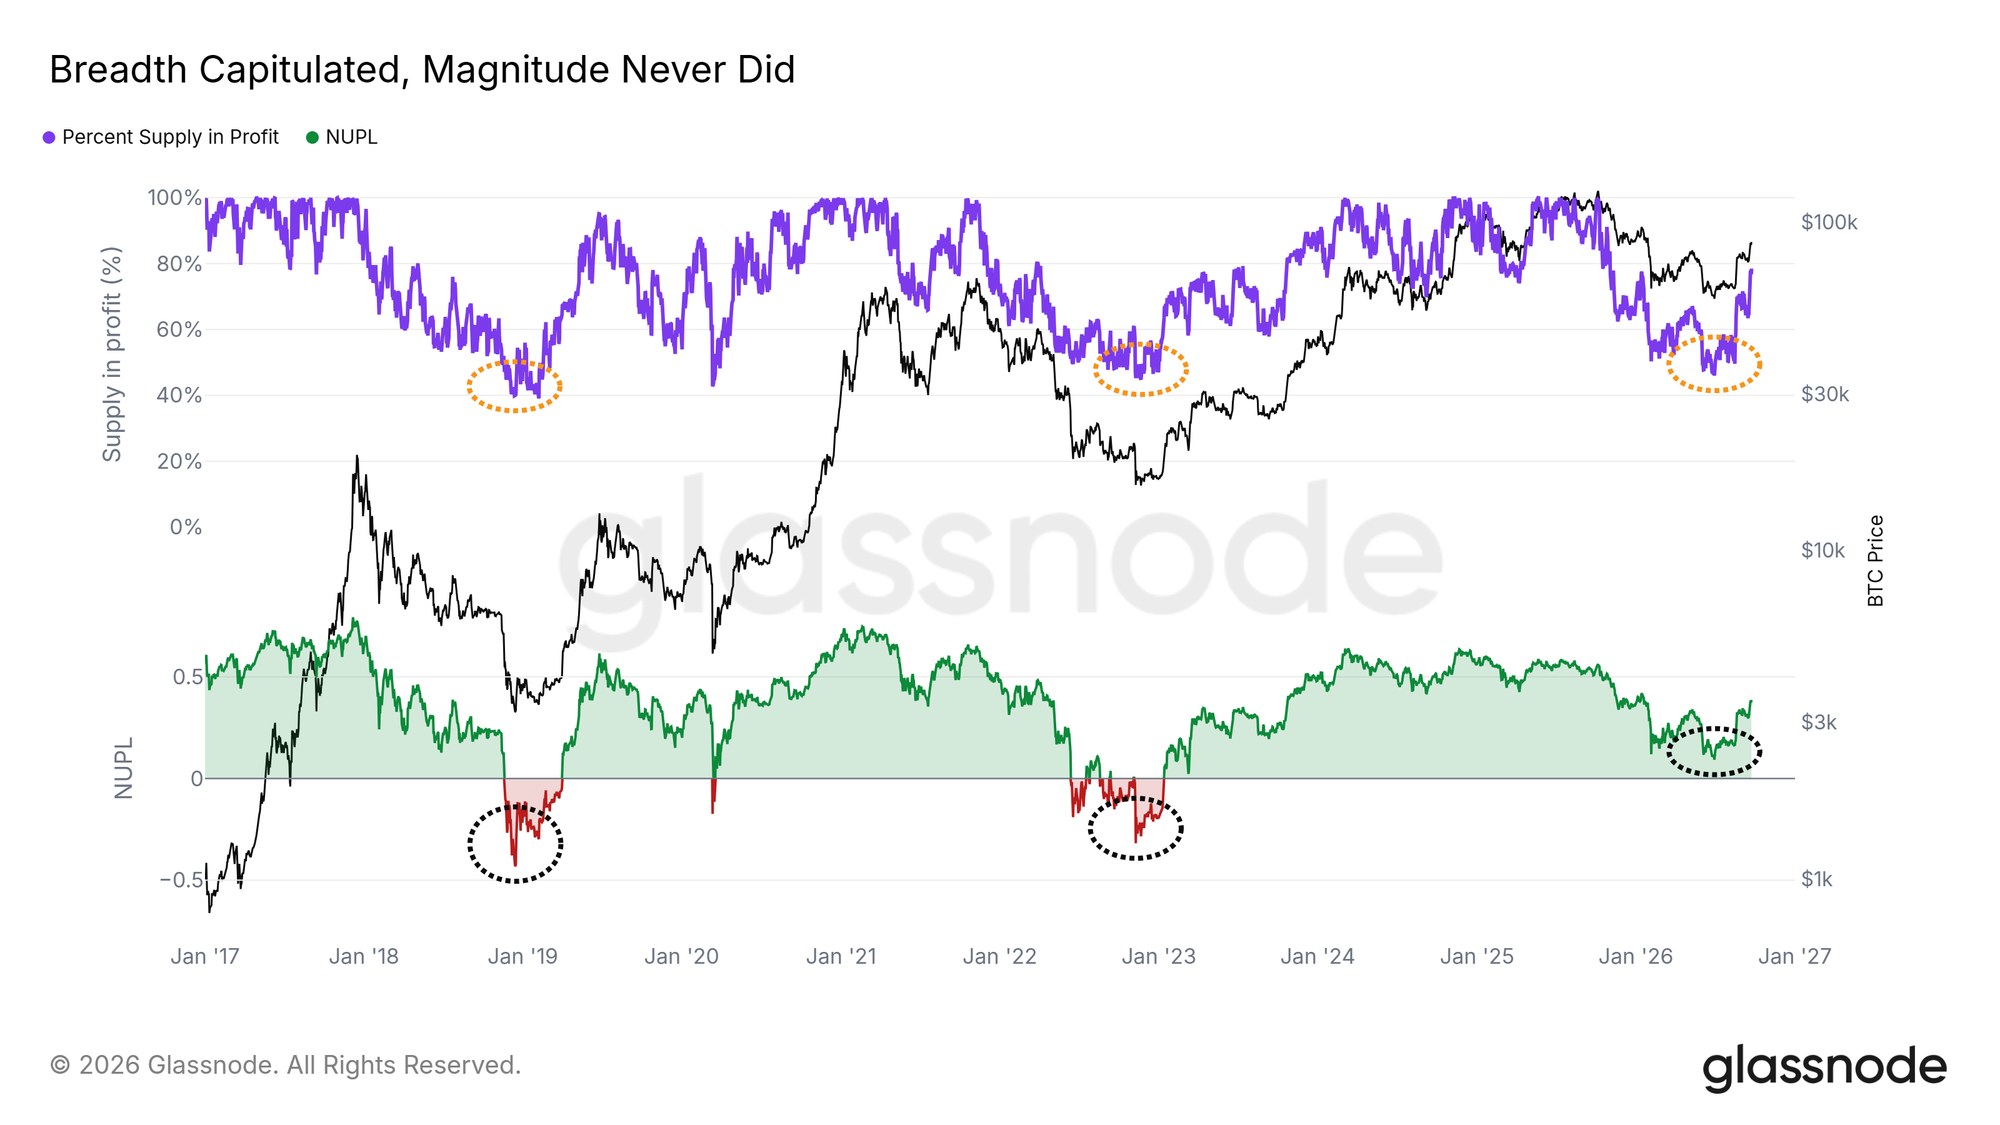
At the June low, Percent Supply in Profit fell to about the same level as at the November 2022 low. About as many coins were held at a loss as in the last bear market.
The losses were much smaller, though. Net Unrealized Profit/Loss (NUPL), which measures the total paper gain or loss across all coins, never turned negative this cycle. In 2018 and 2022 it fell deep into negative territory. Smaller losses usually mean less pressure to sell.
The Next Levels
Support Below, Resistance Above
In August, the debate was whether the rally was only a short squeeze. Now that price is above the cost bases that held it back this year, the question is how far it can go. Last week, this report marked a cluster of long-term holder supply as the ceiling, with a large block of call options just above it. Price now trades above both.
The biggest cluster of long-term holder supply sits at $84K-$85K, just below price. The next major resistance is the mean MVRV price at $96.7K. It is the Realized Price multiplied by Bitcoin's long-term average MVRV, and it marks where the average holder's profit is back to its long-term norm. Buyers from one to two years ago, near the top of the range, also break even close to that level.
On the downside, the True Market Mean at $77K is the main support. If price holds above $84K, the way to $96.7K stays open. A drop back below $84K would bring $77K back into view.
Options Positioning Builds at the Top
Options data points to the same area. In one day, dealer positioning in Deribit options built up near the top of the range. Positive gamma around the $95K strikes jumped to its highest reading on the chart, and negative gamma built up between spot and $92K.
Gamma describes how dealers hedge their options. Between spot and $92K, their hedging means buying as price rises and selling as it falls, which can speed up moves. Near $95K the effect reverses, and hedging tends to slow price down. That level sits just below the $96.7K mean MVRV price, so $95K-$97K is the first major test if the rally continues.
Selling Stays Light
Profit Taking Stays Small
Sharp rallies usually bring heavy profit taking. This one has not, so far. Weekly Net Realized Profit/Loss during the current run is a fraction of what it was at the tops of 2024 and 2025.
The current pace looks like the start of the last uptrend. From late 2023 to early 2024, profit taking ran at about the same pace, well before the larger waves of selling. If profit taking stays at this level, the rally has room to continue. A rise toward the weekly amounts seen at the 2024 and 2025 tops would show that holders are selling into strength.
Recent Buyers Back in Profit
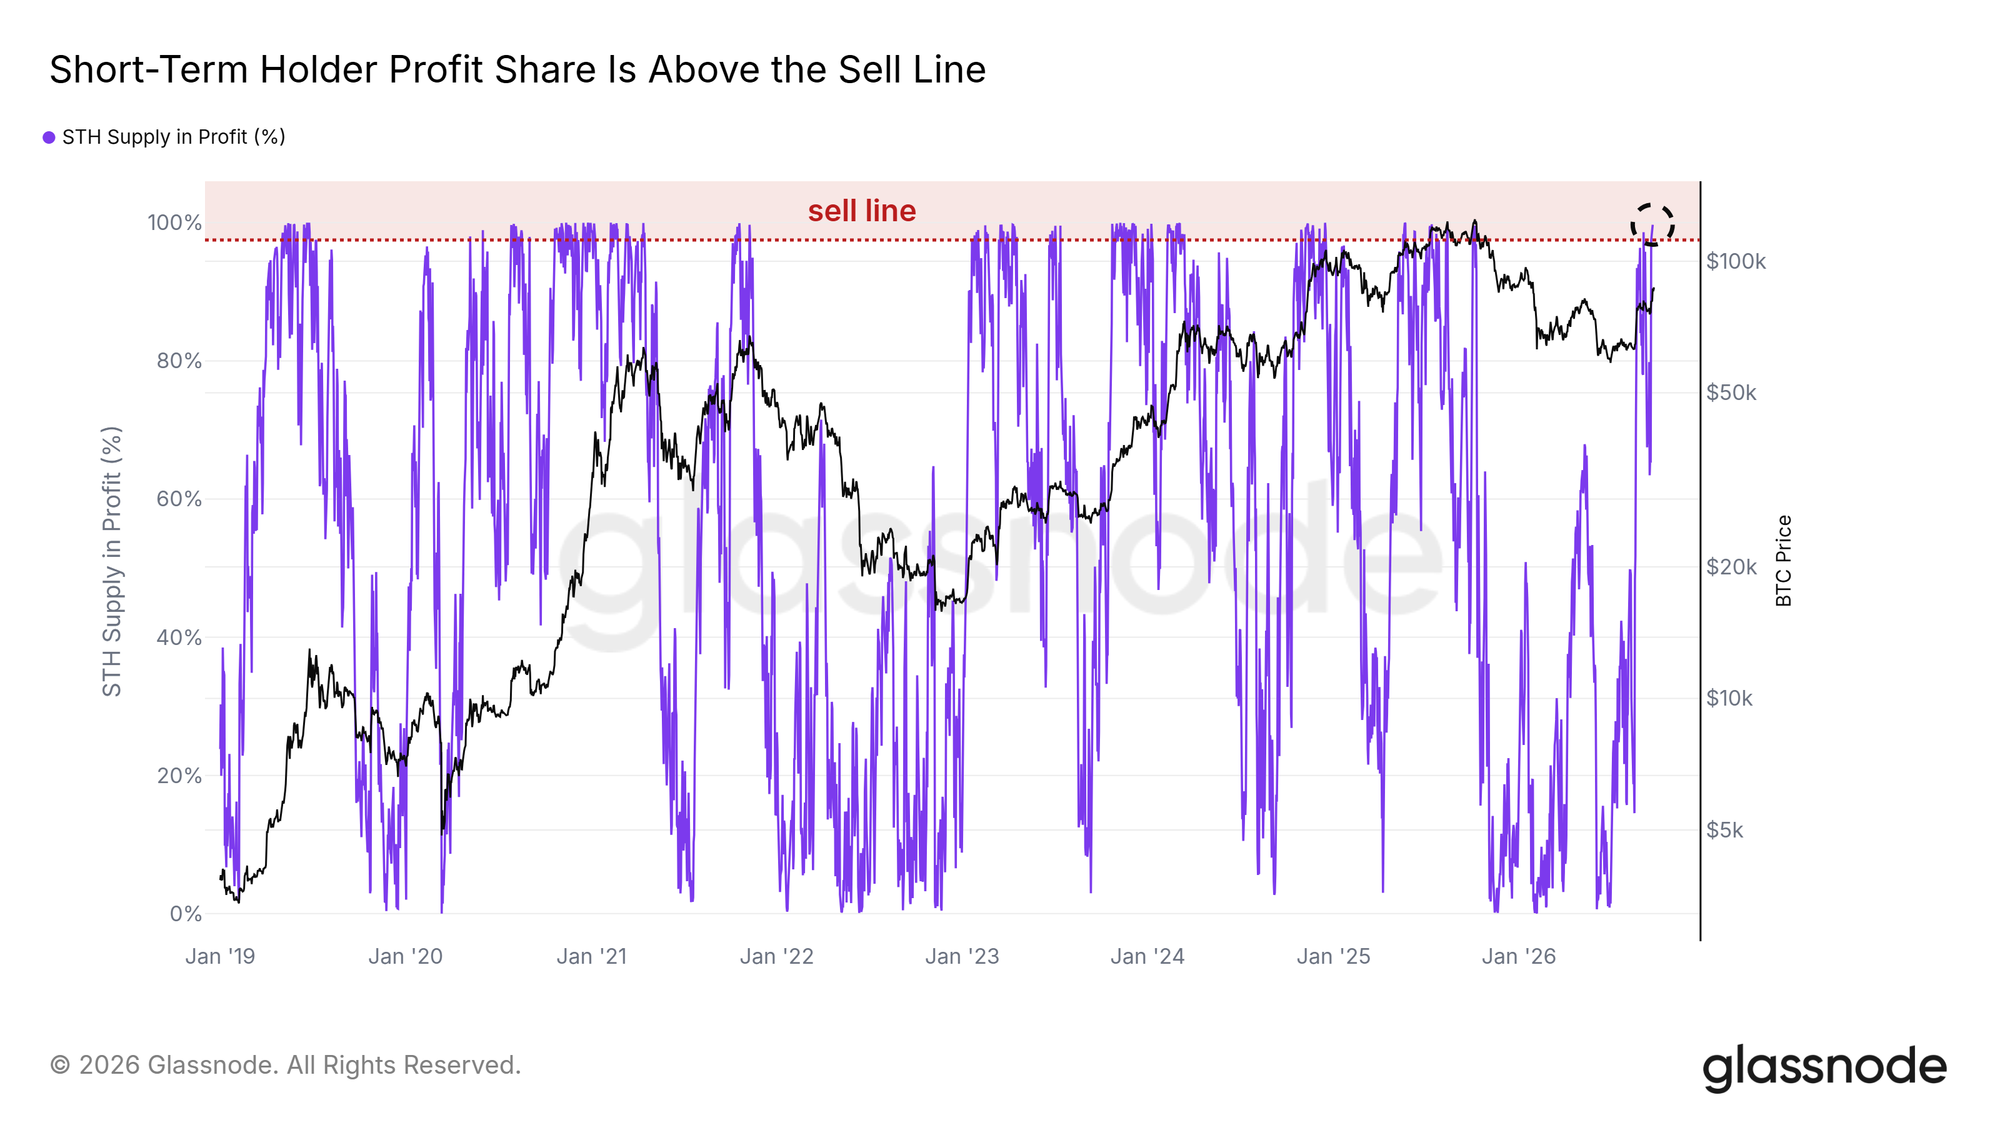
Short-term holders are the most likely to sell into a rally, and almost all of them are now in profit. Their share of supply in profit is above the sell line, where their selling has picked up in the past. The line has been crossed early in recoveries, such as 2019 and 2023, and near tops, such as 2021 and 2025. On its own, it does not show which way price goes next.
Realized profit across all holders is still low, so the incentive to sell has not yet turned into heavy selling. A drop back below the sell line, together with rising realized profit, would be the first sign that recent buyers are taking profits.
The ETFs Step Back In
Inflows Pick Up
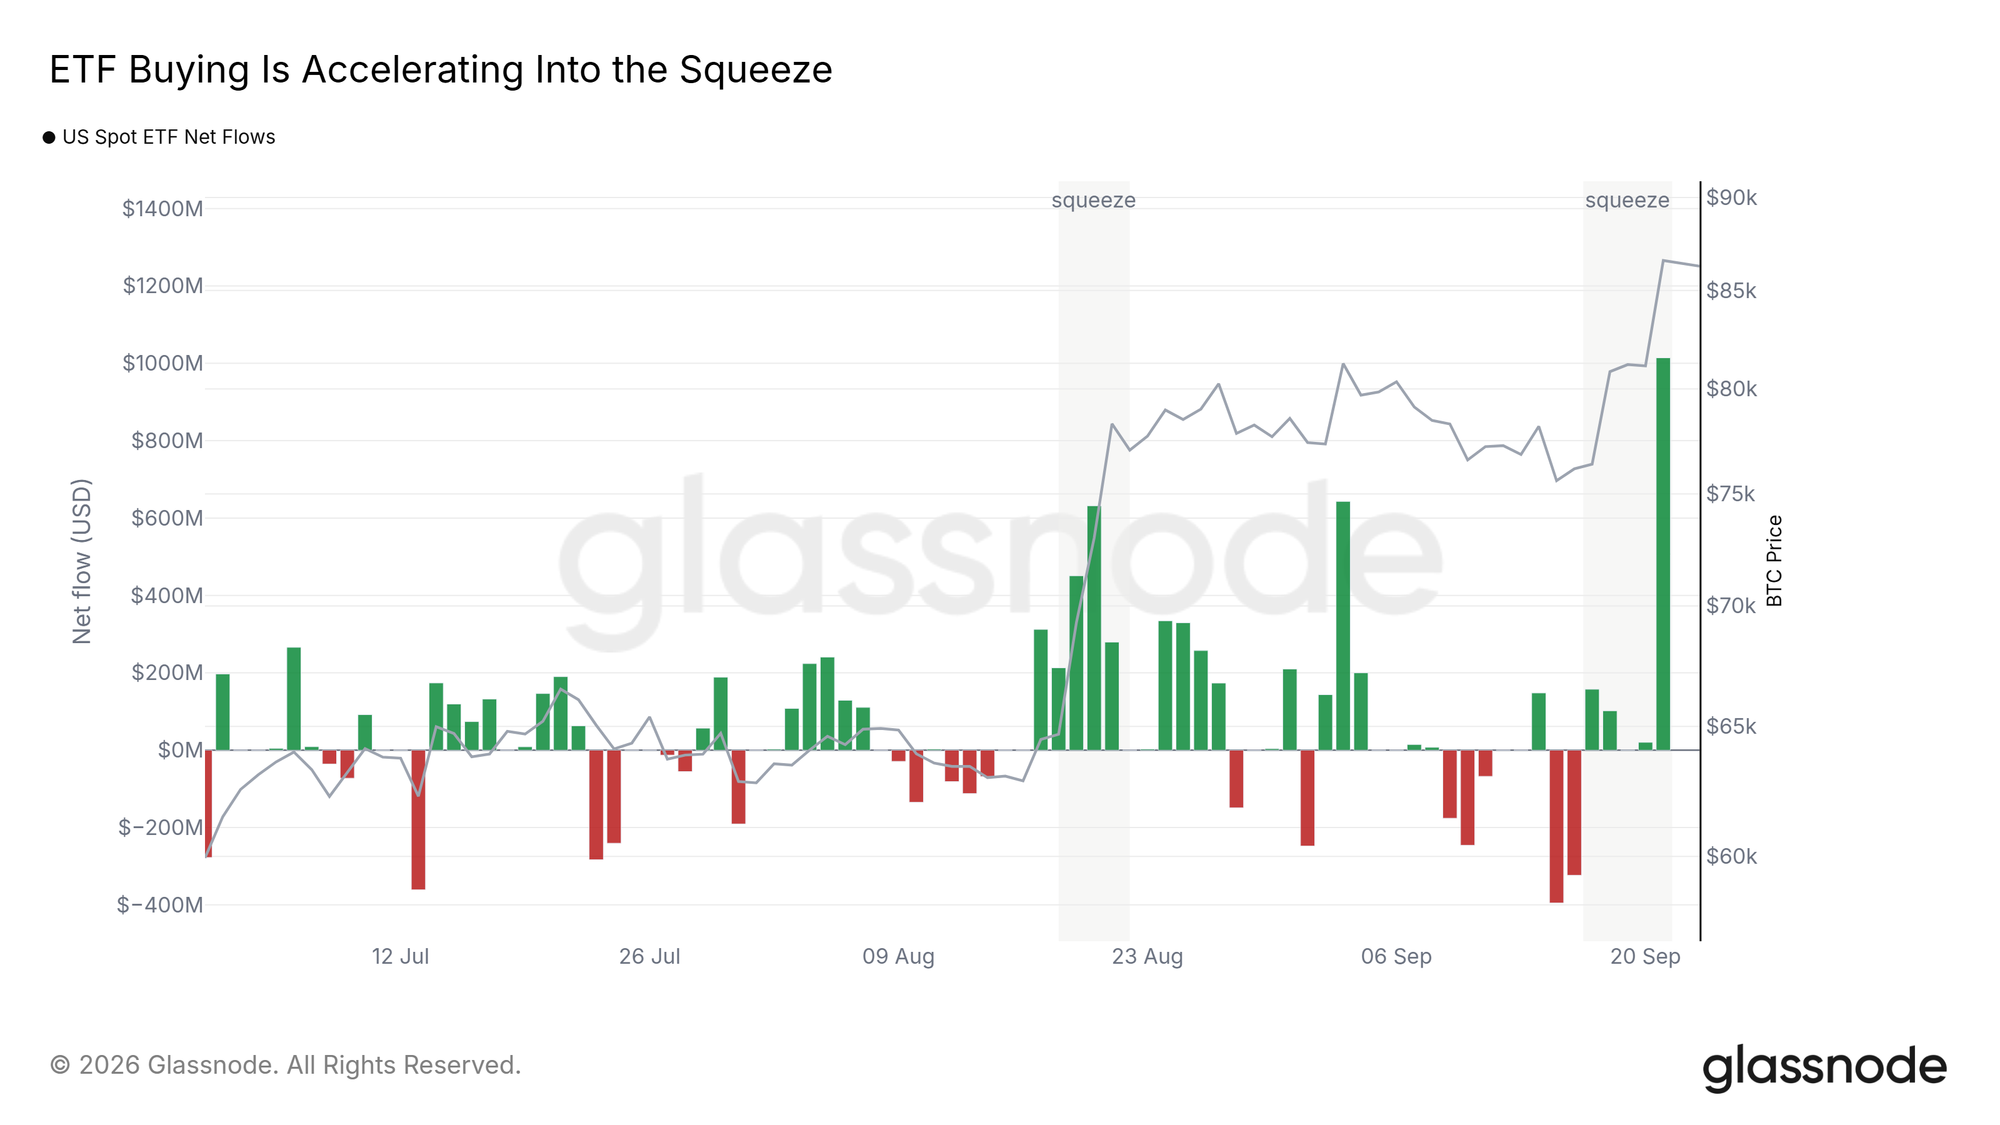
US spot ETFs took in about $1.3B in the five days since the current squeeze began, after two weeks of net outflows. The latest day was the largest single inflow since the start of July.
The funds are buying more as price rises. If inflows stay near this pace, ETF demand will keep supporting the move.
Volume Returns With the Bid
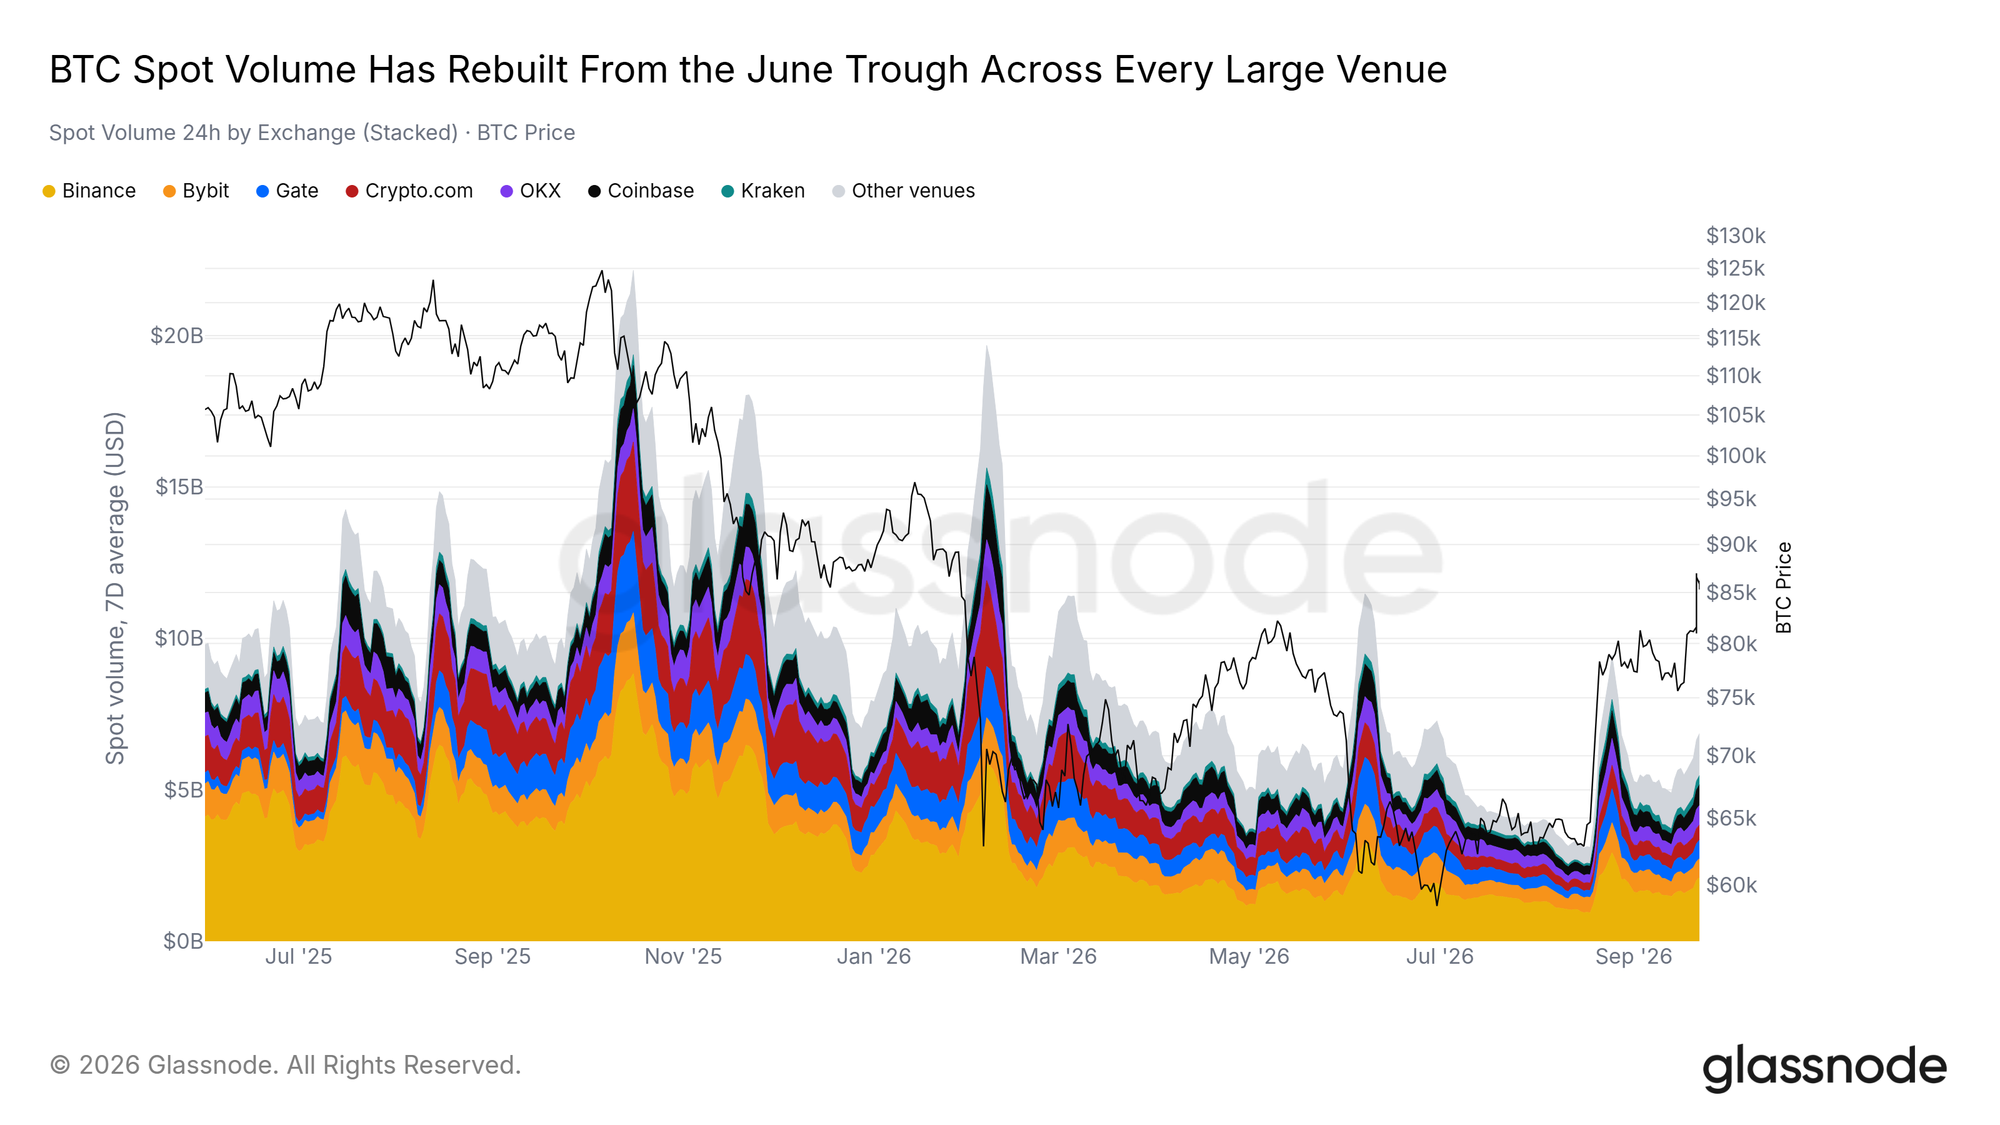
24h Spot Volume across exchanges has more than doubled off its August trough, up 121% since the rally began.
Even more important than the size of the spike is the circumstance it arrived in. From late 2025 through the middle of this year, every expansion in spot turnover came on a leg down: four consecutive volume spikes, each one printed while price was falling. Volume spikes constituted capitulatory selling. August broke that sequence, and was the first expansion in a year to coincide with price rising instead.
Measured against its own recent history the recovery is still incomplete. The seven-day average sits around 30% below where it stood a year ago, which makes this volume coming off the floor rather than a return to 2025 conditions. A sustained hold above the pre-rally range would confirm a durable bid rather than a multi-week squeeze.
The Order Keeps Changing
Beneath the top spot the order has turned over. Gate has gained 4 places over the two years, the largest move on the board, and now ranks third by BTC spot volume. Poloniex has gained 3 places and Bybit 1, while four venues have lost ground over the same stretch.
Gate's climb is not one good month. It has held a top-three place in 9 of the last 24 months, and its share of covered spot volume has gone from 2.0% two years ago to 9.1% today, a gain of 7.1 points and the largest of any venue.
First place has been the exception. Binance has ranked first in each of those 24 months and still clears roughly 31% of covered spot volume. Below it the rotation is broad rather than one challenger rising, and by share it is broader still: 9 venues have taken share over the two years and 3 have given it up, spread down the table rather than clustered at the top. That is real competition between venues, and it means the returning flow is arriving across many order books at once rather than through a single venue, which is a broader and healthier base for the market than concentration would be.
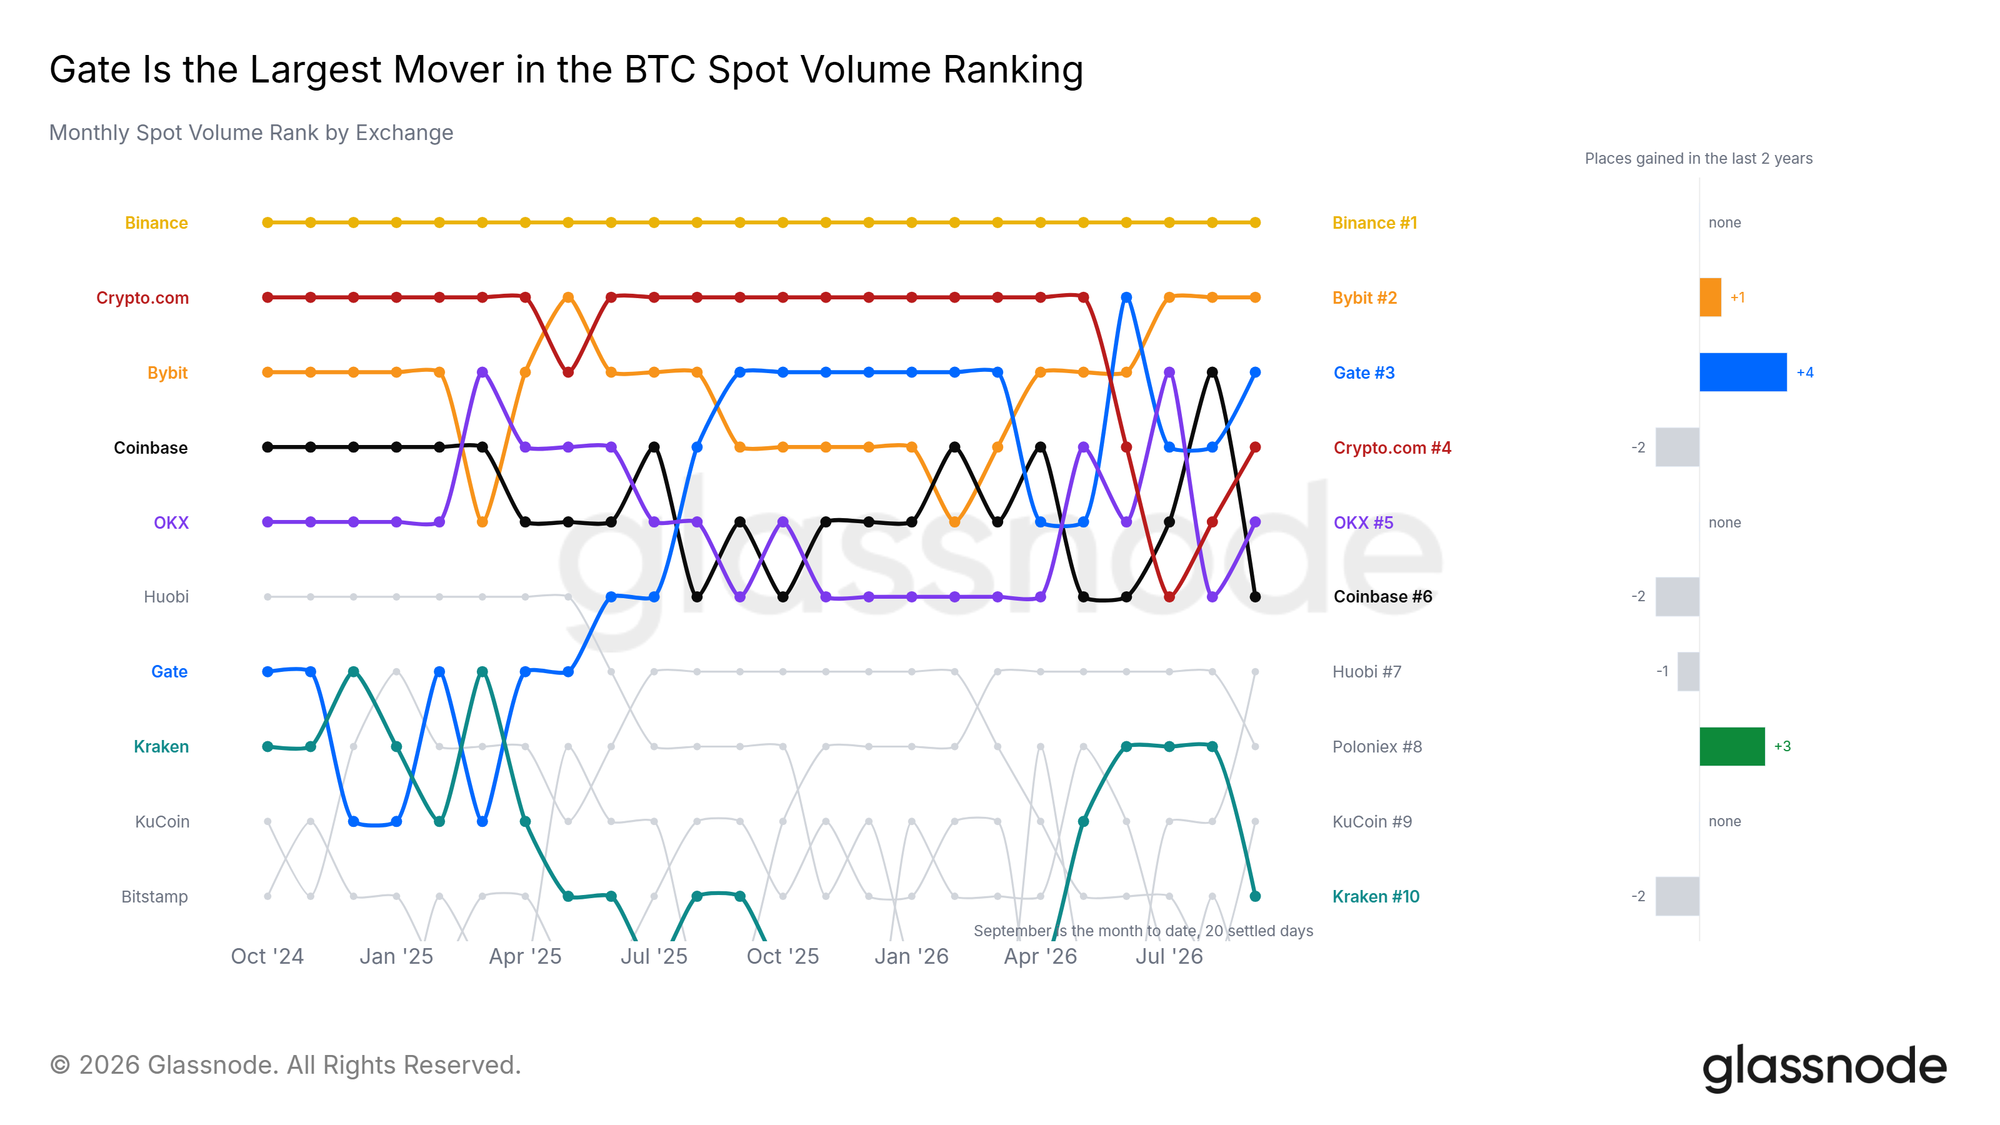
Data through 2026-09-22 12:00 UTC. Spot volume is a strict-settled daily series with a settled hourly tail; venue coverage is Glassnode's covered exchange set.
Altcoins Rise Without Leverage
Little New Leverage
Altcoins have joined the rally. Over the past week, 72.5% of the tracked altcoins did better than Bitcoin. During the August squeeze, the highest share was 39%.
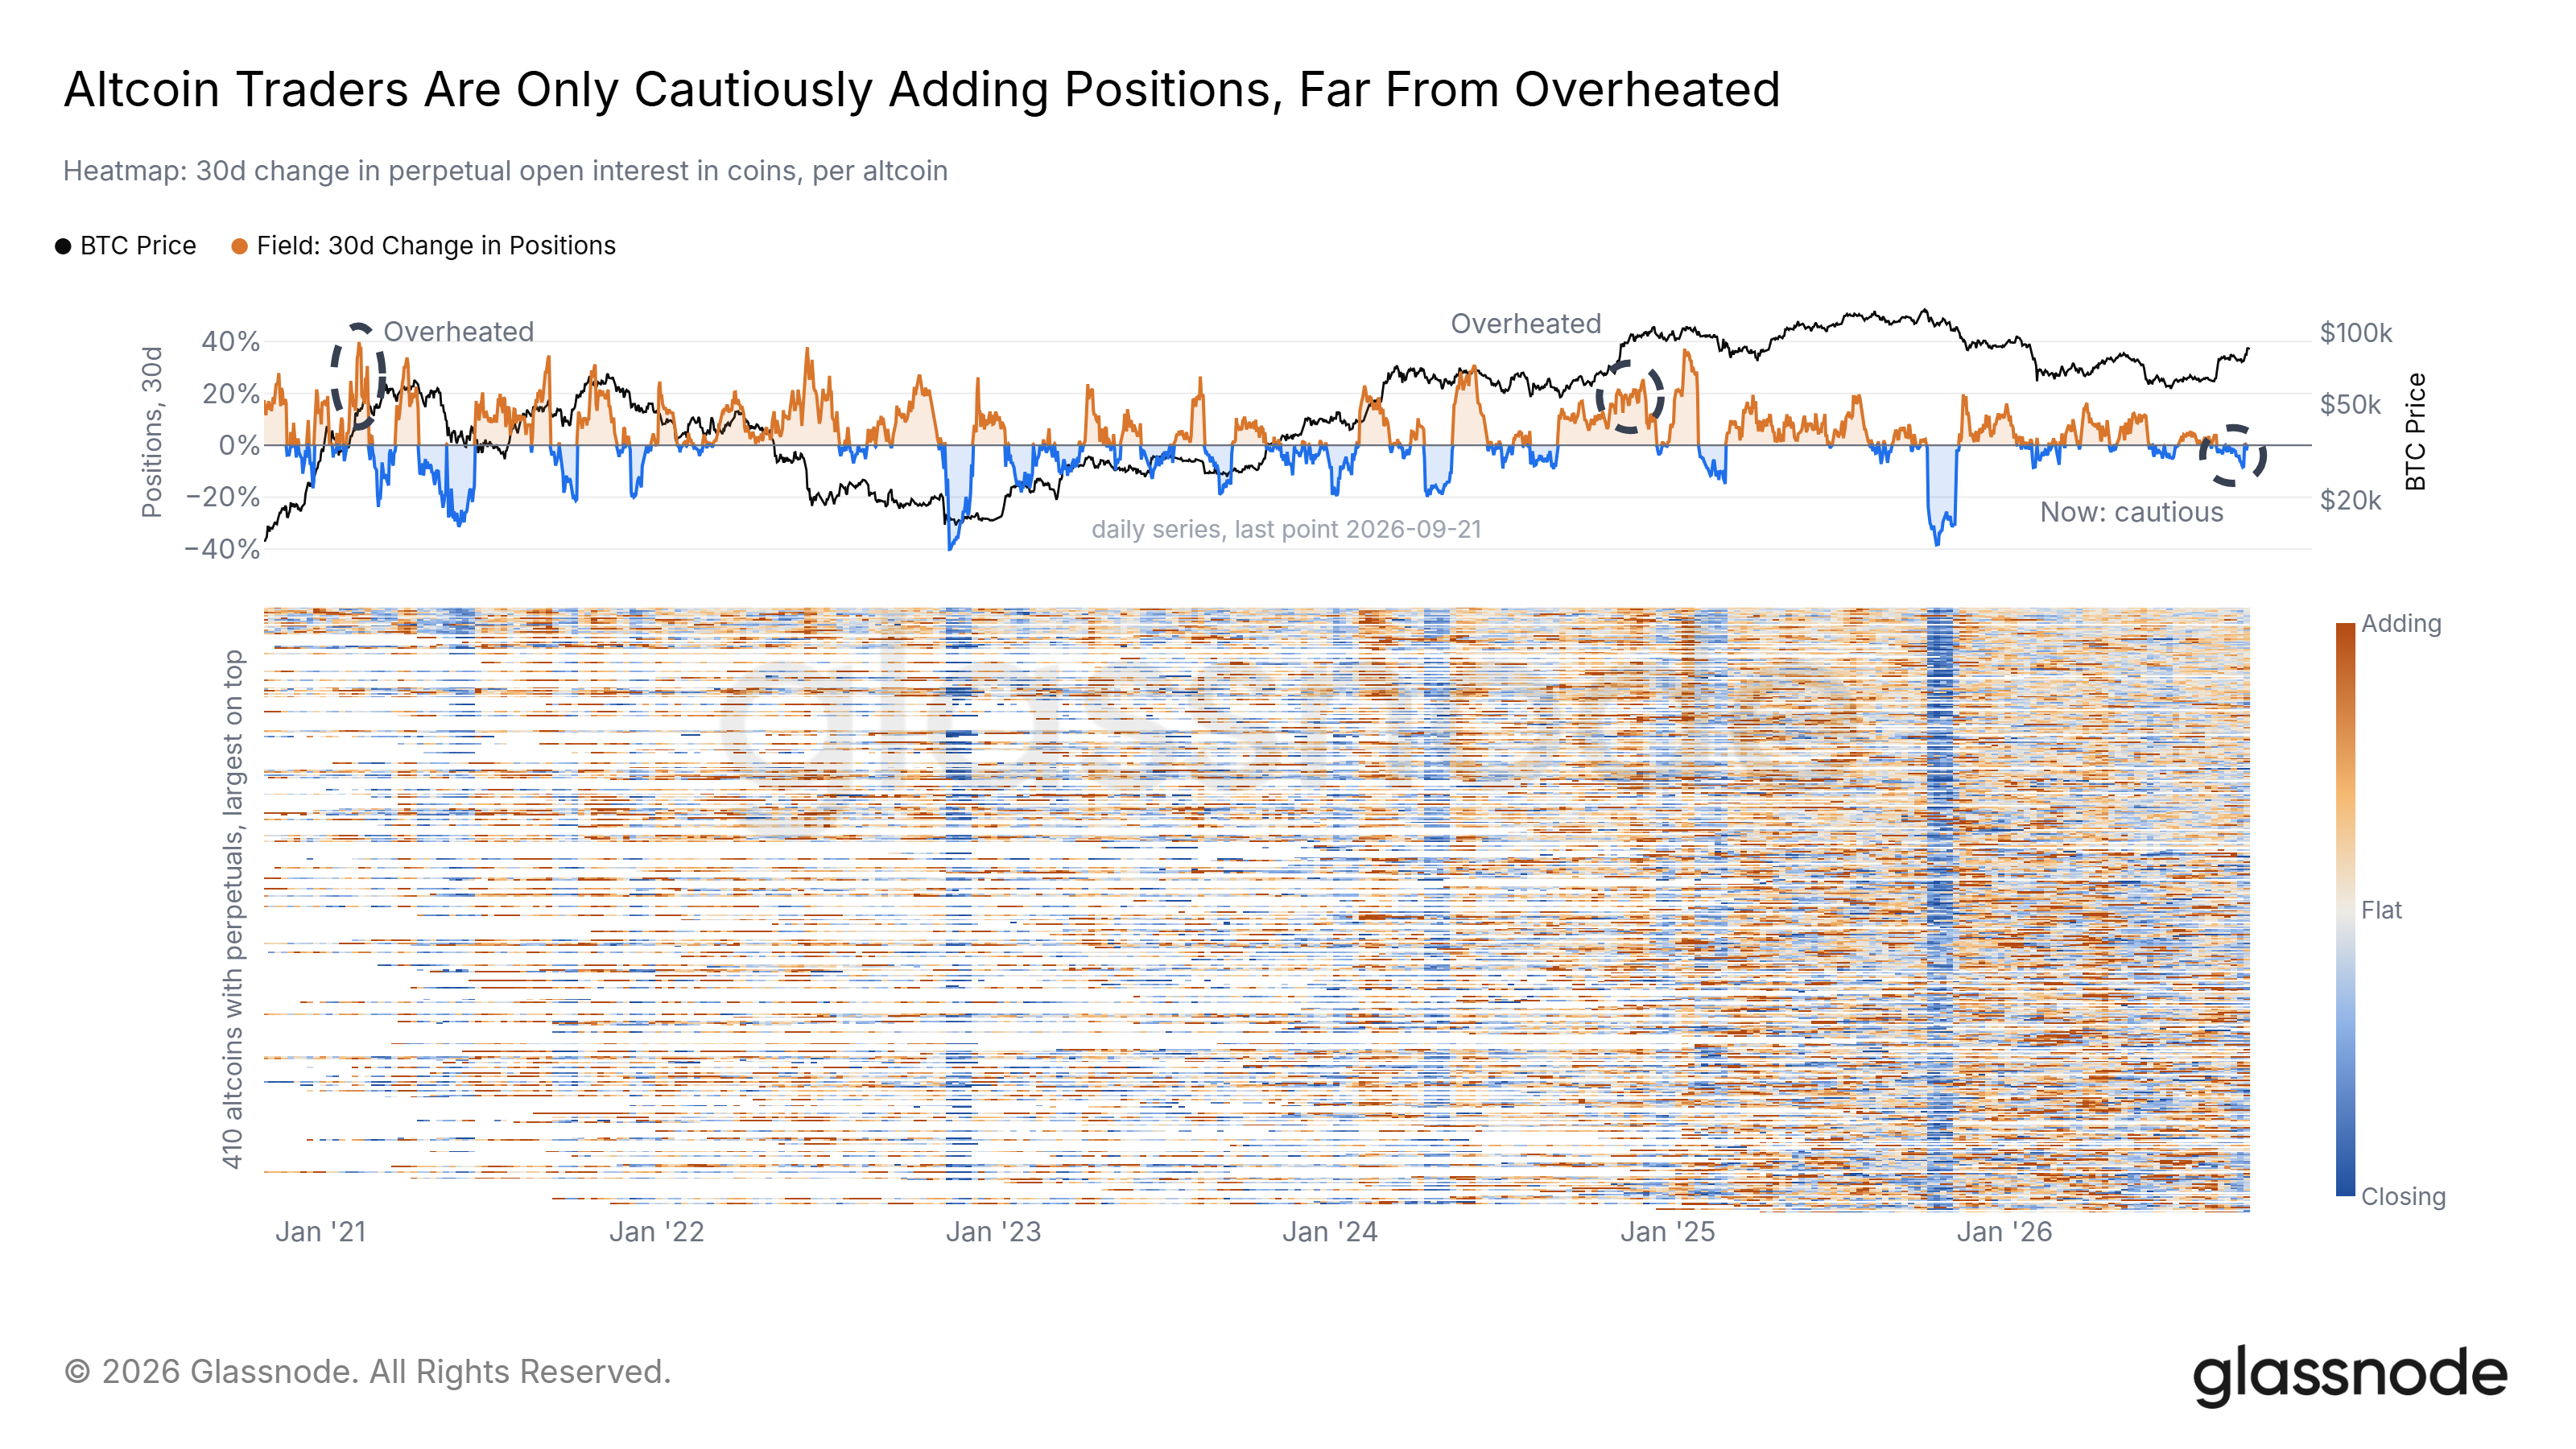
Traders have not added much leverage. Open interest in altcoin perpetual futures, counted in coins, has barely grown over 30 days, and fewer than half of the markets added positions. In the overheated periods of February 2021 and December 2024, the same measure rose sharply, with most markets adding.
The altcoin rally is driven mostly by spot buying, which makes a sudden wave of forced selling less likely. A broad jump in open interest would be the sign that the move is starting to overheat.
Conclusion
Bitcoin is now above the True Market Mean and the long-term holder block that held it back for most of 2026. The June low stayed above the Realized Price, and if price holds above $77K, it will be the shallowest bear-market low since 2017. Profit taking is light, ETF buying is picking up, and altcoins are rising without much new leverage. The next test is $95K-$97K, where options positioning and the mean MVRV price meet. Holding above $84K keeps that path open. A move back below $84K, and then below $77K, would put the recovery in doubt.
Data as-of September 21, 2026 for daily on-chain metrics, ETF flows and options, September 22, 2026 for spot volume, and September 23, 2026 for hourly price; the most recent daily points remain subject to revision.
Disclaimer: This report does not provide any investment advice. All data is provided for informational and educational purposes only. No investment decision shall be based on the information provided here, and you are solely responsible for your own investment decisions.
Exchange balances presented are derived from Glassnode’s comprehensive database of address labels, which are amassed through both officially published exchange information and proprietary clustering algorithms. While we strive to ensure the utmost accuracy in representing exchange balances, it is important to note that these figures might not always encapsulate the entirety of an exchange’s reserves, particularly when exchanges refrain from disclosing their official addresses. We urge users to exercise caution and discretion when utilizing these metrics. Glassnode shall not be held responsible for any discrepancies or potential inaccuracies.
