A Rally Running Light
Bitcoin pushed through the $85K ask wall on thin volume and little new money, and has since slipped back. Options traders lean bullish, liquidation levels stack up below price, and altcoins look stretched.



Executive Summary
- Bitcoin trading volume remains unusually low, and new money explains less than two fifths of the rise in Realized Cap.
- Recent buyers took profit into Sunday's close above $85K, sending the largest share of exchange inflows in a year.
- Options traders lean bullish again: put/call ratios sit low for 2026, and spending on calls now far outweighs spending on puts.
- Most liquidation levels sit below price, nearest at $81.7K-$83.3K, but the largest single cluster on the one-year map sits above, near $92K.
- Sellers keep placing ask blocks above price, and the largest bids on the Binance book sit at $81K.
- Each US data release this week faded in Bitcoin while stocks held, and the US session has turned into a net seller.
- Altcoins ran ahead of Bitcoin into late September, but their leverage now looks stretched and the field has started to lag.
Ready to get ahead of markets and sharpen your foresight? Try Glassnode. Sign up or talk to sales.
Running on Light Volume
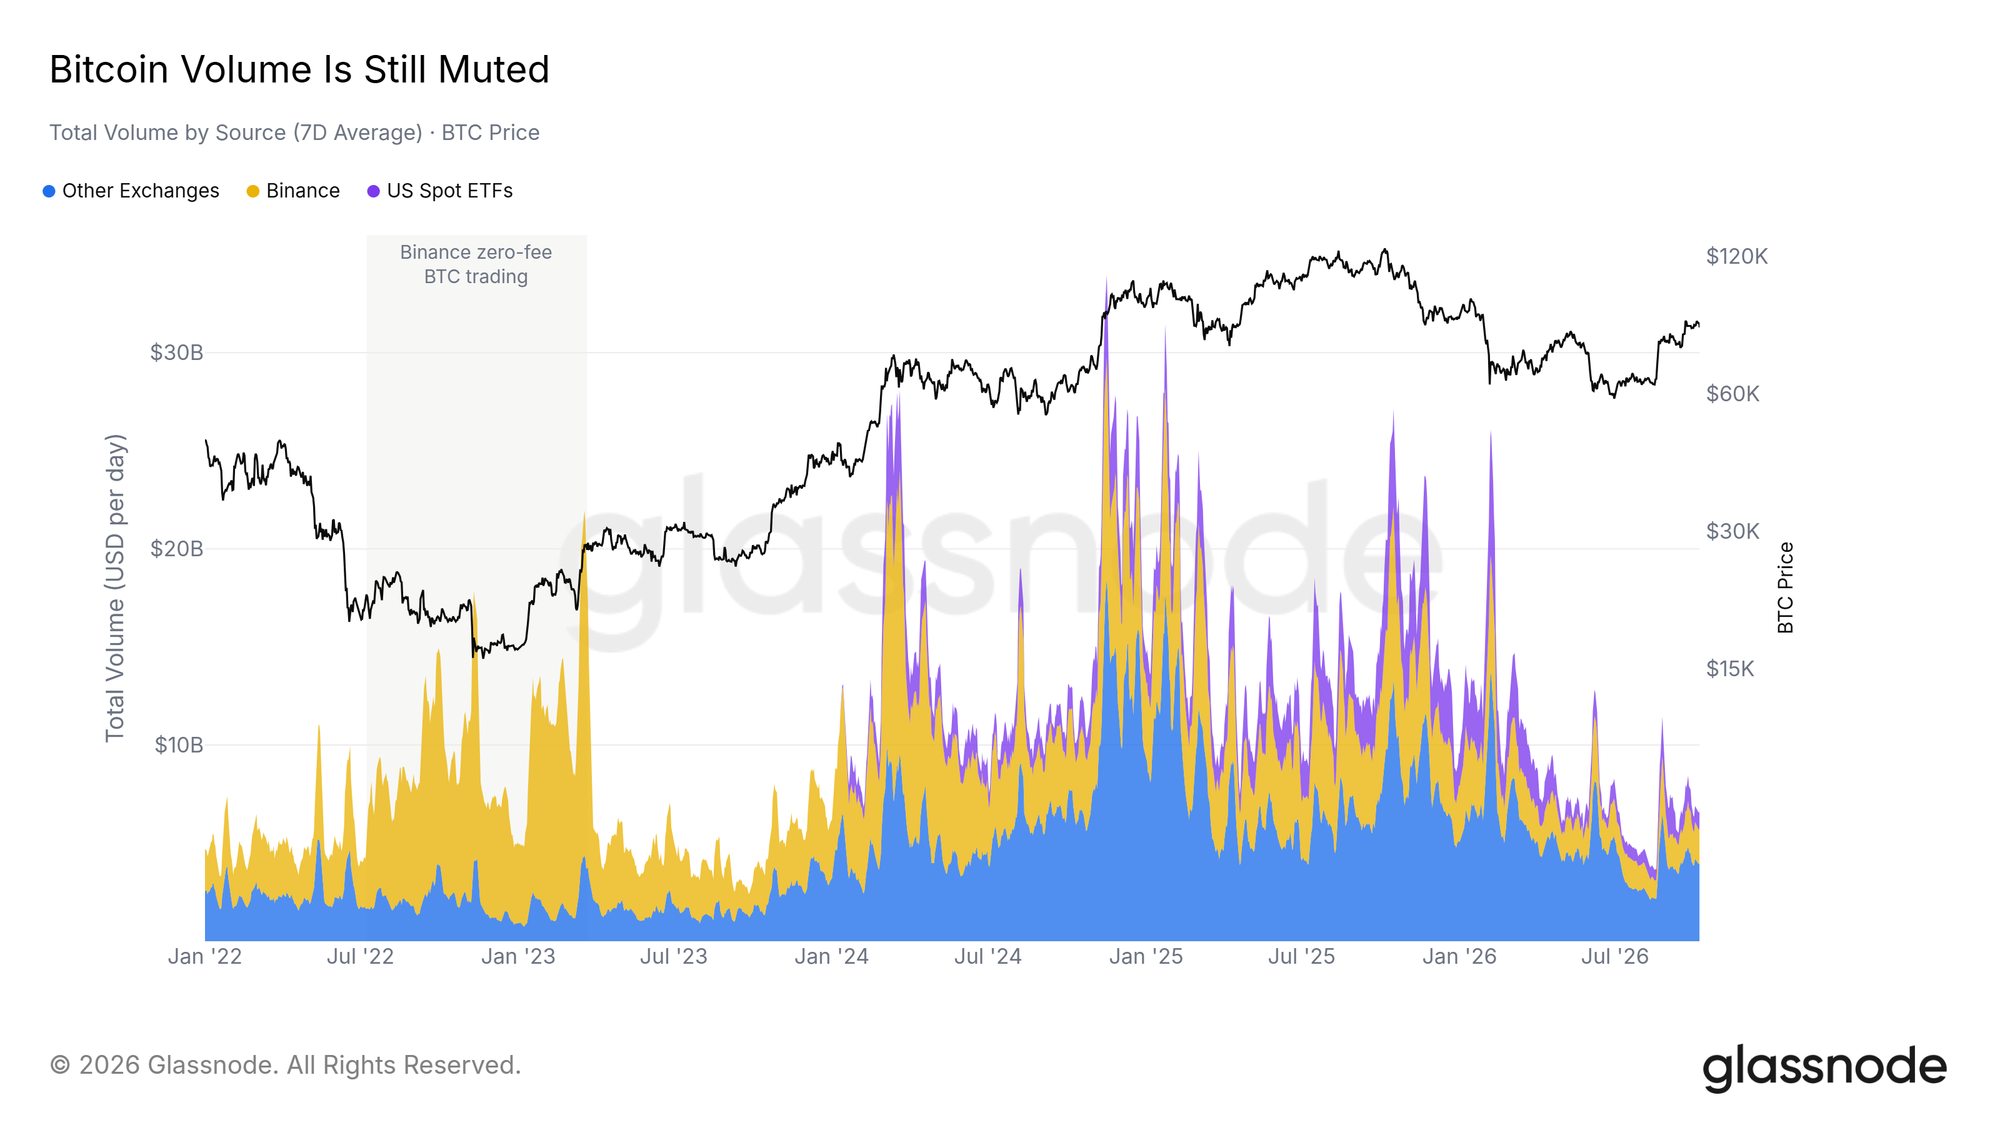
Total Bitcoin volume, spot exchanges and the US spot ETFs combined, runs at about $6.8B a day on a seven-day average. That is lower than on nine in ten days since January 2024, and far below the peaks of the past two years.
The push above $85K did not change this. Not one day since September 22 has traded a normal spot volume for its day of the week, and Sunday's close above the wall came on about half the volume of a normal Sunday. A rise in spot volume would be the first sign that buyers are coming back in size.
New Money Arrives Slowly
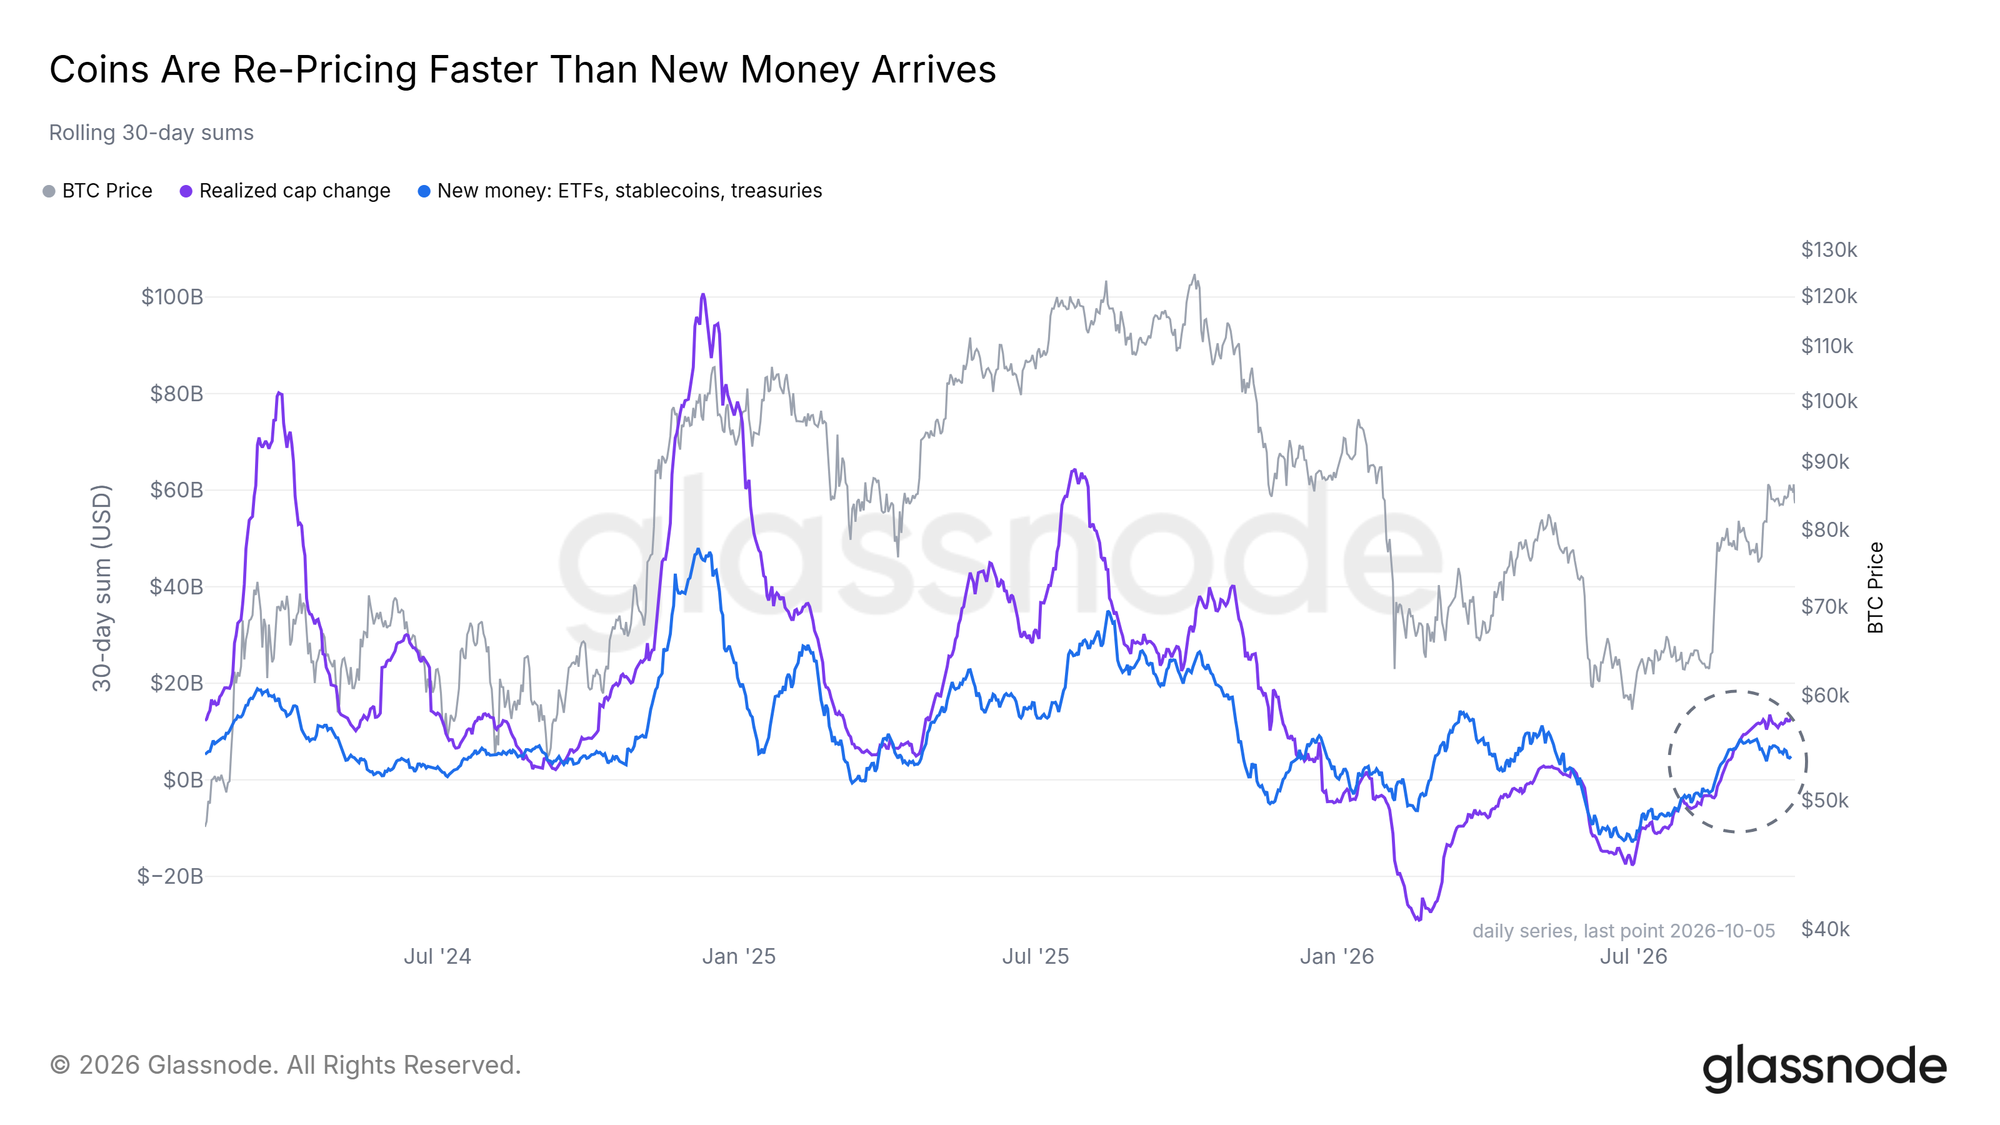
In the 30 days to October 5, US spot ETF flows, stablecoin growth and corporate treasury buying brought in about $4.9B. Over the same period, the Realized Cap, the value of all coins at the price they last moved, rose by about $12.8B.
New money therefore covers less than two fifths of that rise. The rest is coins changing hands at higher prices among money already in the market. The rallies of 2024 and 2025 showed a similar mix, but on far larger inflows. Until those inflows pick up, the move depends on existing holders paying more.
Recent Buyers Cash In
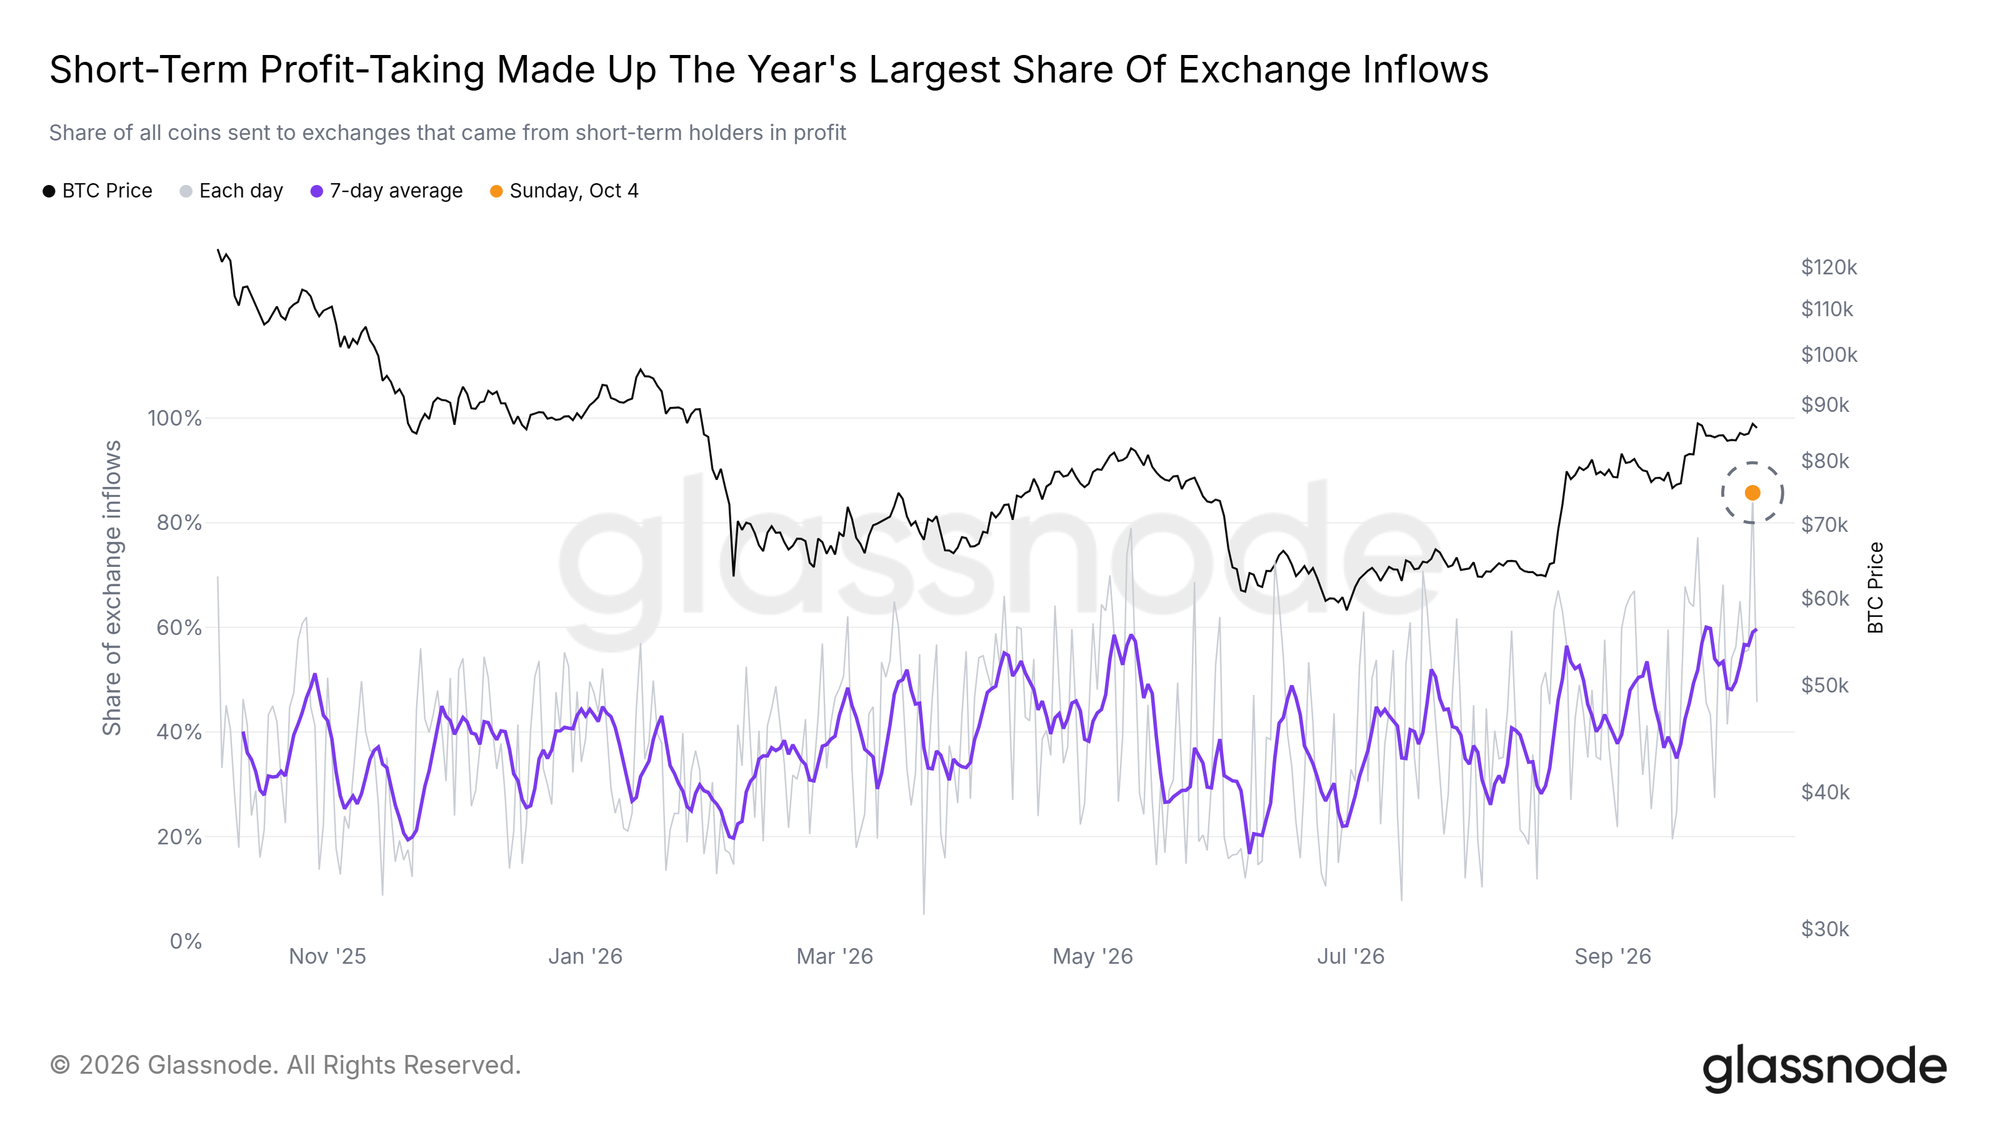
Sunday, October 4, brought the first daily close above the $85K wall, with the ETFs shut for the weekend. It was also a day of heavy profit taking. Of all the coins sent to exchanges that day, about 86% came from short-term holders, those holding for less than 155 days, moving coins at a profit. That is the highest share of any day in the past year; on a typical day it is under two fifths.
The sellers who met the breakout were the buyers of the past few months. If they keep sending coins to exchanges at this pace, the next push toward $85K would meet the same supply.
Options Lean Bullish
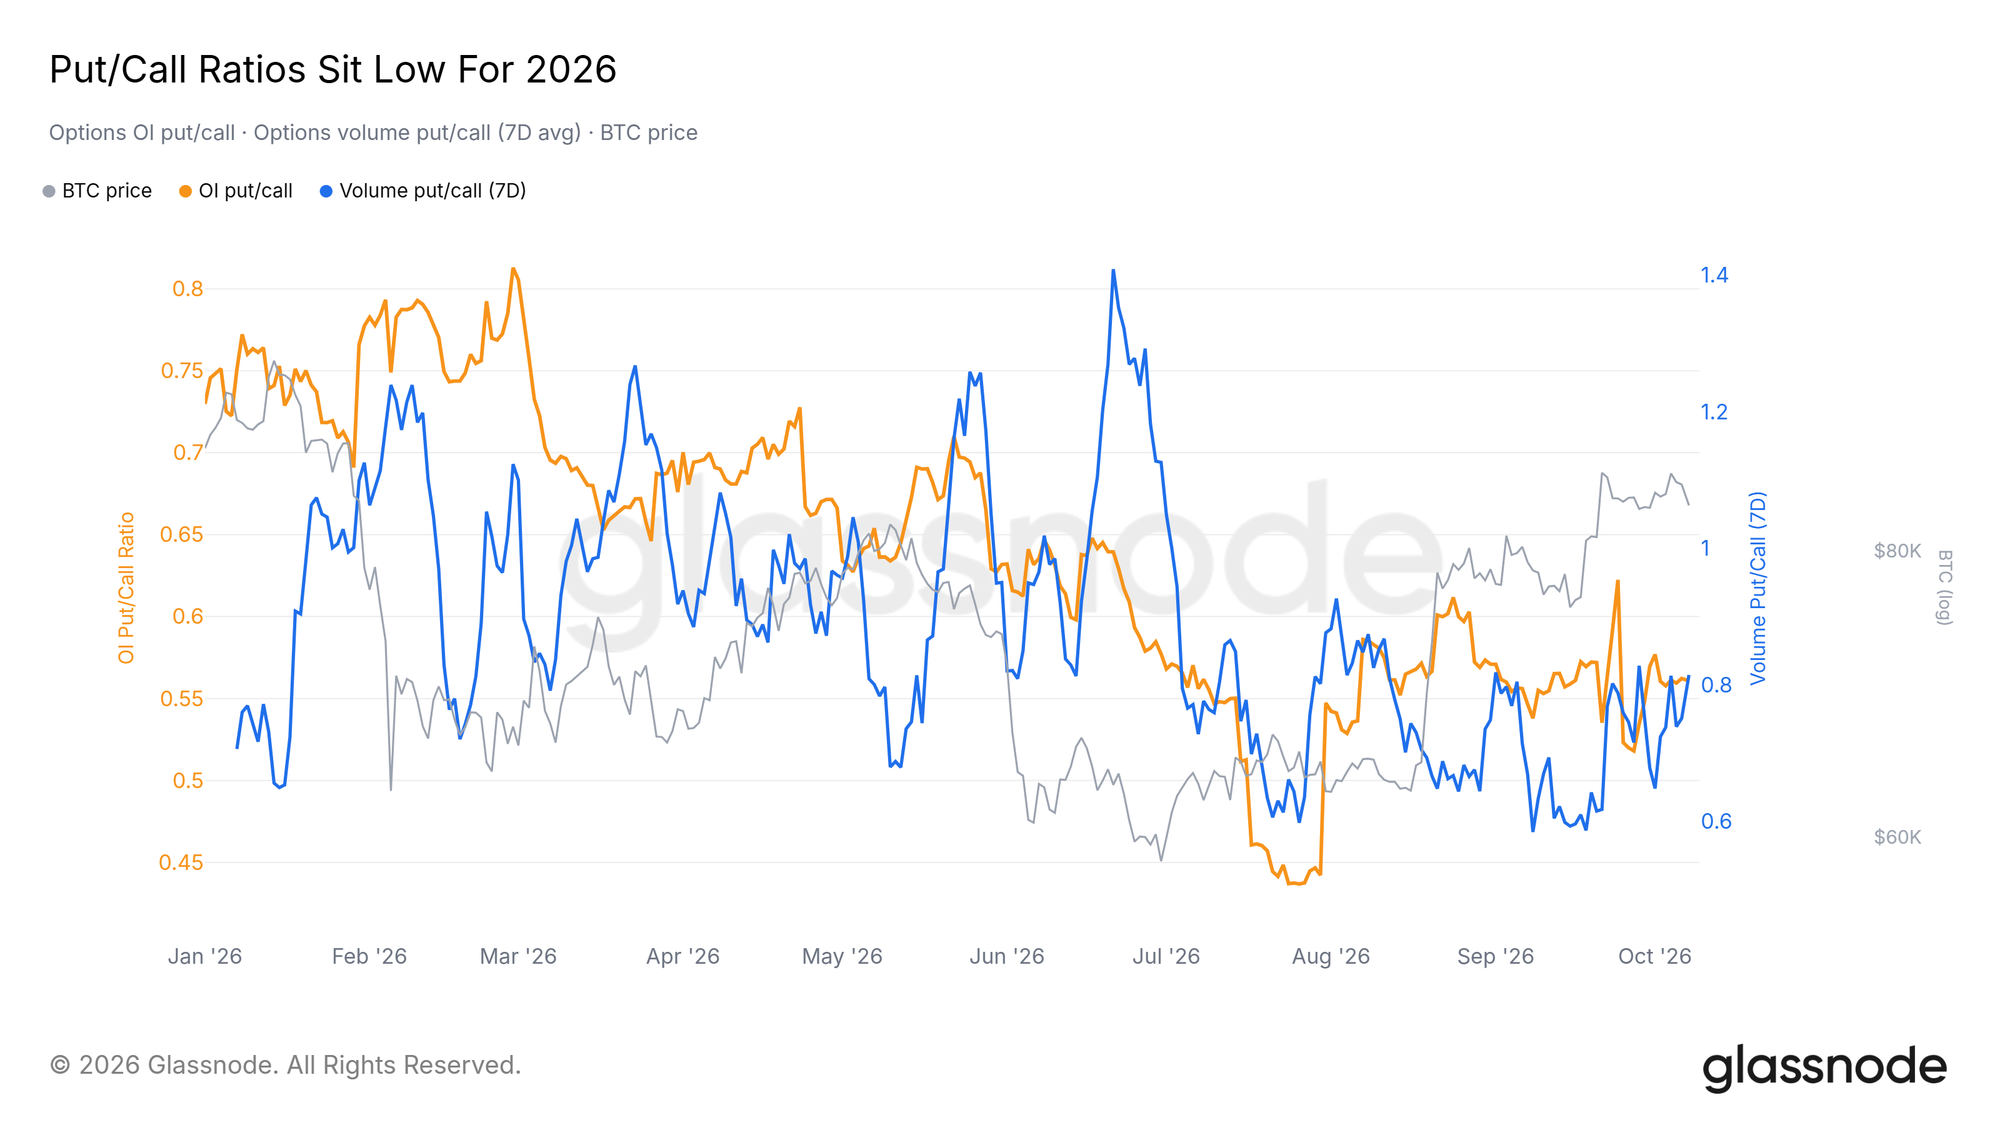
The options market has turned bullish again. Both put/call ratios, for open interest and for traded volume, sit below one and in the lower third of their 2026 ranges. In open interest there are now about 0.56 puts for every call.
Paying Up for Upside
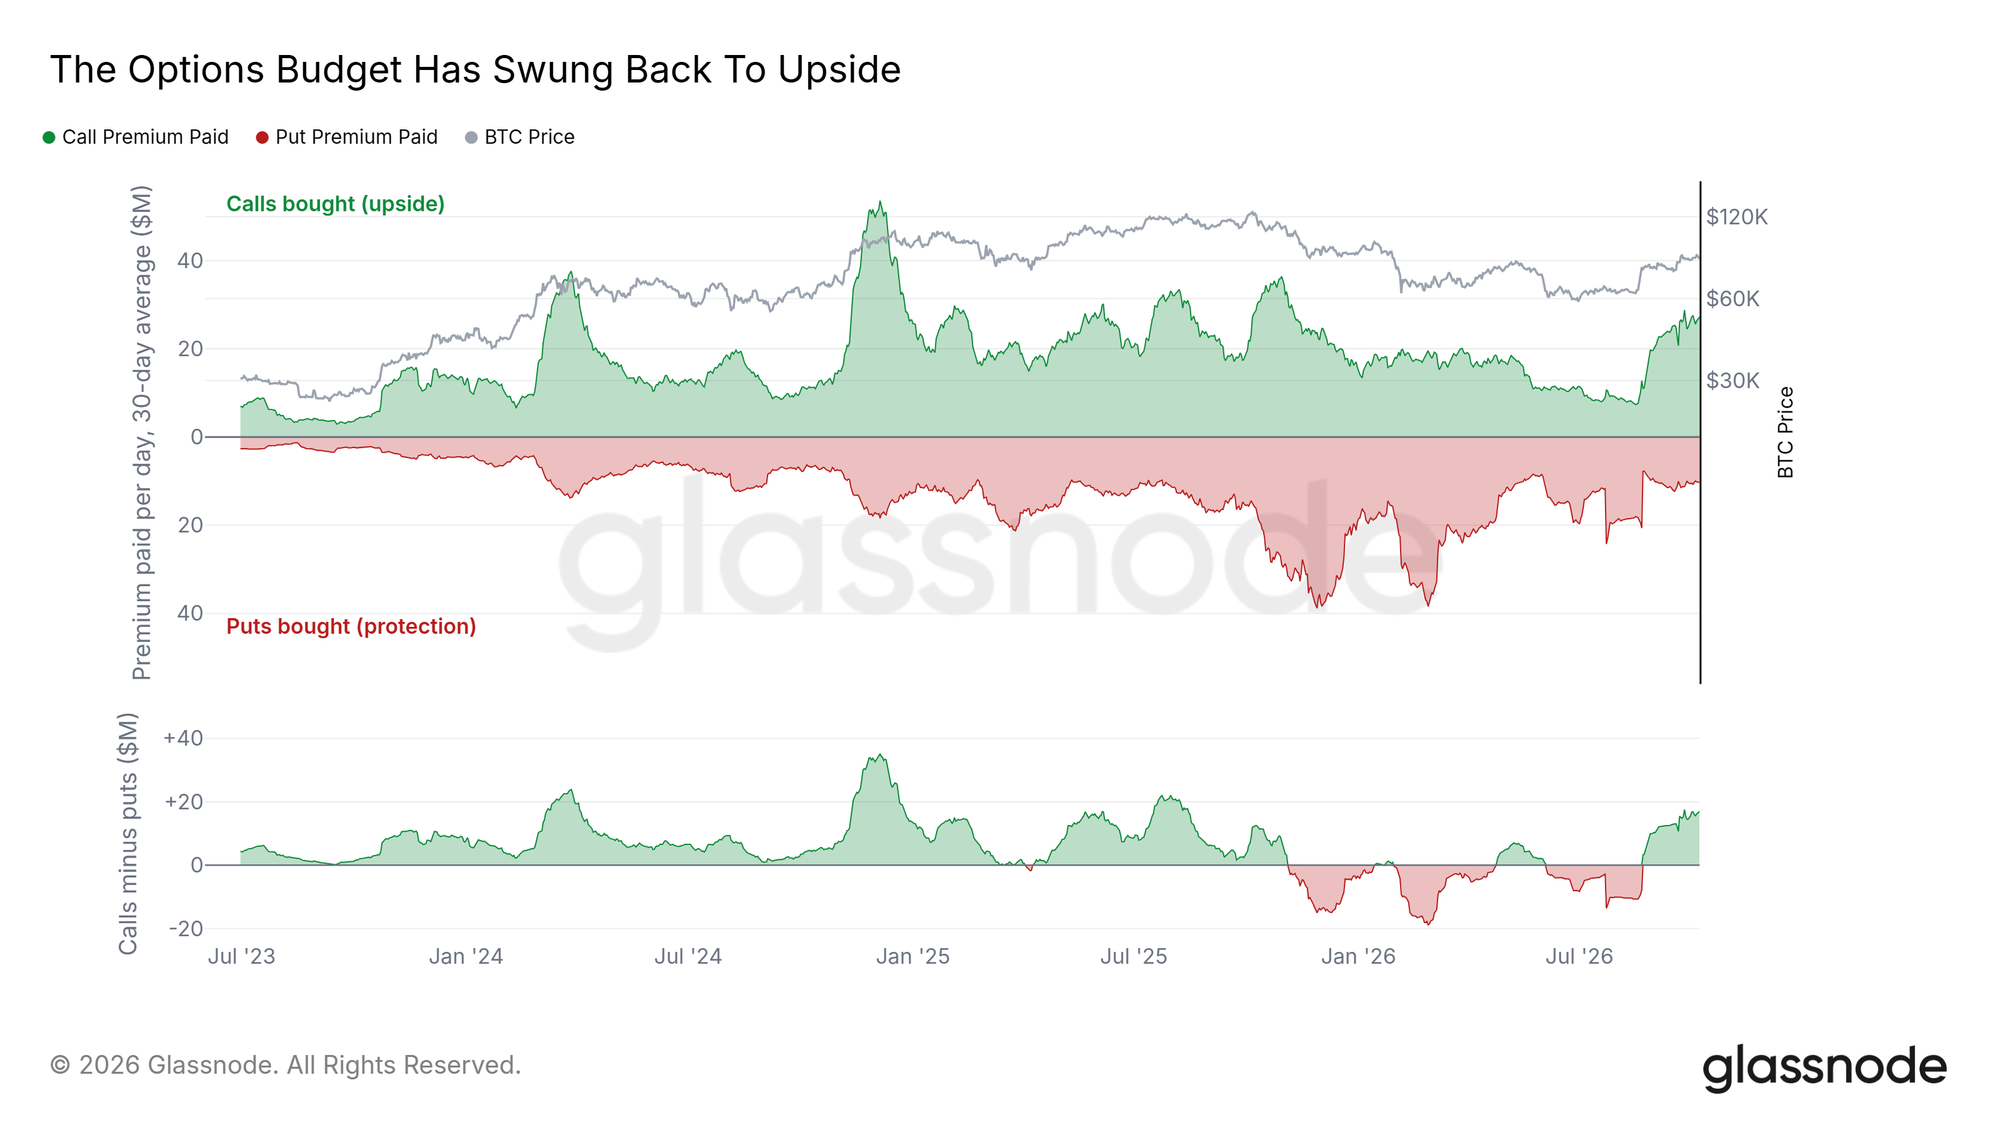
Premium paid points the same way. For most of the past year, traders spent more on puts than on calls: puts led on 234 of the last 365 days. That flipped after mid-August. On a 30-day average, traders now spend about $17M a day more on calls than on puts, about half the widest gap on the chart.
This is optimism building, and it can turn into froth if price stalls while traders keep paying for upside. History gives the setup no clear direction: in 13 past episodes since 2020 with short-dated calls this expensive against puts and volatility this cheap, Bitcoin was higher a month later in 7.
Liquidations Stack Up Below
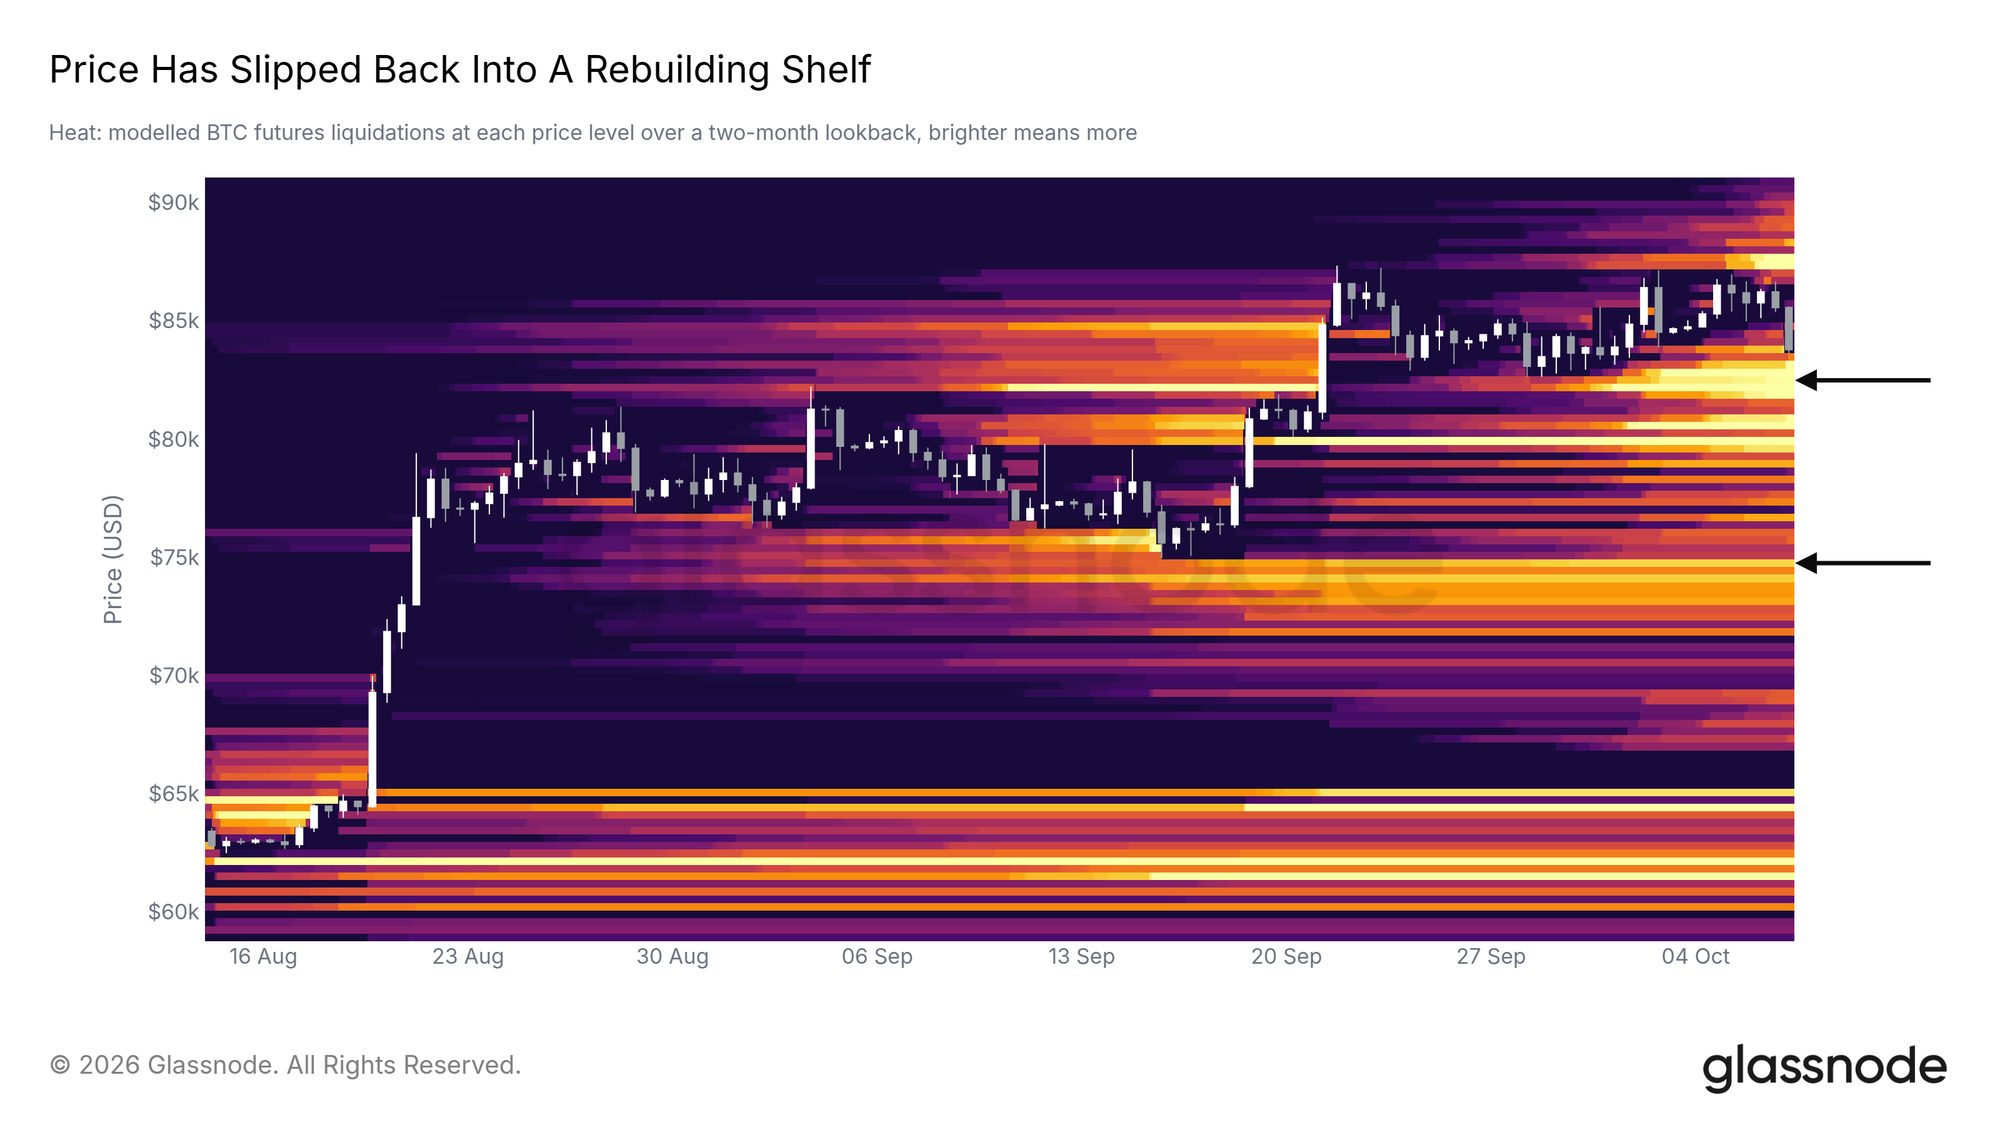
Liquidation levels are piling up under price. On the two-month liquidation heatmap, which models where leveraged futures positions would be forced to close, only about 17% of the levels sit above the current price. The shelf around price has grown by about half in a week.
The nearest large cluster sits right under price, between about $81.7K and $83.3K. A second sits near $75K, and the heaviest band of all sits far lower, at $60K-$63K. Should price trade down into these clusters, forced selling of long positions could add to the move.
The Largest Cluster Sits Above
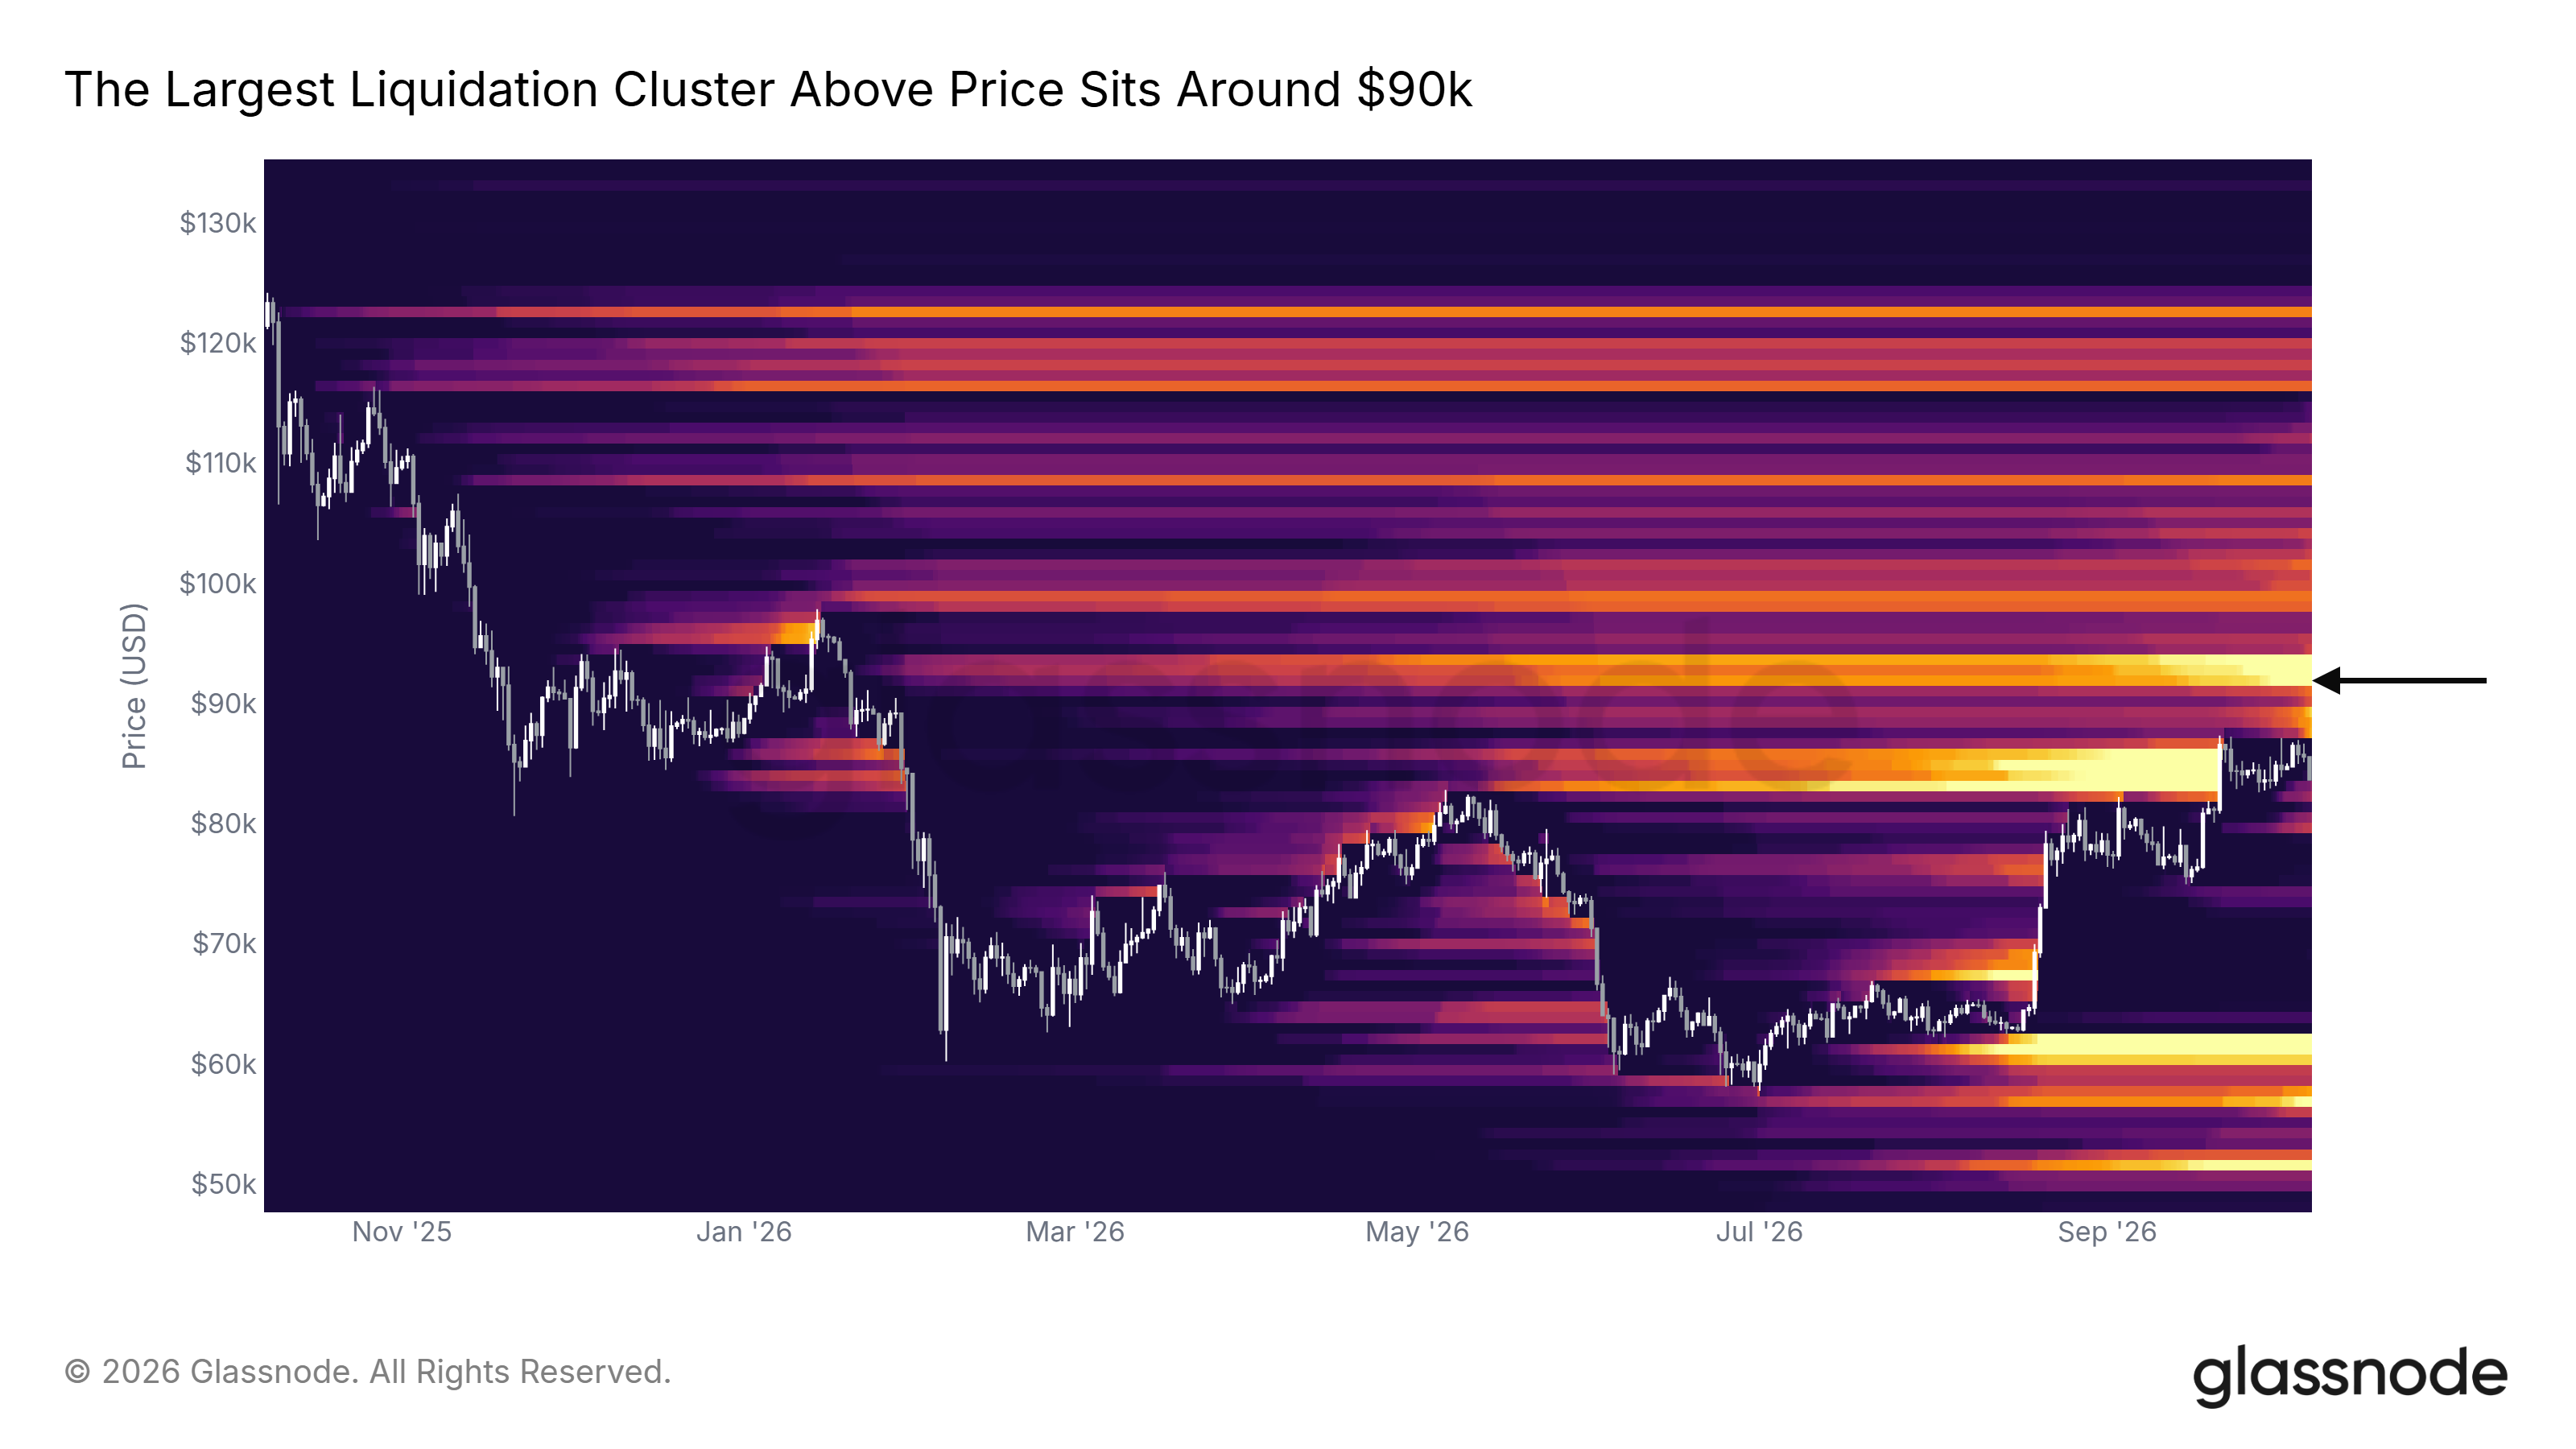
The one-year map shows the other side. The largest single cluster above price runs from about $87.1K to $95.9K and is heaviest near $92K. Half of it has built up since late March, as short positions gathered above the range.
Should price push back through the ask block at $86.5K, forced closing of those shorts could add to a move higher. Until then, the nearer clusters below price matter more.
Asks Above, Bids at $81K
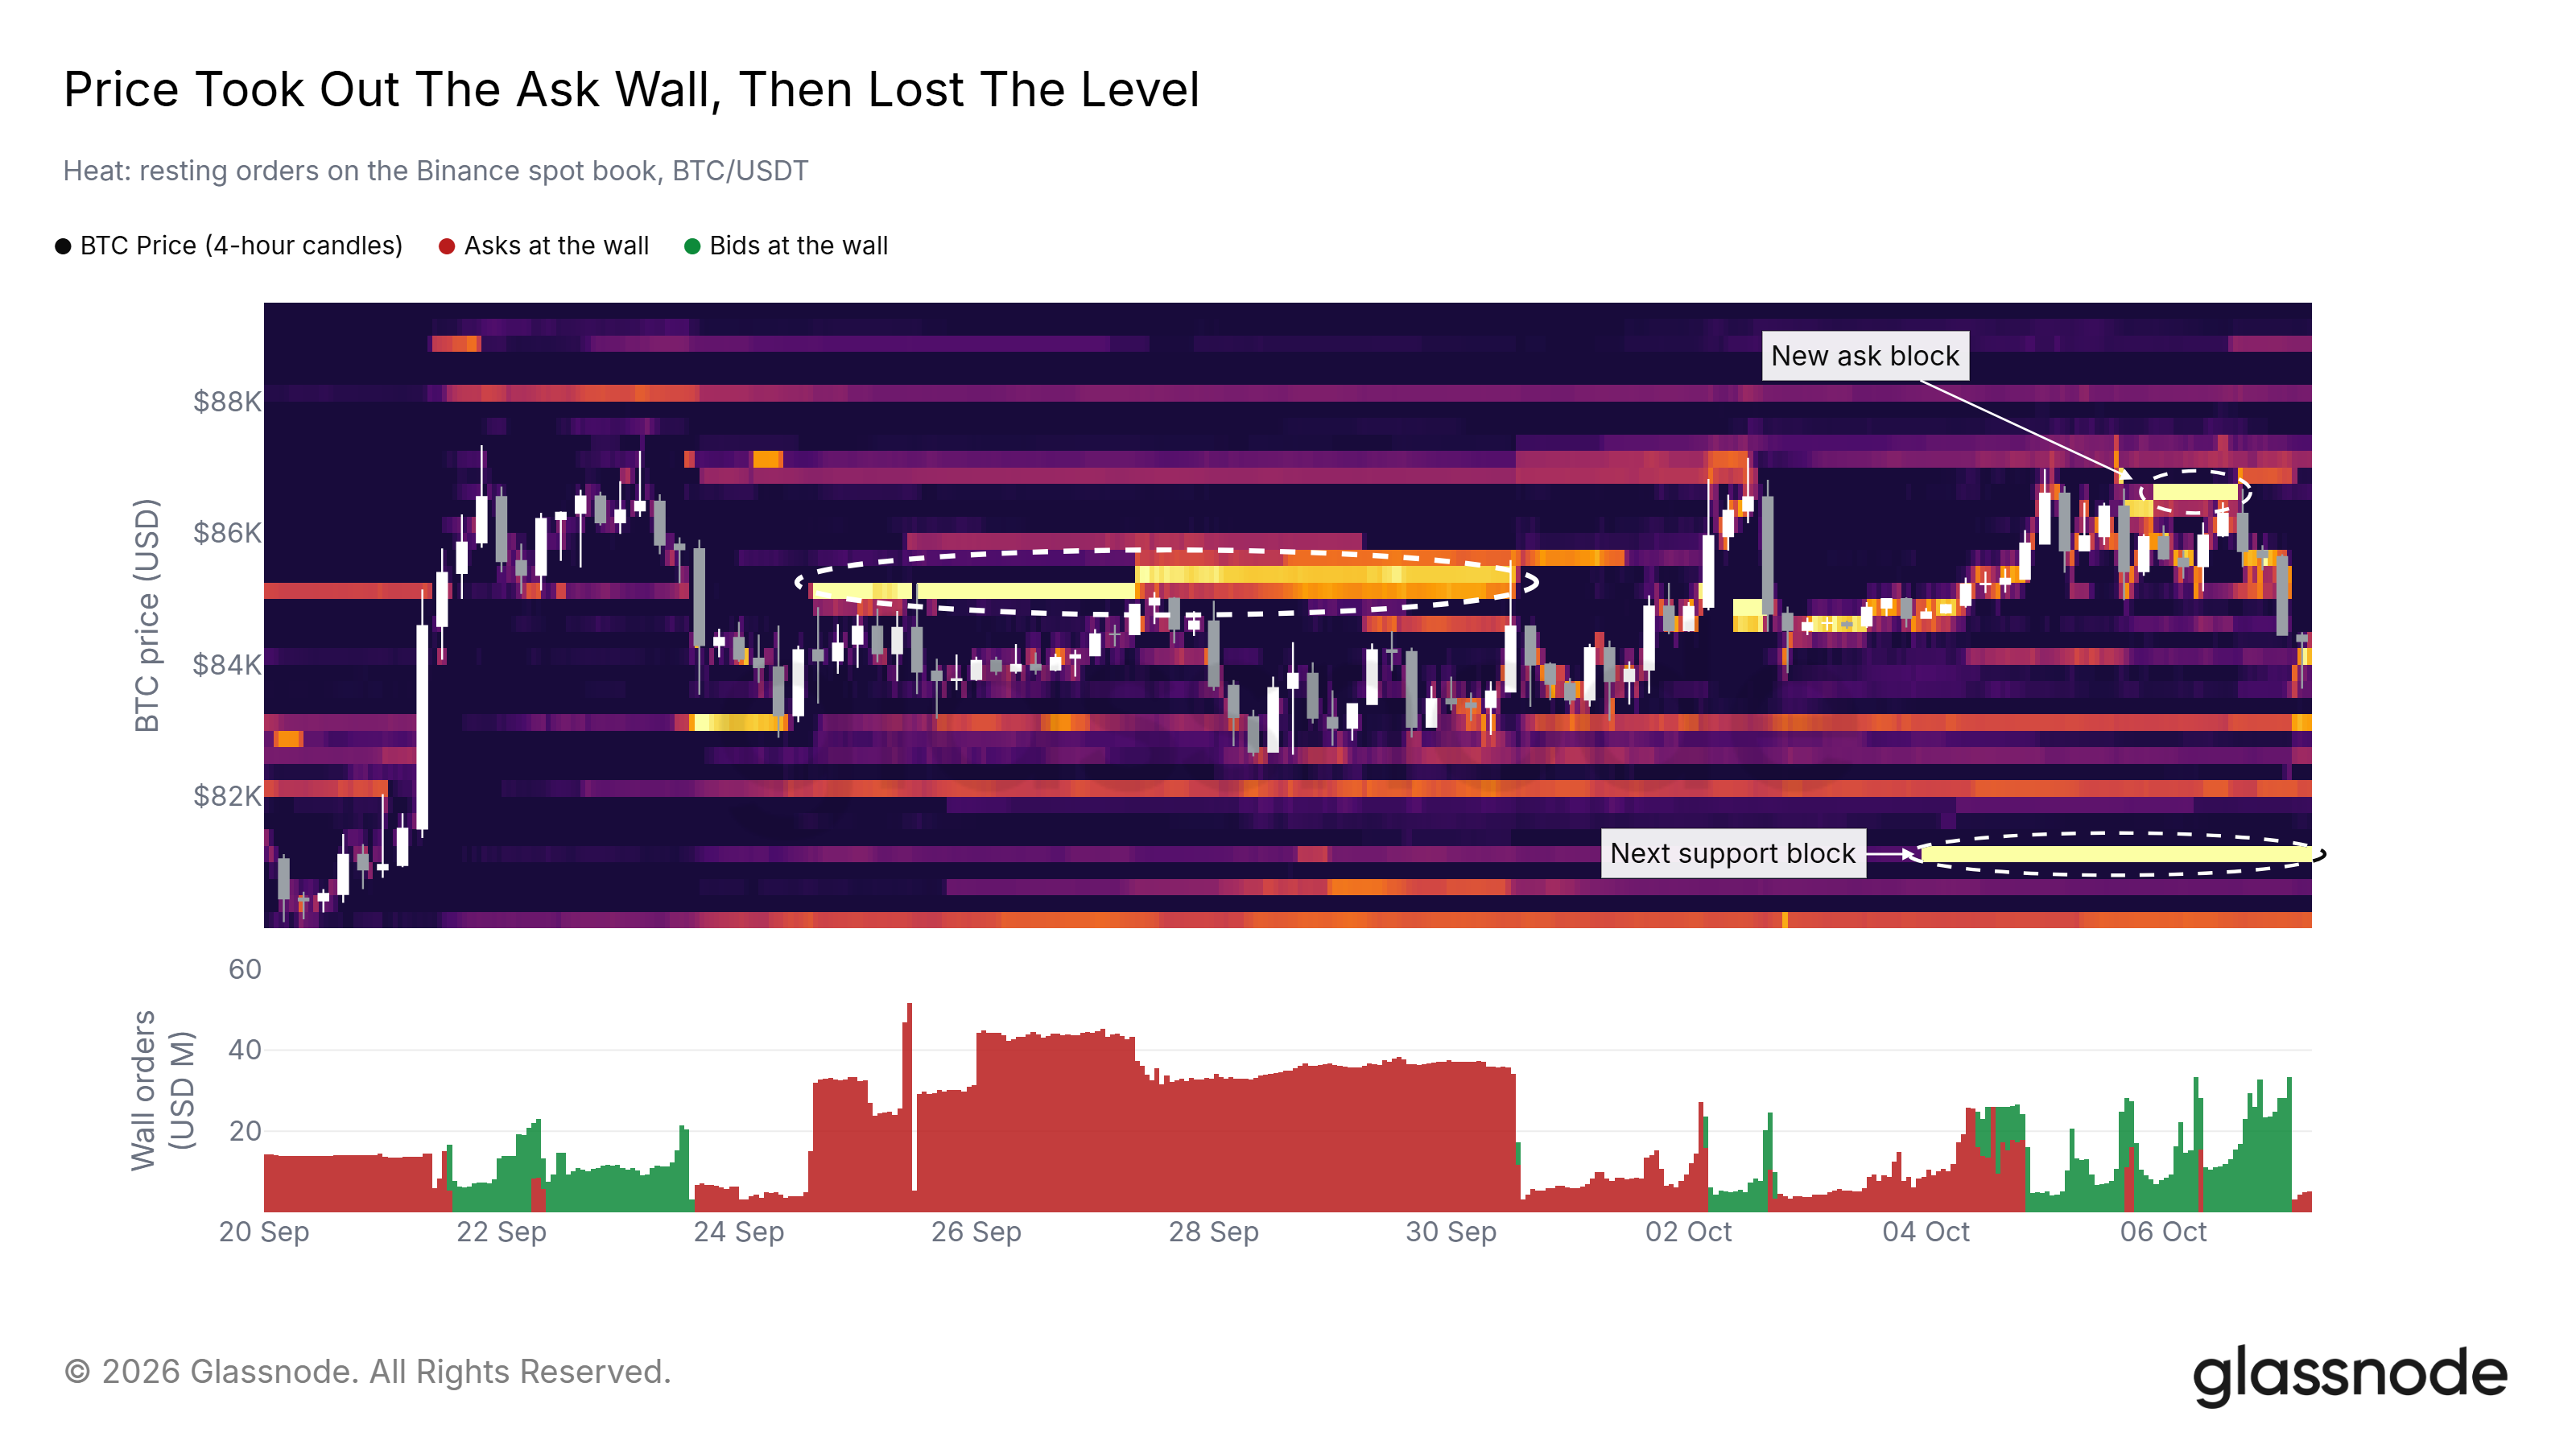
Last week, this report described a wall of sell orders at $85K-$85.5K on the Binance spot book. Buyers traded through it on September 30, and price closed above $85K on October 4 and October 5.
Sellers then placed a new block of asks at $86.5K-$86.75K. Price turned back under it on October 6, and early on October 7 it broke through the bids that had built up at $85K. The largest block of bids now sits at $81K-$81.25K and has stood since October 3. With the liquidation cluster just above it, $81K is the level to watch if the slide continues. A settled close back above $85.5K would win back the level the market lost this week.
Macro Offers No Lift
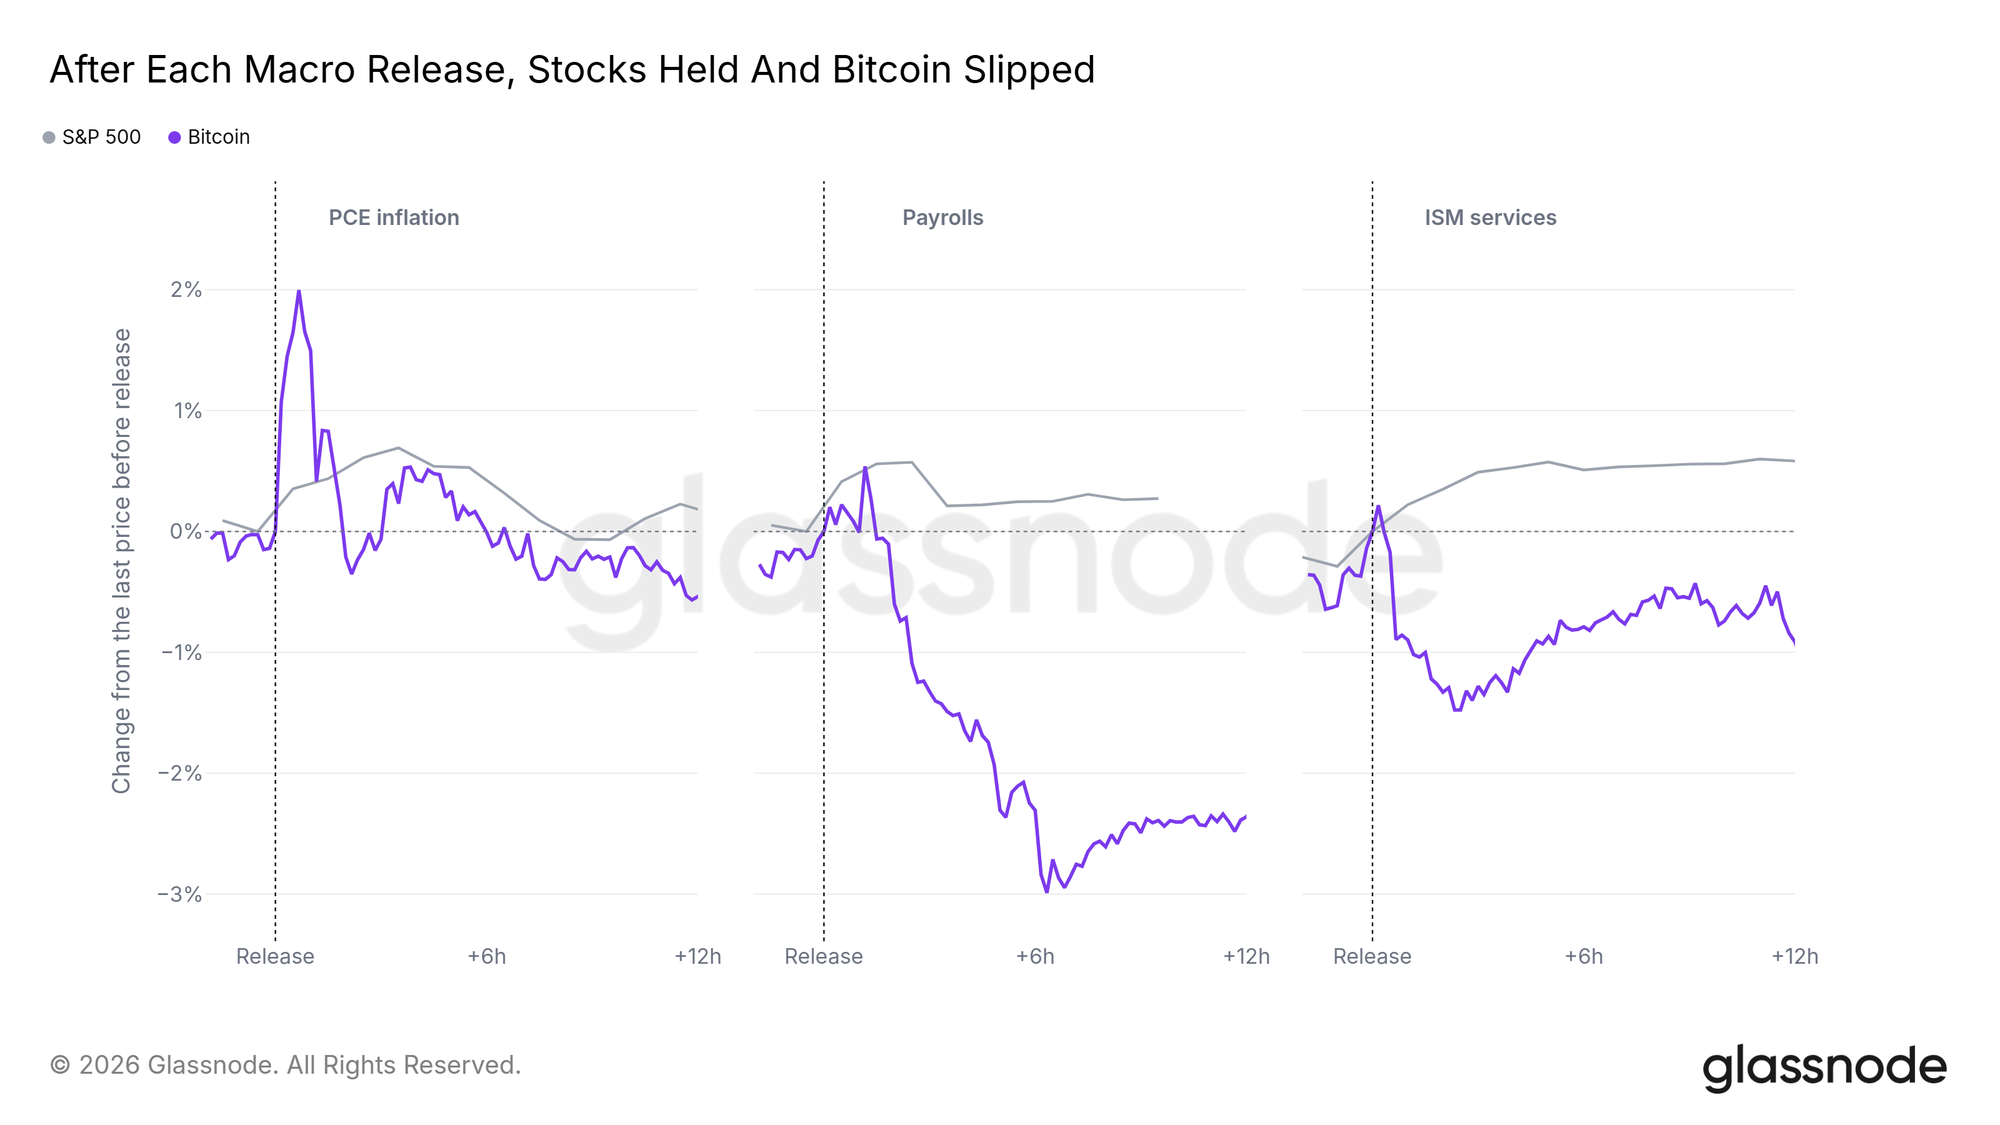
US data gave Bitcoin no help this week. All three releases followed the same pattern: an early move up, then a fade within twelve hours, while the S&P 500 held above its pre-release level each time. After PCE inflation, Bitcoin gave back an early 2% jump. After payrolls on October 2, it was 2.3% lower twelve hours later.
The next test is the CPI release on October 14. The minutes of the last FOMC meeting are due late on October 7, after the data in this edition.
The US Session Sells
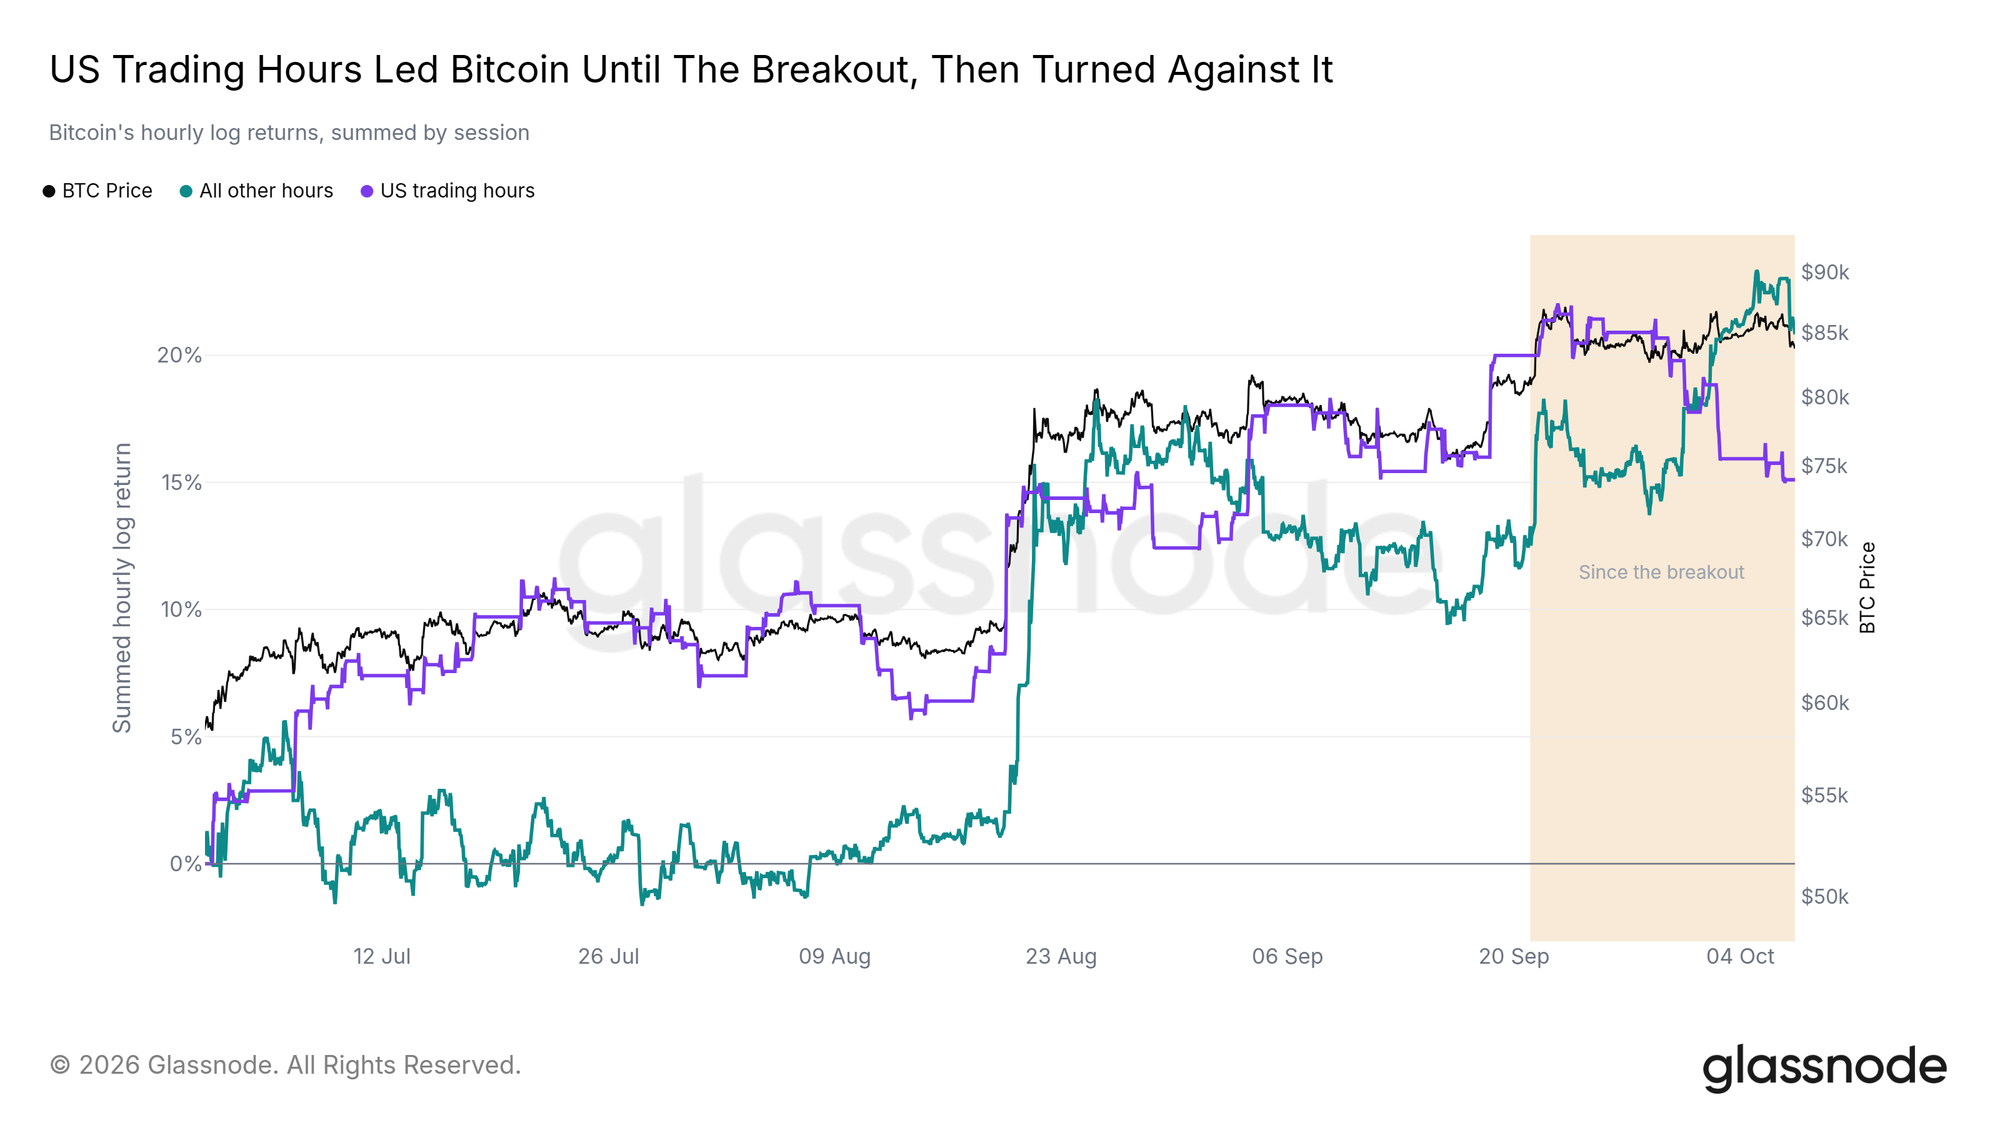
The trading clock shows the same weakness. From July until the breakout on September 21, Bitcoin made most of its gains during US trading hours. Since the breakout, the US session has been a net seller, and all of Bitcoin's net gain has come in the rest of the day, including the weekend that carried Sunday's close above $85K.
US hours are when the ETFs and the stock market trade. Until that session turns positive again, the rally rests on thinner overnight and weekend trading.
Altcoins Stretch, Then Lag
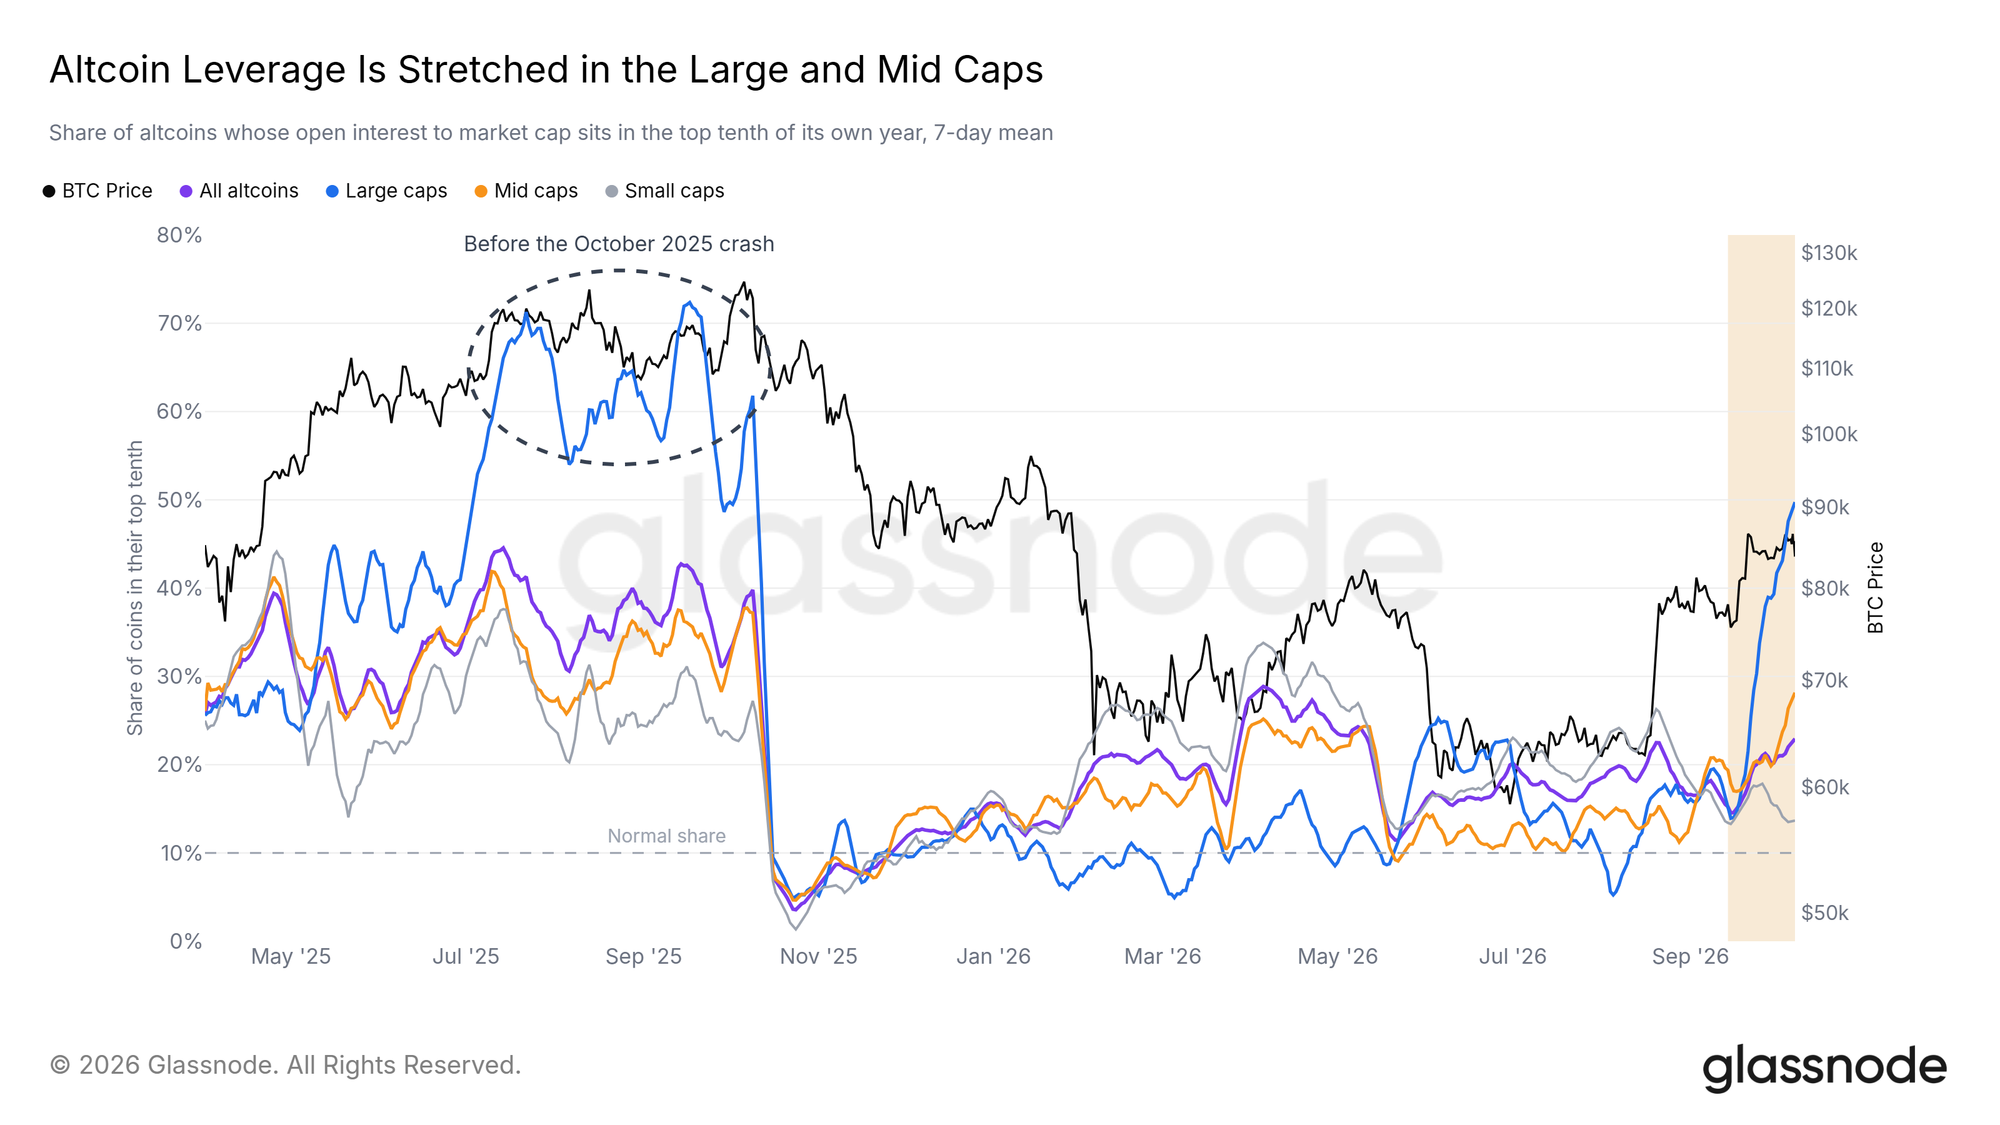
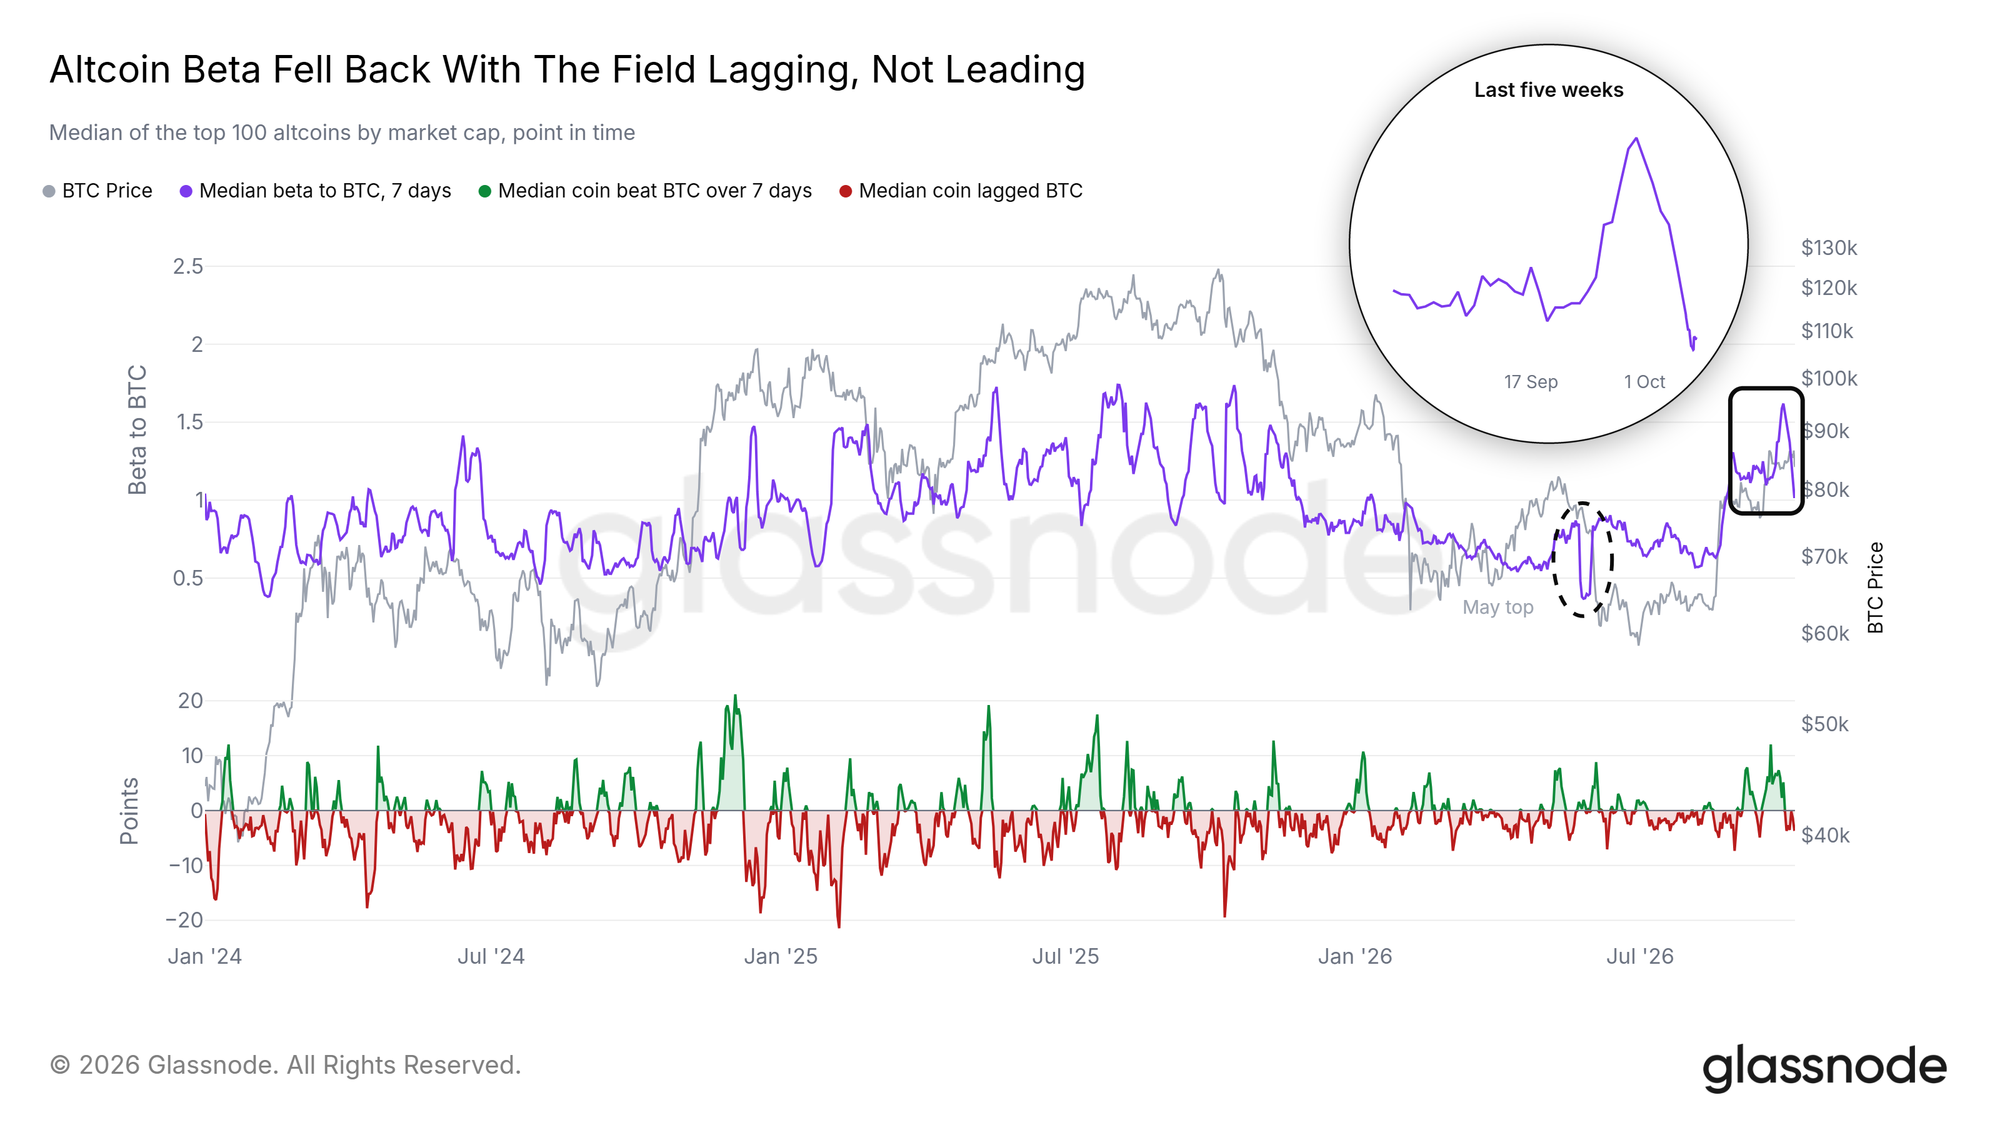
Altcoins had a strong run into late September. In each of the two weeks before this one, about seven in ten beat Bitcoin. In the latest week, fewer than three in ten did.
The leverage built up along the way has not cleared. A growing share of large-cap altcoins carry open interest that is high against their market cap, by the standard of each coin's own past year. That share is now the highest since the run-up to the October 2025 crash, and mid caps are stretched too. Part of the rise comes from prices falling while positions stay open. Should prices keep falling with those positions open, a forced unwind could follow.
The Field Falls Behind
Altcoin beta confirms the turn. Last week, the median altcoin was amplifying Bitcoin's moves. Its beta, how much it moves for each move in Bitcoin, has since dropped back toward one, and the median coin now trails Bitcoin.
With beta near one, a further slide in Bitcoin would hit the field at least as hard. Coins beating Bitcoin again, with beta rising, would show the rotation resuming.
Conclusion
Bitcoin spent the week around $85K without the volume, new money or US-session demand behind a lasting breakout. Recent buyers sold into the move, options traders turned bullish, and liquidation levels and bids gathered below price. The market now leans on positioning more than on fresh demand.
A pickup in spot volume and ETF buying, with a settled close back above $85.5K, would show the breakout has real support and bring the cluster near $92K into reach. A break of the bids at $81K would bring the liquidation clusters below into play, and with altcoin leverage stretched, the wider market would feel it too.
Data as-of October 5, 2026 for daily on-chain metrics and new-money flows, October 6, 2026 for daily volume and the macro release windows, and October 7, 2026 for hourly price, options, the liquidation heatmaps and the Binance order book; the most recent daily points remain subject to revision.
Disclaimer: This report does not provide any investment advice. All data is provided for informational and educational purposes only. No investment decision shall be based on the information provided here, and you are solely responsible for your own investment decisions.
Exchange balances presented are derived from Glassnode’s comprehensive database of address labels, which are amassed through both officially published exchange information and proprietary clustering algorithms. While we strive to ensure the utmost accuracy in representing exchange balances, it is important to note that these figures might not always encapsulate the entirety of an exchange’s reserves, particularly when exchanges refrain from disclosing their official addresses. We urge users to exercise caution and discretion when utilizing these metrics. Glassnode shall not be held responsible for any discrepancies or potential inaccuracies.
