Strategy Watch #7
Our monthly analysis of strategy performance and capital flows in digital assets. We examine fund returns, structured product trends, and allocator shifts to reveal how institutional demand and exposure are evolving across crypto markets.


The full report is freely available in PDF format.
Welcome to Strategy Watch #7
Strategy Watch was built to address a clear demand for high-signal, impartial analysis of fund-level performance and allocation trends in digital assets.
Our objective is simple: to make Strategy Watch a must-read monthly publication for the digital asset investment community.
This publication is strengthened by direct input from market participants. Funds and allocators that contribute data and insights help shape a more complete and valuable view of the landscape. If you have insights, data, or allocation updates worth sharing, we welcome your contribution.
Present your latest initiatives and updates to a curated audience of institutional allocators.
Inside the Latest Strategy Watch
The report is structured across six core sections, each focused on a distinct dimension of institutional activity in digital assets:
01 Institutional Flow Monitor | Net outflows narrowed across BTC, ETH and stablecoins in July, spot ETFs swung back to inflows as the treasury bid faded, and CME carry rebuilt. Is the acute phase of institutional de-risking over?
02 Fund and SMA Performance | July delivered a recovery without conviction: directional strategies missed a narrow, Ether-led bounce while market-neutral books ground out gains in the tightest yield environment of the year.
03 Strategy Deep Dive: Trading the Chop | Two managers, one tape: discretionary trader Grant Fisher of Meli Vora Capital and systematic multi-strategy manager Rupam Shrivastava of Frontiers Capital on how they traded July's violent range.
04On-chain Vault Performance | USD curators matched the risk-free rate again and ETH vaults trailed staking, while the SEC signalled vaults may fall within securities laws and deposits posted their strongest monthly build this year. On-chain credit continues to stabilize, but can vault yields compete with Treasury rates and native ETH staking?
05Manager Monitor | See how 400+ managers are positioning as cash levels rise into a recovering tape, fundraising conversations sit at survey lows, and Hyperliquid joins Solana in second place for manager attention.
06Allocation Updates | 13F filings split Wall Street on bitcoin ETFs, SBI closed its Coinhako stake, and RockawayX, Franklin Templeton, Schroders and Keyrock all expanded their digital asset platforms.

The Premier Digital Assets Allocator Platform. Learn more
Institutional Flow Monitor
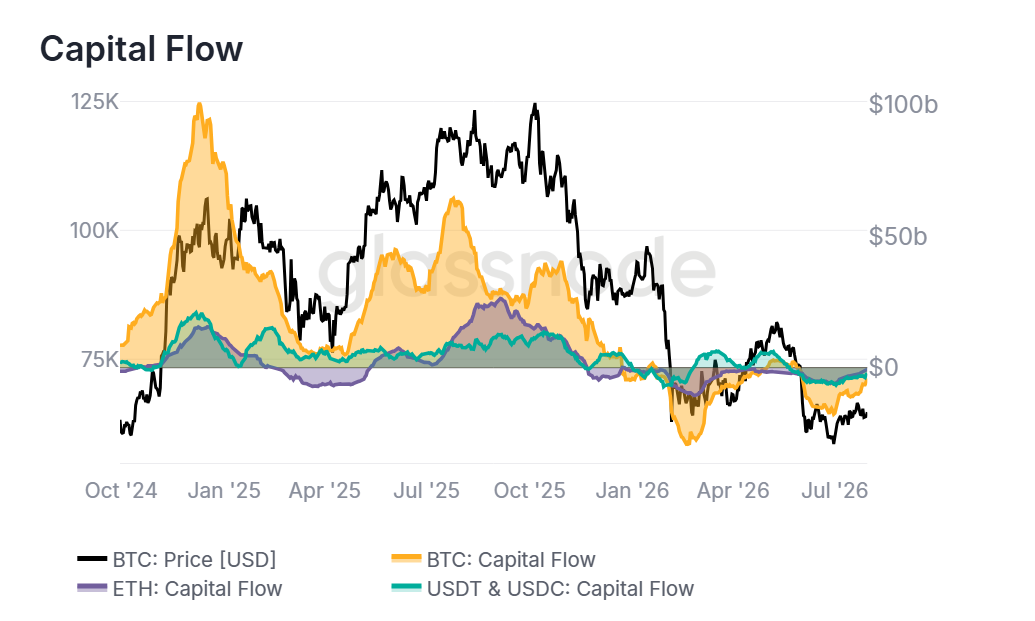
- Net outflows narrowed sharply across BTC, ETH and stablecoins through July, easing June's pressure without yet turning positive.
June's de-risking lost momentum through July. Bitcoin's net capital flow narrowed from -$17.3B at the open to -$4.1B by month-end, while Ethereum improved from -$6.1B to -$0.8B, near neutral by the close. Stablecoins followed the same path, easing from a -$6.6B trough on July 2 to -$2.2B. Every channel stayed negative, so capital was still leaving the ecosystem, but the narrowing suggests the acute phase of institutional de-risking has passed. A turn to sustained inflows would confirm that conviction is returning.
ETF & DAT Net Flows
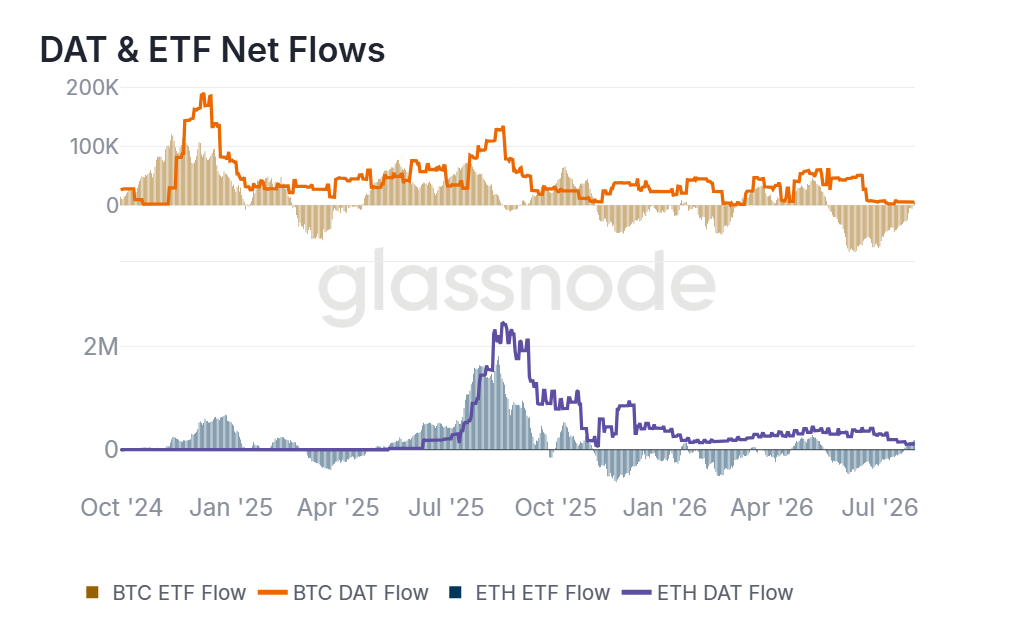
- Spot ETF flows swung back to inflows through July while the treasury bid faded, reversing the roles the two channels played in June.
The channel roles reversed in July. US spot ETFs opened the month at -70.4k BTC and -269.4k ETH before recovering steadily to close at +5.4k BTC and +190.8k ETH, with Ethereum's swing the more decisive. Treasury vehicles stayed positive throughout but cooled: BTC accumulation ranged between +2.3k and +7.6k, while the ETH treasury bid faded from +323.4k early in the month to +88.4k at the close. Regulated demand is returning while balance-sheet buying thins, which points to a healthier mix of institutional flow, though a single month of ETF inflows is not yet a trend.
DeFi TVL
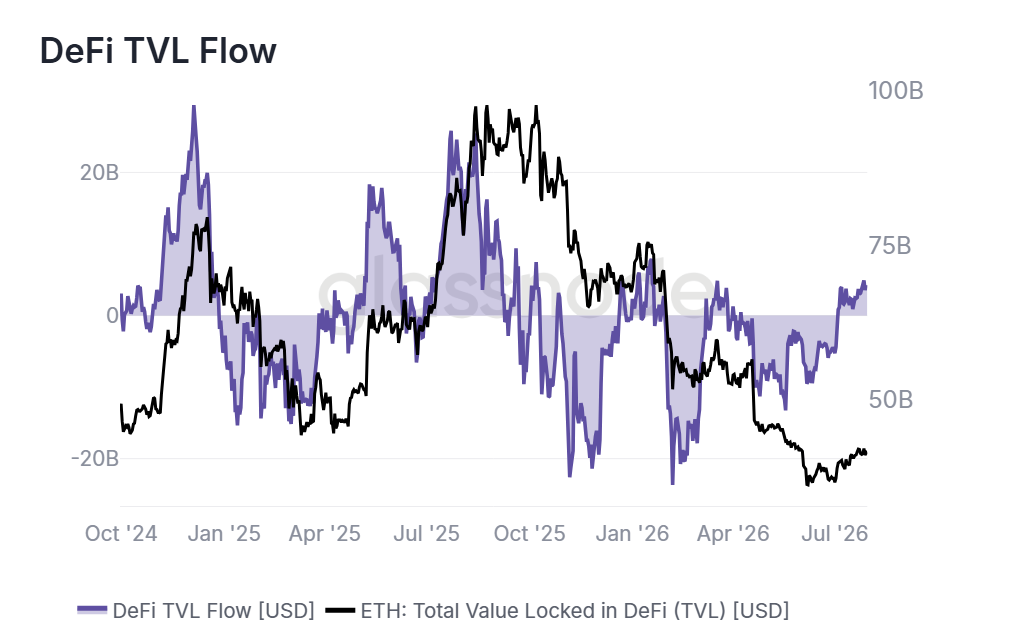
- Ethereum DeFi TVL rebounded through July as net flows flipped positive, reversing June's contraction.
On-chain yield participation recovered in July. Total value locked on Ethereum climbed from $36.6B at the open to $41.1B by month-end, touching $42.1B on July 27, while the 30-day flow rate swung from -$5.3B to +$3.9B and peaked at +$4.9B. Balances rose while the flow measure flipped positive in the first week and held, which suggests genuine capital entry rather than price appreciation alone. One strong month does not prove durability, but the reversal from June's persistent outflows is a clear inflection. Follow-through in August would strengthen the case for returning allocator conviction.
CME Basis Yield
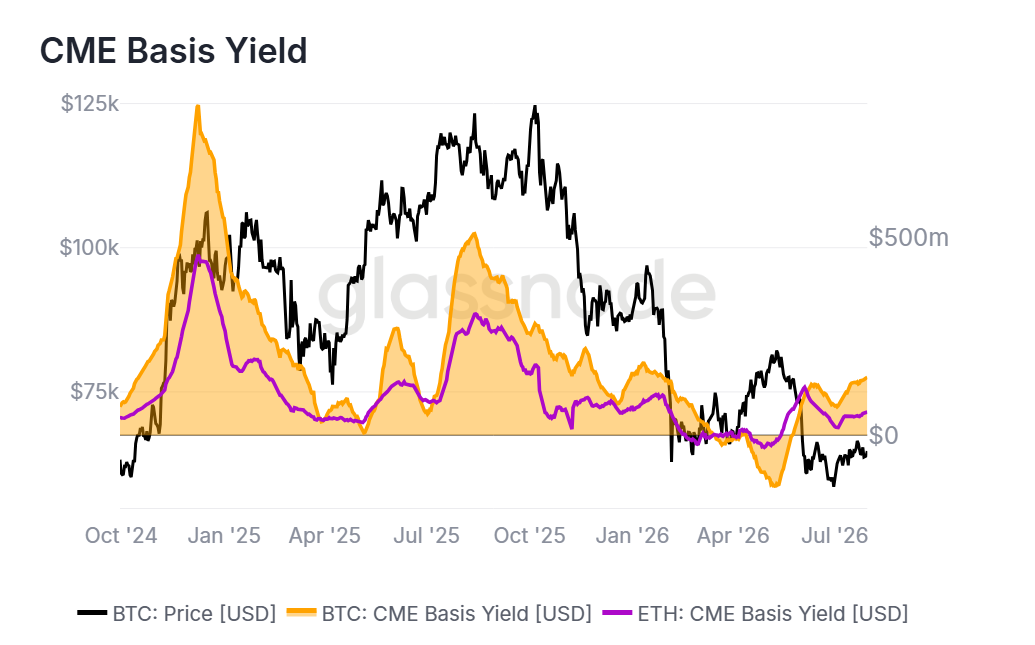
- CME carry rebuilt through July, with the Bitcoin premium roughly doubling and Ethereum recovering from early-month lows.
June's carry compression reversed in July. Bitcoin's 30-day CME basis yield built steadily from $74.0M at the open to a month-end high of $146.0M, while Ethereum's recovered from an early-July low of $18.4M to $58.5M. Widening futures premiums on both assets imply returning leveraged-long demand and a thicker cushion for cash-and-carry strategies. The expansion restores the economic case for market-neutral deployment that had thinned through June, though the speed of the rebuild suggests positioning is doing much of the work. August will show whether it holds.


Disclaimer: This report does not provide any investment advice. All data is provided for information and educational purposes only. No investment decision shall be based on the information provided here and you are solely responsible for your own investment decisions. Exchange balances presented are derived from Glassnode’s comprehensive database of address labels, which are amassed through both officially published exchange information and proprietary clustering algorithms. While we strive to ensure the utmost accuracy in representing exchange balances, it is important to note that these figures might not always encapsulate the entirety of an exchange’s reserves, particularly when exchanges refrain from disclosing their official addresses. We urge users to exercise caution and discretion when utilizing these metrics. Glassnode shall not be held responsible for any discrepancies or potential inaccuracies. Please read our Transparency Notice when using exchange data.
