BTC Market Pulse: Week 41
Bitcoin trades near $86k after a Sunday rally lifted the weekly close about 2% higher. Derivatives positioning eased back into its normal range and ETF inflows cooled, while on-chain activity, new capital and profit-taking all run hot.



Overview
Bitcoin trades near $86k on Monday, in the upper part of the range it has held for two weeks, after a Sunday rally lifted the weekly close about 2% above the previous one. The positioning built around the breakout two weeks ago has eased. Futures open interest sits back inside its range, near its upper edge, and options open interest dropped back after the quarterly expiry. The heavy selling in perpetual futures that marked last Monday's dip has faded.
Spot and ETF demand tell a quieter story. Spot takers ended the week as net buyers and momentum eased back inside its range. ETF demand cooled after last week's surge: weekly netflow is still positive but far smaller and trading volume sits near its low band, while ETF MVRV moved above its high band, so the average ETF holder carries an unusually large profit.
On-chain, activity picked up across the board. Active addresses and fees joined transfer volume above their high bands, and new money keeps arriving: the monthly change in realized cap stays far above its band and the hot capital share climbed further above its own. The ratio of short-term to long-term holder supply also rose, into the upper part of its range.
Profitability stays stretched. Close to three quarters of supply is in profit, and both short-term holder unrealized gains and realized profit-taking remain well above their high bands. In short, price held its gains as derivatives positioning eased and ETF demand cooled, while on-chain activity, new capital and profit-taking all run hot.
Off-Chain Indicators
Read every off-chain indicator
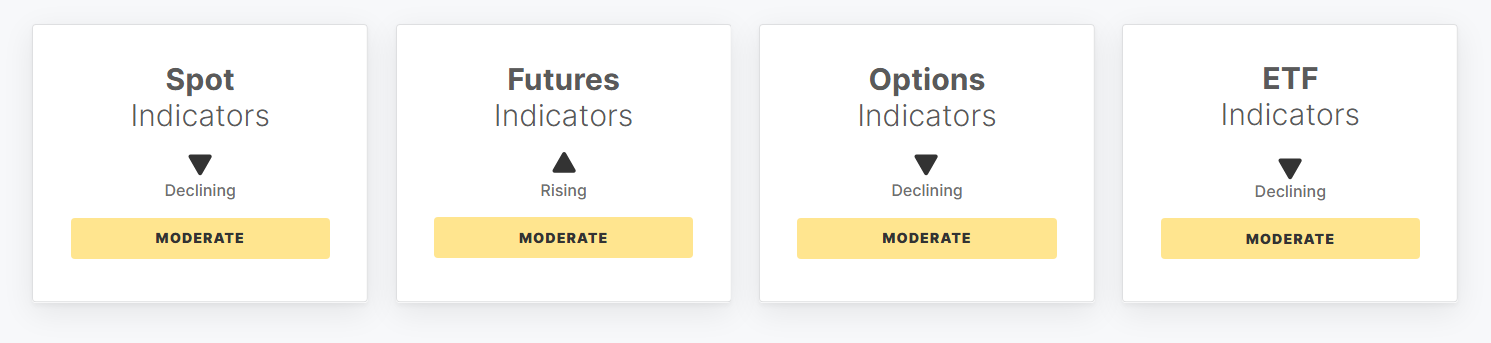
Spot Indicators
Price Momentum. Decreased from 68.2 to 68.0, marking a 0.3% change over the past seven days. Price Momentum shows growing buyer dominance is cooling slightly as the metric eases within the upper part of its statistical range. This behavior reflects a moderation in aggressive upward momentum without signaling an immediate trend reversal or structural exhaustion.
Spot CVD. Increased from -$102.8M to $33.2M, representing a 132.3% change over the past week. Spot CVD highlights a notable shift in aggressive trader behavior as cumulative taker flows flip from net selling into positive territory. This transition leaves the metric well inside its range, indicating a recovery in short-term buyer conviction and shifting market sentiment away from aggressive distribution.
Spot Volume. Decreased from $6.0B to $5.9B, reflecting a 2.0% change over the observed period. Spot Volume exhibits a modest contraction in total daily trading activity on centralized exchanges, remaining securely positioned inside its established range. This level of liquidity suggests that recent price action is unfolding without heightened participation.
Futures Indicators
Futures Open Interest. Decreased by 3.8% from $38.0B to $36.6B over the week. Futures Open Interest dropped moderately as speculative appetite cooled and market participants unwound active positions. The metric currently sits near the high band, indicating that overall leverage remains elevated despite the minor weekly contraction in aggregate nominal contract value across exchanges.
Long-Side Funding Payment. Increased by 57.3% from $926.4K to $1.5M over the week. Long-Side Funding Payment surged significantly, reflecting a notable rise in perpetual market demand for bullish exposure as leveraged traders willingly pay a larger premium. The metric remains well inside its statistical boundaries, pointing to a steady sentiment gauge without triggering extreme structural imbalances.
Perpetual CVD. Increased by 90.7% from -$940.1M to -$87.4M over the week. Perpetual CVD advanced substantially toward neutrality, mirroring a marked reduction in aggressive sell-side pressure from aggressive market takers. This trajectory brings the value back inside its range from below its low band, as aggressive buyers absorb lingering distribution.
Options Indicators
Options Open Interest. Decreased from $42.2B to $36.0B following a 14.7% drop, signaling position closures across the market. Options Open Interest contracted significantly, bringing total notional exposure down to roughly $36B as the quarterly expiry rolled through the weekly average. This reading falls back inside its established historical boundaries from above its high band, pointing to a scheduled reset in positioning rather than any systemic market stress.
Volatility Spread. Increased from -11.1% to -8.2% through a 25.97% rise as realized volatility eased toward implied. Volatility Spread narrowed as realized volatility eased toward the level implied by options. The metric remains positioned well within its statistical bands, suggesting that options still price future swings below realized volatility, though by less than before, which reflects normal expectations for near-term market behavior.
Options 25-Delta Skew. Decreased from 2.5% to 2.1% with a 17.3% drop, reflecting lower demand for downside protection. Options 25-Delta Skew declined over the period, showing a relaxation in downside hedging pressure as market participants scaled back their purchases of out-of-the-money puts. The metric currently sits comfortably inside its statistical range, indicating a neutral sentiment bias where neither calls nor puts dominate the structural demand.
ETF Indicators
US Spot ETF Netflow (Weekly). Decreased 87.7% over the week to a latest level of $208.1M. US Spot ETF Netflow (Weekly) demonstrates a notable deceleration in fresh capital deployment from institutional participants, as the reading falls back inside its historical band from above its high band. This contraction highlights a cooling phase in TradFi demand and reduced urgency for capital allocation through regulated spot products.
US Spot ETF Trade Volume (Weekly). Decreased 11.8% over the week, settling at a total volume of $10.8B. US Spot ETF Trade Volume (Weekly) dropped to just above its low band, indicating subdued trading engagement and a temporary pause in speculative market reactions. Such contraction points to a consolidation phase among institutional participants as immediate activity levels moderate across regulated investment channels.
US Spot ETF MVRV. Increased 3.8% over the week to reach a current value of 1.5. US Spot ETF MVRV reflects a rising unrealized profit margin for institutional holders as the reading moves just above its high band. This behavior signals stable investor confidence without triggering aggressive profit-taking tendencies across traditional finance channels.
On-Chain Indicators
Read every on-chain indicator
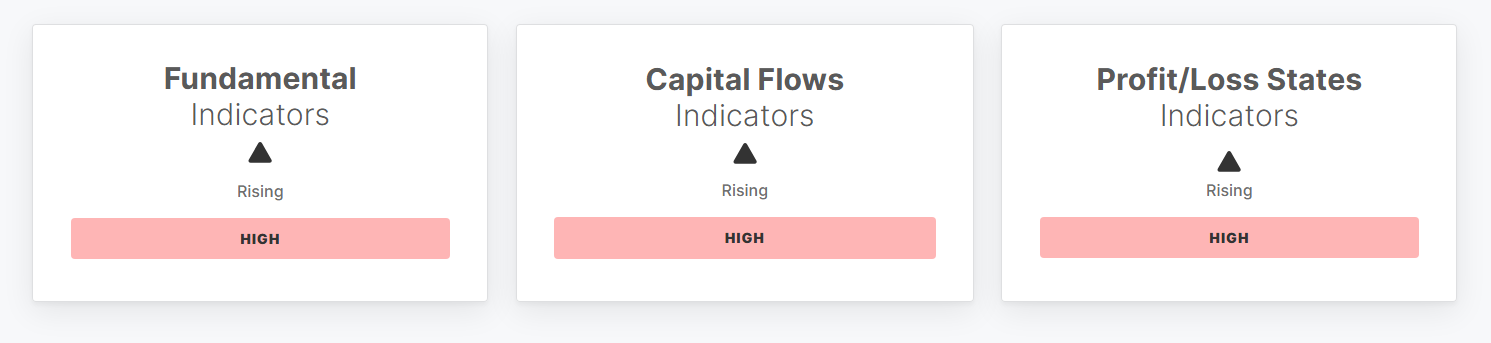
Fundamental Indicators
Total Fee Volume. Increased by 7.3% over the week to reach $269.6K, up from $251.2K 7 days ago. Total Fee Volume edged just above its high band, indicating strong demand for block space typically associated with heightened on chain activity, congestion, or bullish market phases.
Entity-Adjusted Transfer Volume. Increased by 2.4% over the week to reach $6.7B, up from $6.6B 7 days ago. Entity-Adjusted Transfer Volume climbed higher while remaining comfortably above its high band, pointing to increased capital movement and elevated investor activity often observed during speculative phases or large scale reallocations.
Daily Active Address Count. Increased by 6.1% over the week to reach 675.8K, up from 636.8K 7 days ago. Daily Active Address Count rose as the indicator moved above its high band, signaling growing user participation, adoption, or market engagement on the network.
Capital Flows Indicators
Realized Cap Change (Monthly). Increased by 1.4% over the week to reach 1.1% compared to 1.1% seven days prior. Realized Cap Change (Monthly) advanced modestly, reflecting sustained expansion in network valuation. This indicator trades above its high band, pointing to net capital inflows as coins are acquired at elevated prices, typically observed during robust bull markets and active accumulation phases.
STH to LTH Supply Ratio. Increased by 4.2% over the week to reach 14.2% compared to 13.7% seven days prior. STH to LTH Supply Ratio expanded as newer participants increased their market footprint. The metric sits in the upper part of its range, implying a growing presence of reactive market participants linked to elevated trading activity and speculative churn within the holder base.
Hot Capital Share. Increased by 3.1% over the week to reach 19.5% compared to 18.9% seven days prior. Hot Capital Share rose as fresh capital entered the network. The reading sits well above its high band, signaling an influx of short term and price sensitive capital, often during rapid market rallies or speculative phases that heighten volatility sensitivity.
Profit/Loss States Indicators
Percent Supply in Profit. Increased from 73.0% to 73.6% over the week, marking a 0.8% rise in circulating supply profitability. Percent Supply in Profit ticked slightly higher as a greater proportion of the circulating supply moved into unrealized profit territory. This indicator remains well above its high band, reflecting widespread profitability.
Net Unrealized Profit to Loss Ratio. Decreased from 13.6% to 12.8% over the week, a 5.9% decline in net unrealized profitability. Net Unrealized Profit to Loss Ratio drifted downward as the aggregate unrealized gains of short-term holders contracted. The reading currently sits above its high band, maintaining an elevated profit margin backdrop where the average short-term holder remains comfortably in profit without showing signs of systemic stress.
Realized Profit to Loss Ratio. Increased from 1.2 to 1.3 over the week, representing a 6.6% growth in realized profitability. Realized Profit to Loss Ratio expanded as realized profit dominance over realized losses widened on-chain. The metric resides above its high band, indicating that profit taking significantly outweighs loss realization, which typically aligns with active market rallies and robust spending behavior among investors.
🔗 Access the full report in PDF

- Follow us and reach out on X
- Join our Telegram channel
- For on-chain metrics, dashboards, and alerts, visit Glassnode Studio
Disclaimer: This report does not provide any investment advice. All data is provided for information and educational purposes only. No investment decision shall be based on the information provided here and you are solely responsible for your own investment decisions.
Exchange balances presented are derived from Glassnode’s comprehensive database of address labels, which are amassed through both officially published exchange information and proprietary clustering algorithms. While we strive to ensure the utmost accuracy in representing exchange balances, it is important to note that these figures might not always encapsulate the entirety of an exchange’s reserves, particularly when exchanges refrain from disclosing their official addresses. We urge users to exercise caution and discretion when utilizing these metrics. Glassnode shall not be held responsible for any discrepancies or potential inaccuracies.
Please read our Transparency Notice when using exchange data.
