Trigger Happy
Bitcoin is wound tight between converging cost-basis levels on the quietest tape since 2019. Sellers are tiring and buyers are absent, yet leverage has already pulled the trigger on a recovery the data does not yet support.


Executive Summary
- July core inflation printed 2.5%, equities sit at records, and Bitcoin still faded. A weak response to good news is itself a warning.
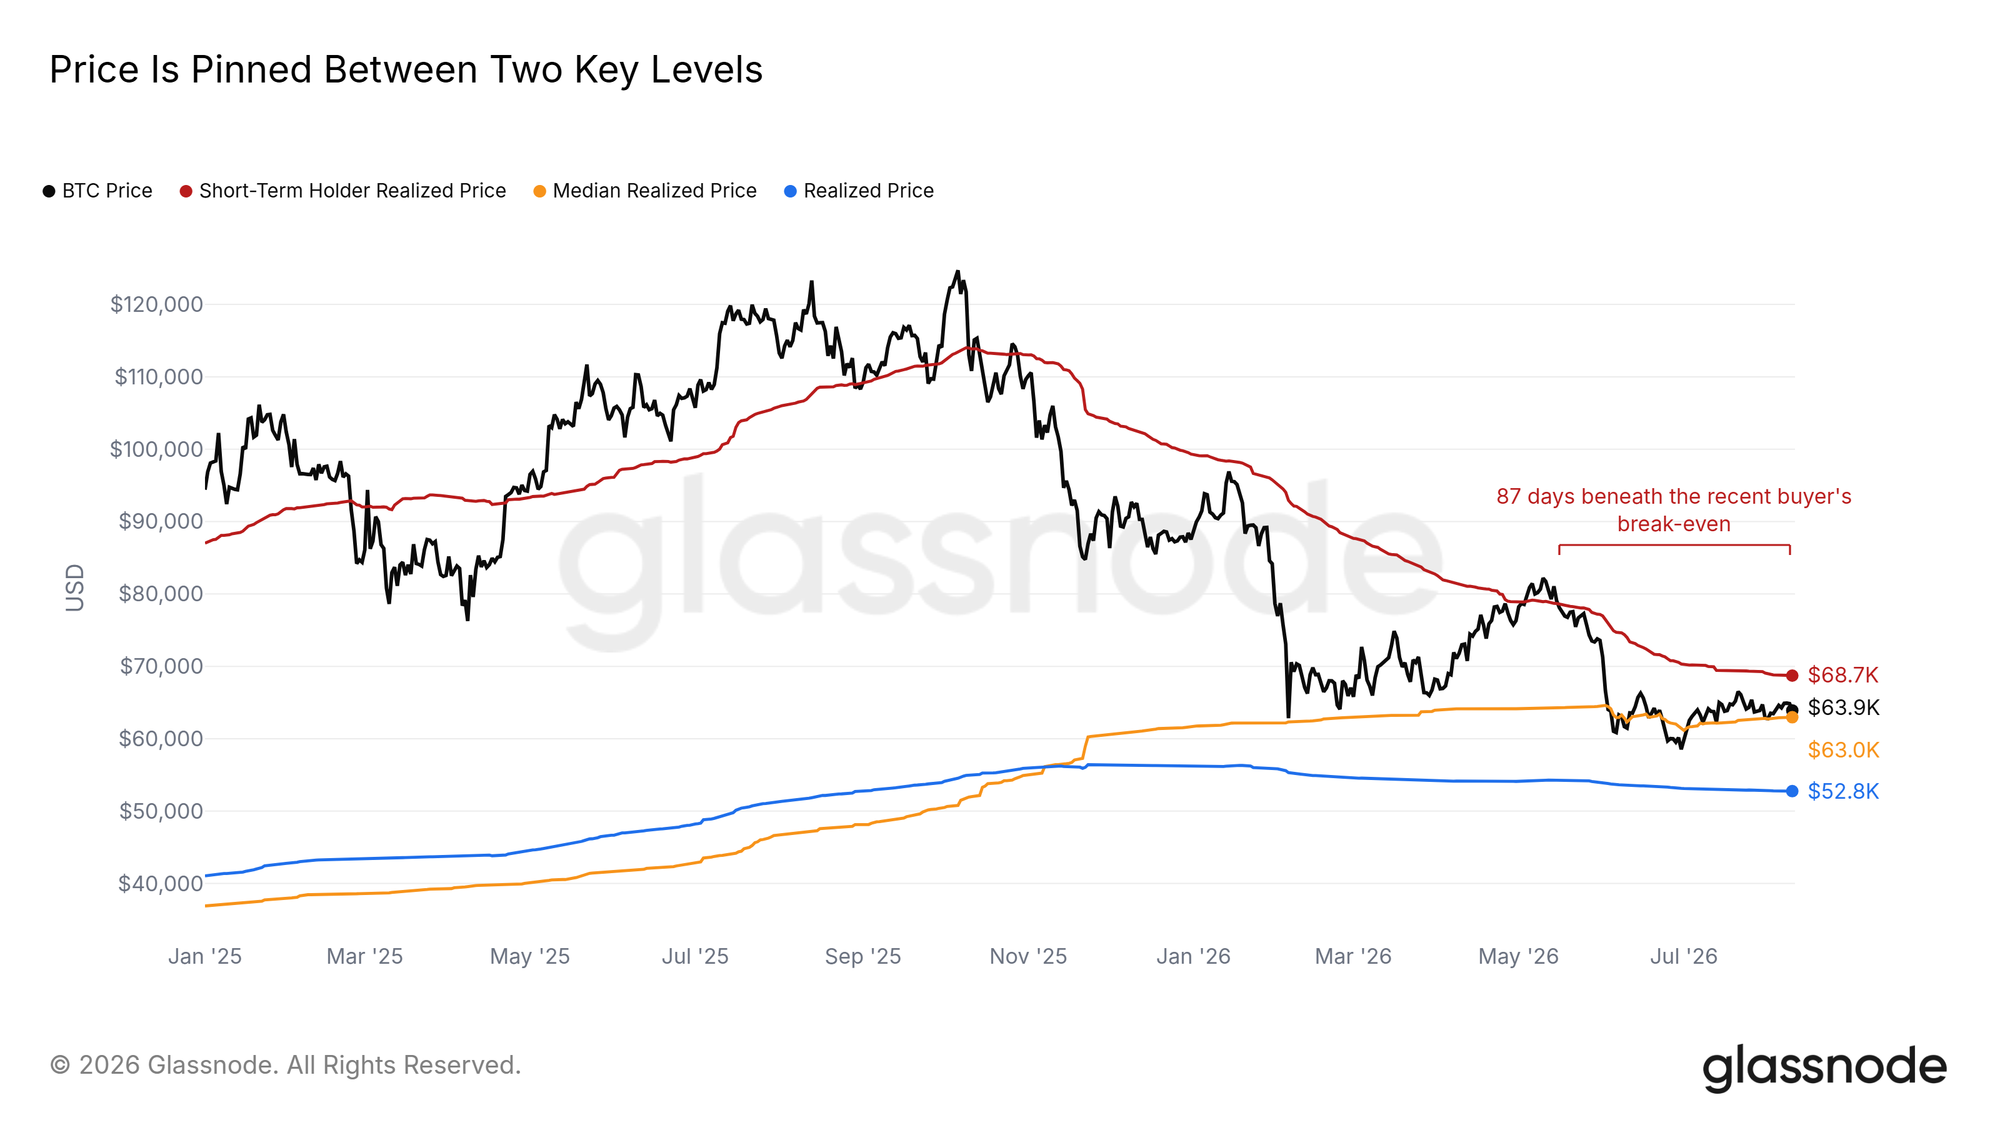
- Price is wedged between the Median Realized Price at $63.0K and the Short-Term Holder Cost Basis at $68.7K, on the lowest spot volume since 2019.
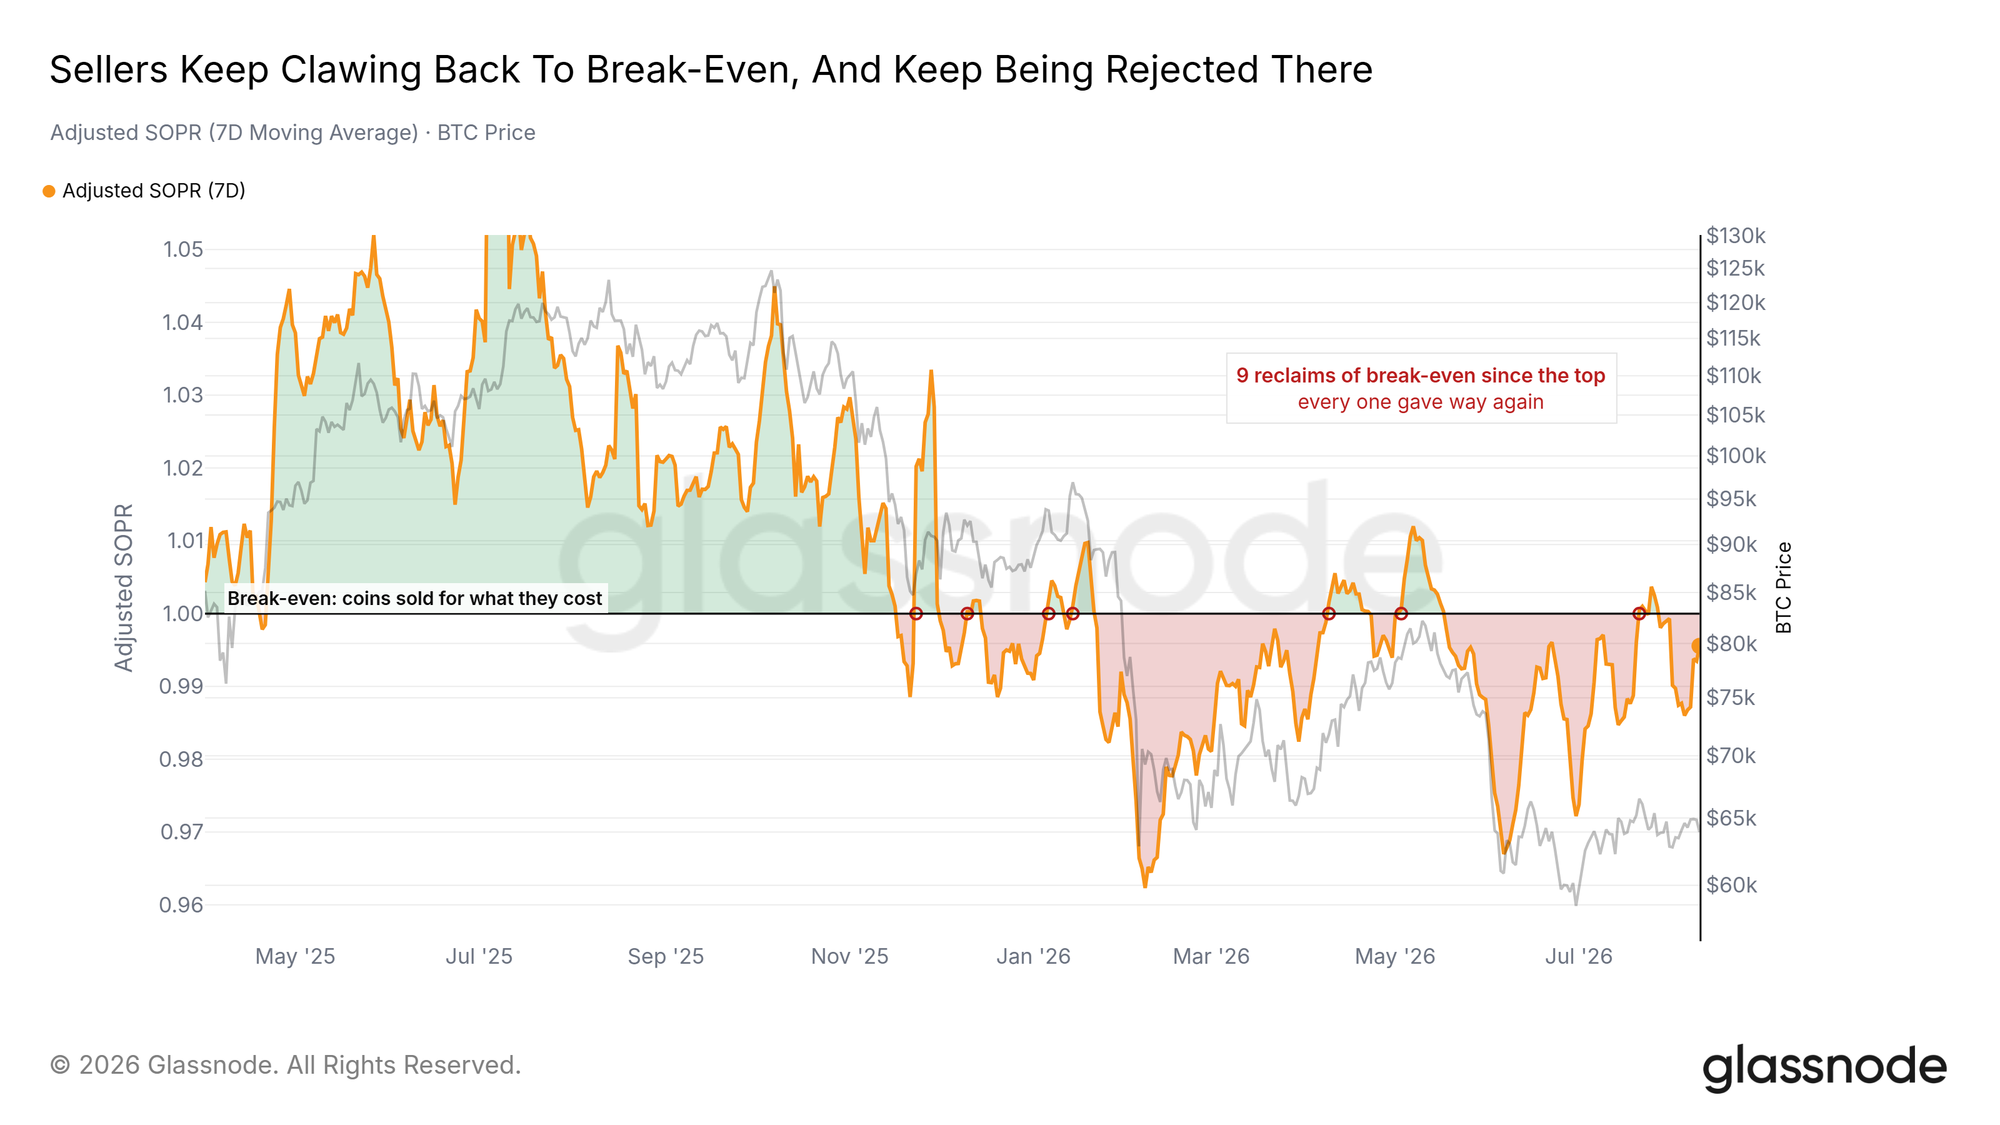
- Sellers are tiring: supply in profit sits near past bear-floor territory, and break-even has rejected nine recovery attempts.
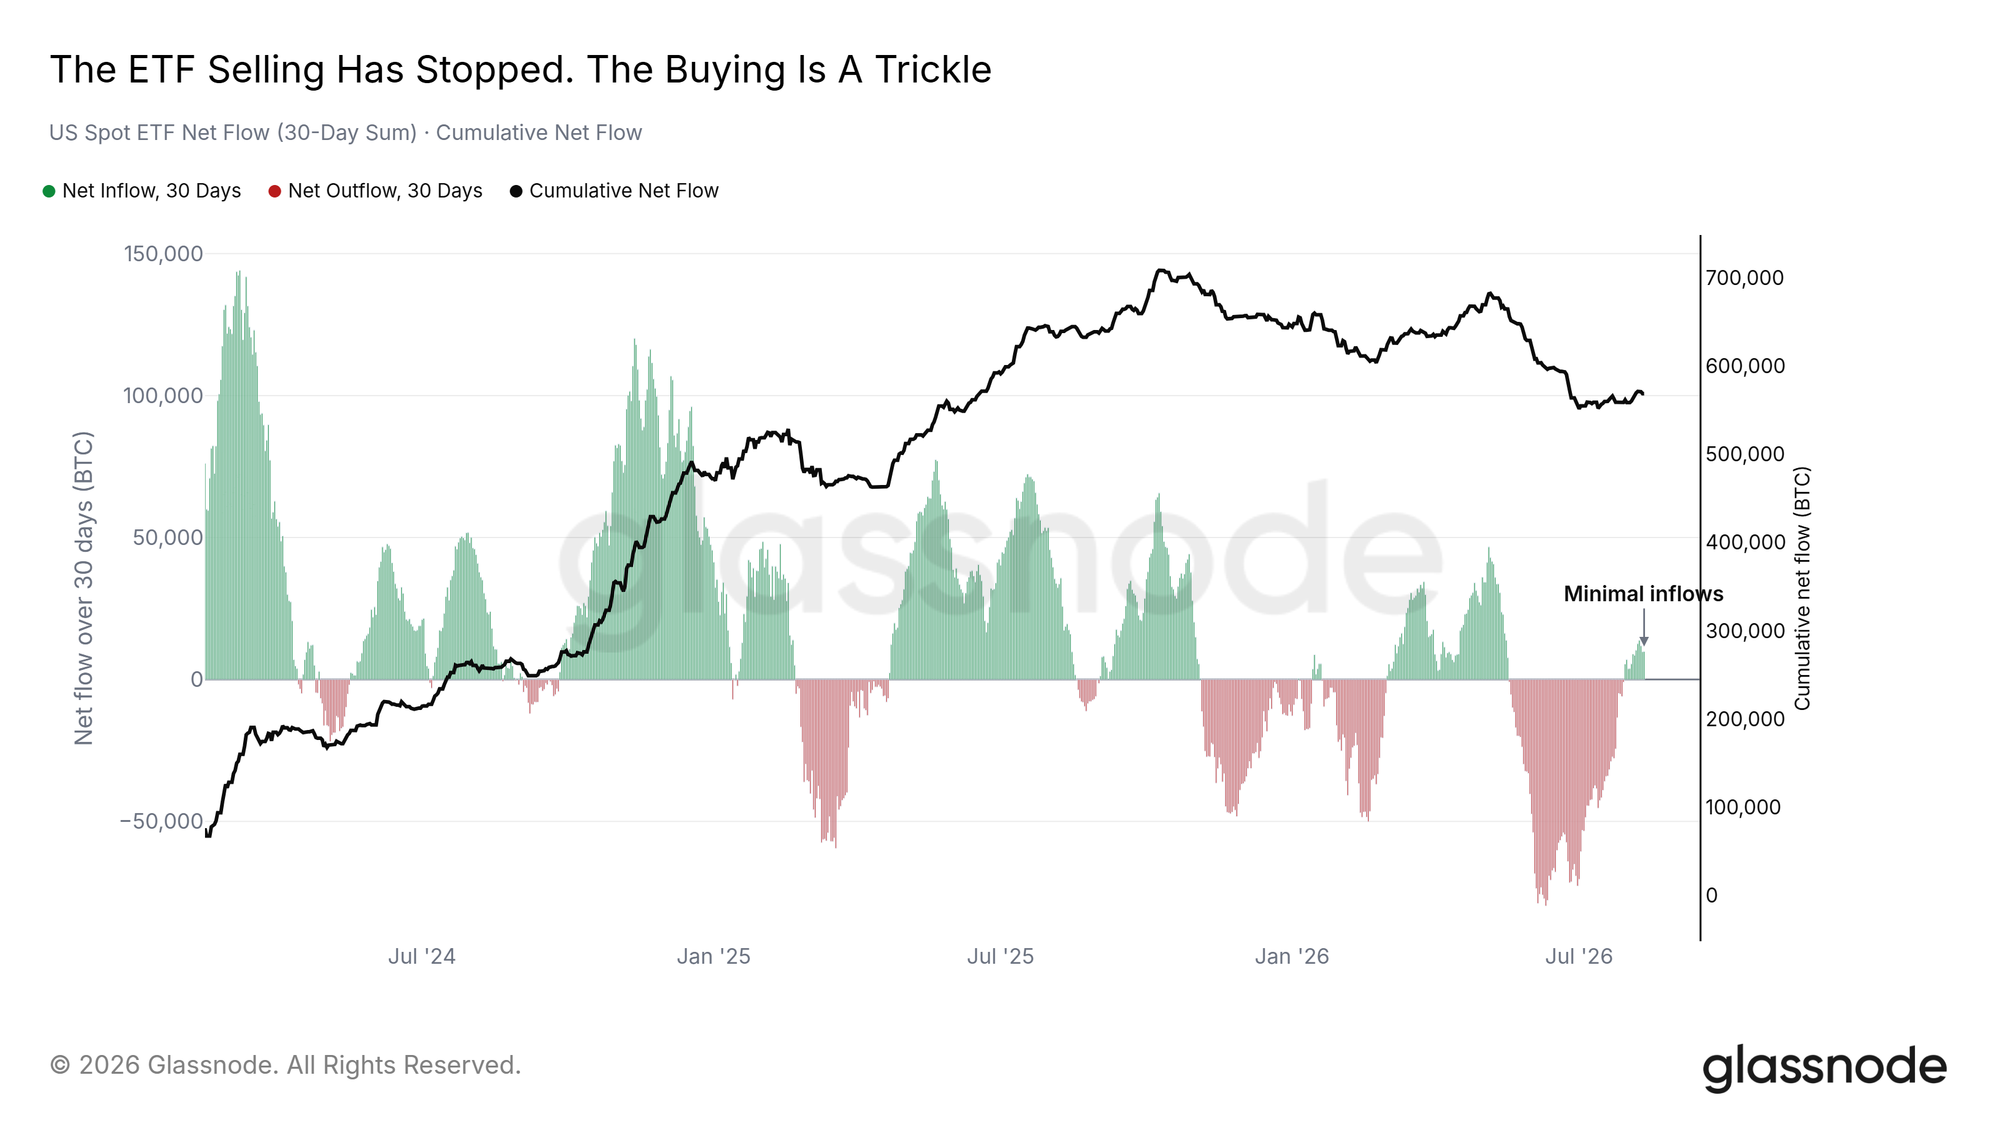
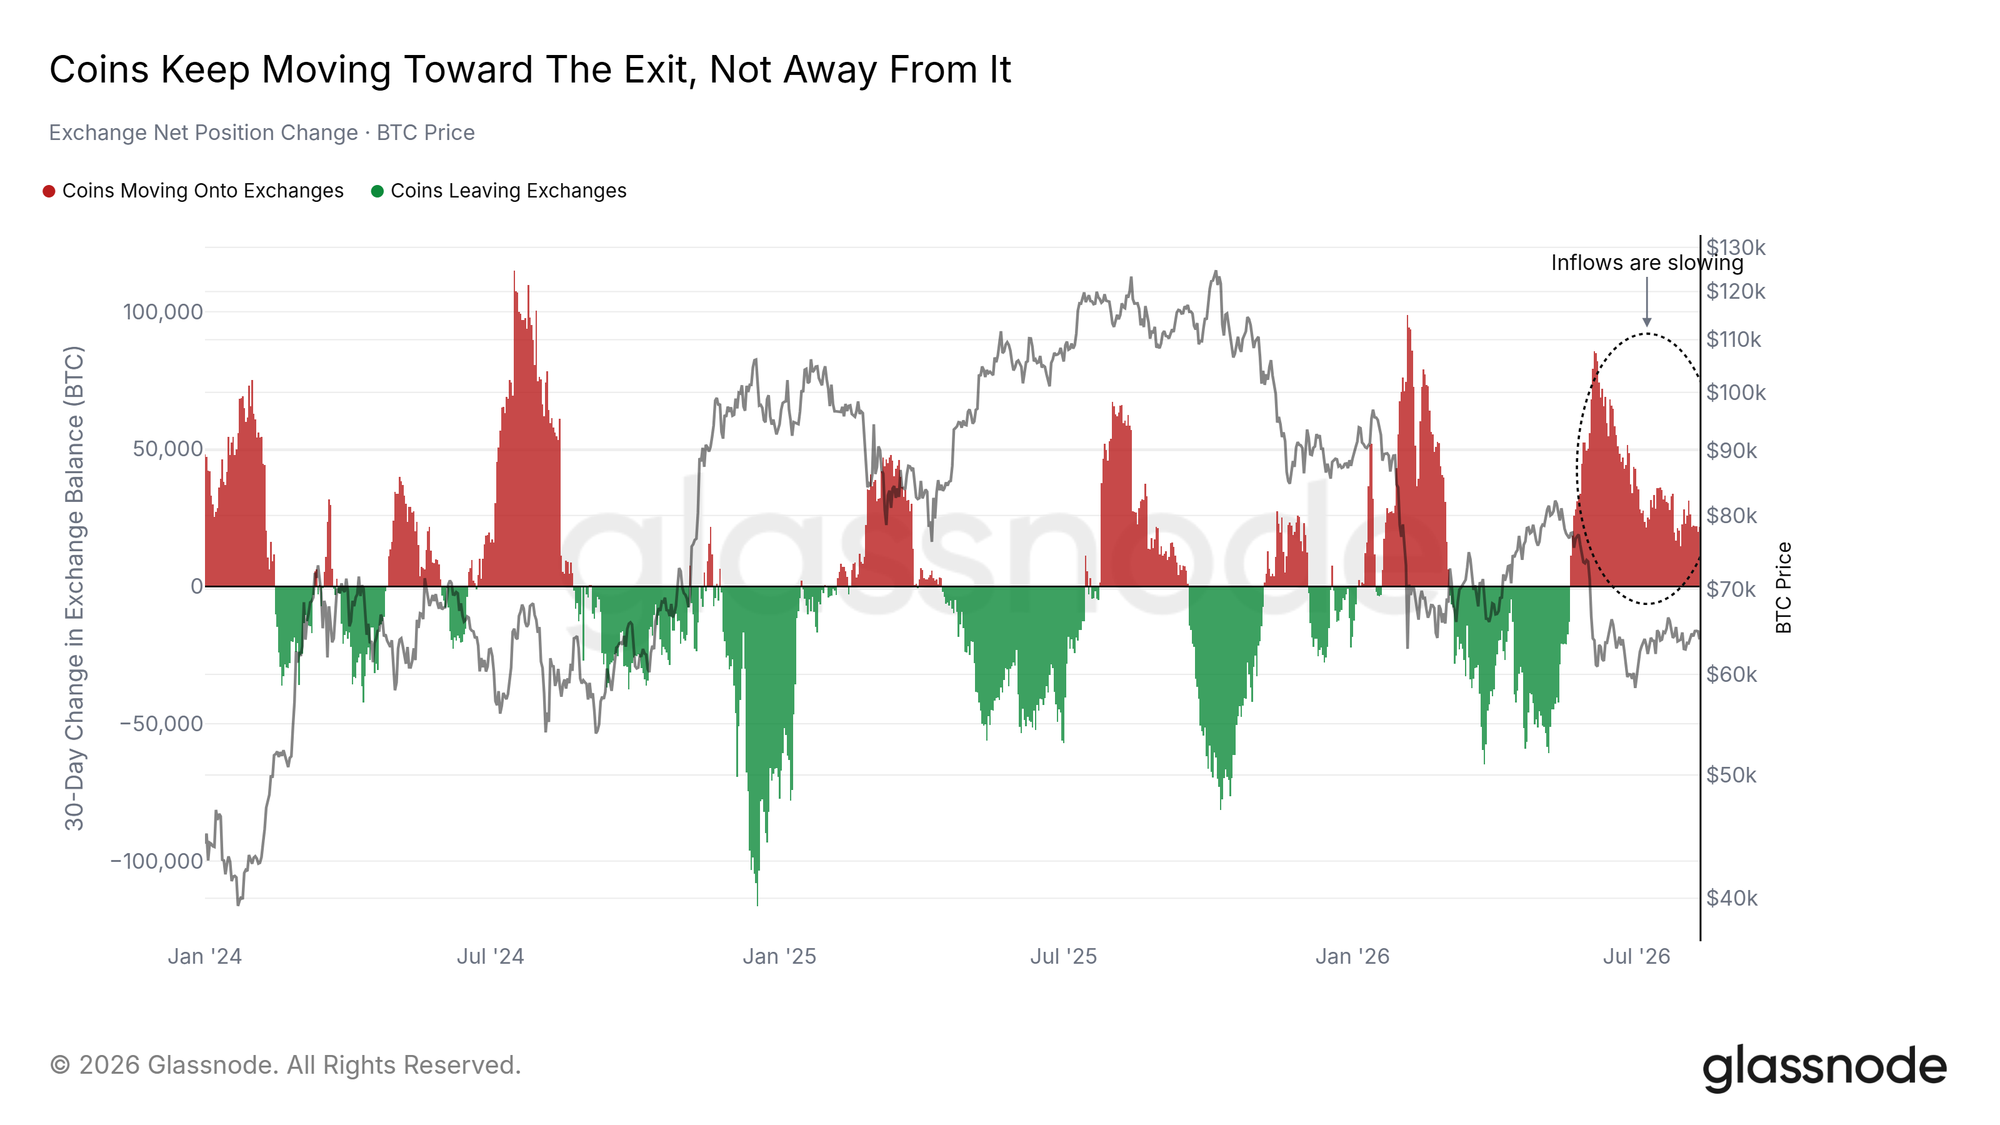
- Buyers are missing: ETF inflows are minimal, and coins keep landing on exchanges.
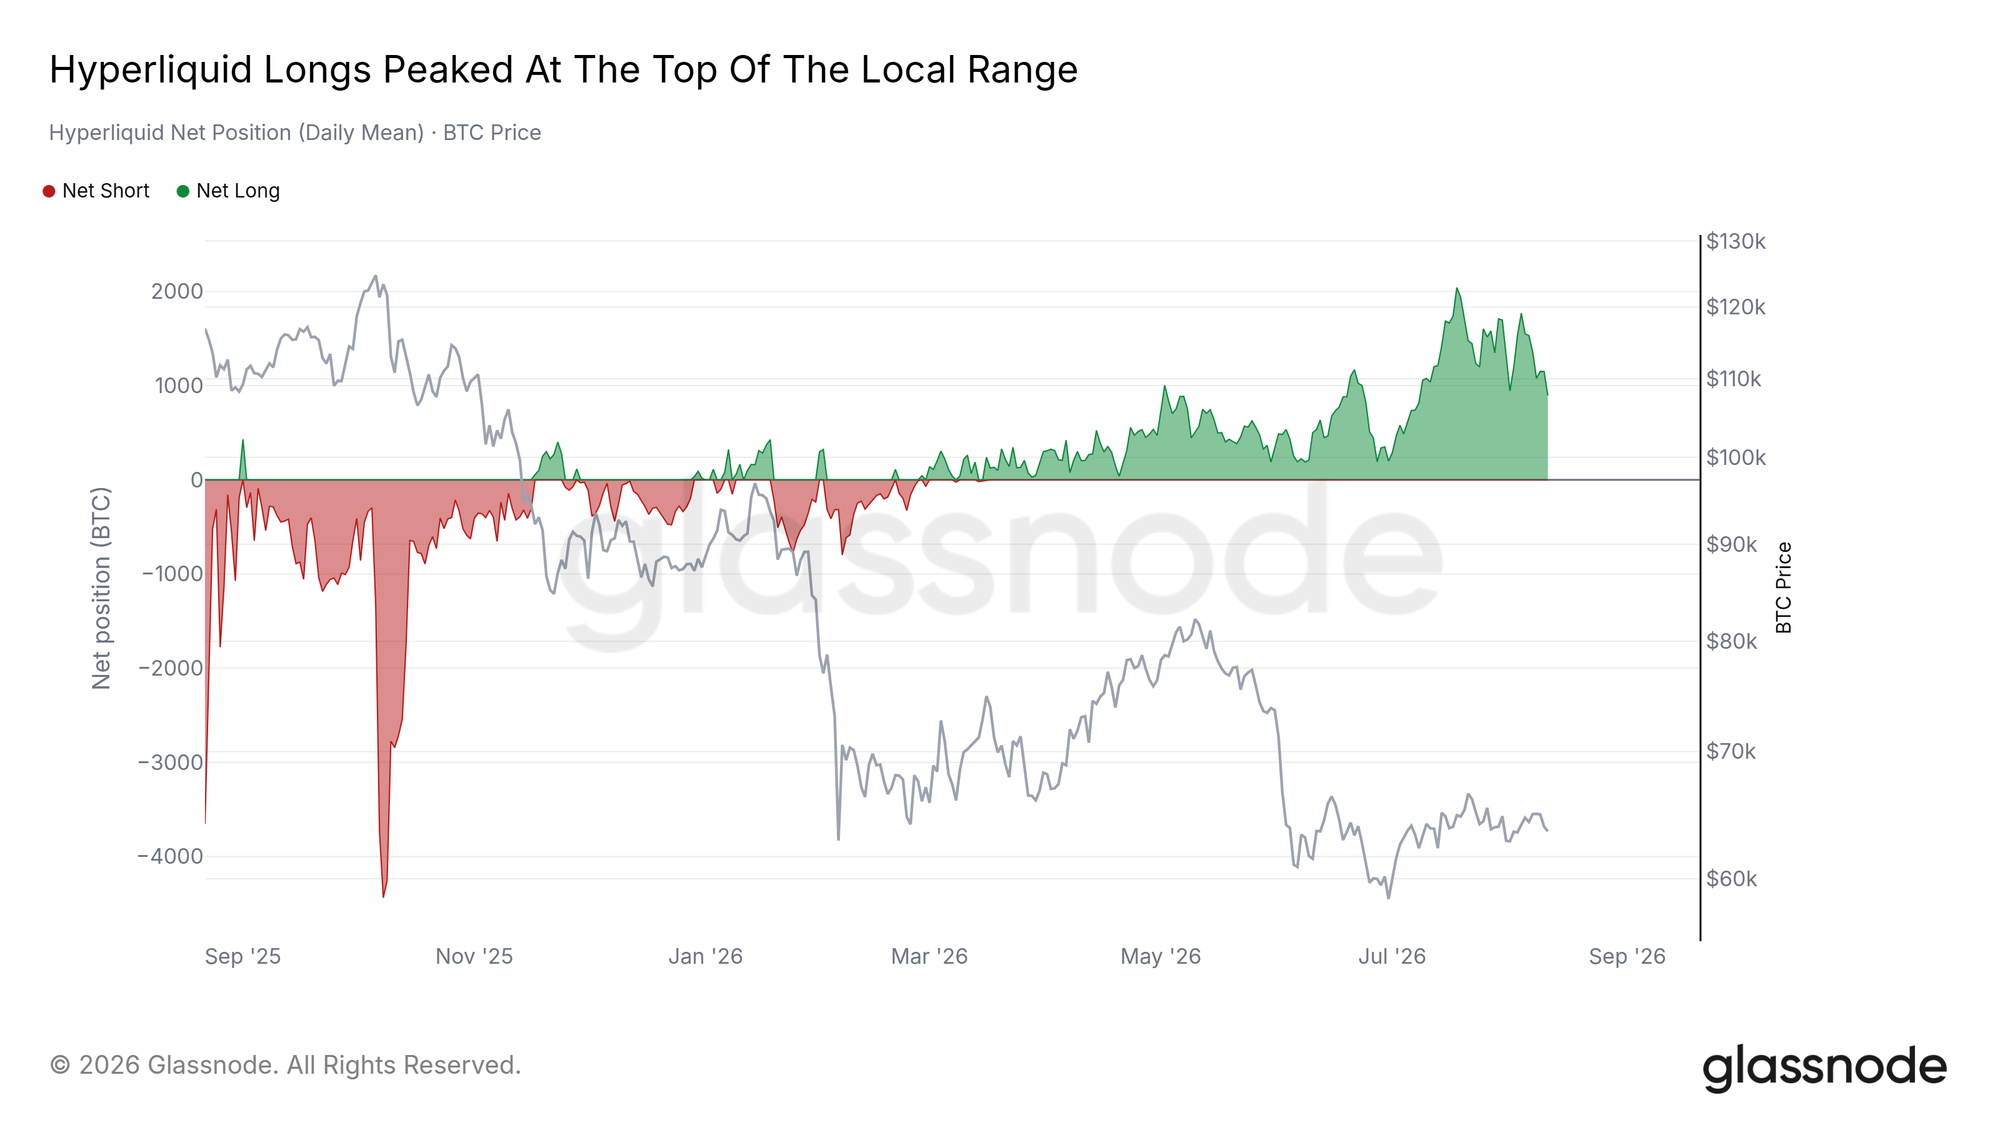
- Leverage is crowded long above a thinning bid. Watch $68.7K overhead and $58.5K below.
Ready to get ahead of markets and sharpen your foresight? Try Glassnode. Sign up or talk to sales.
Good News Goes Unrewarded
Inflation Steady, Market Unmoved
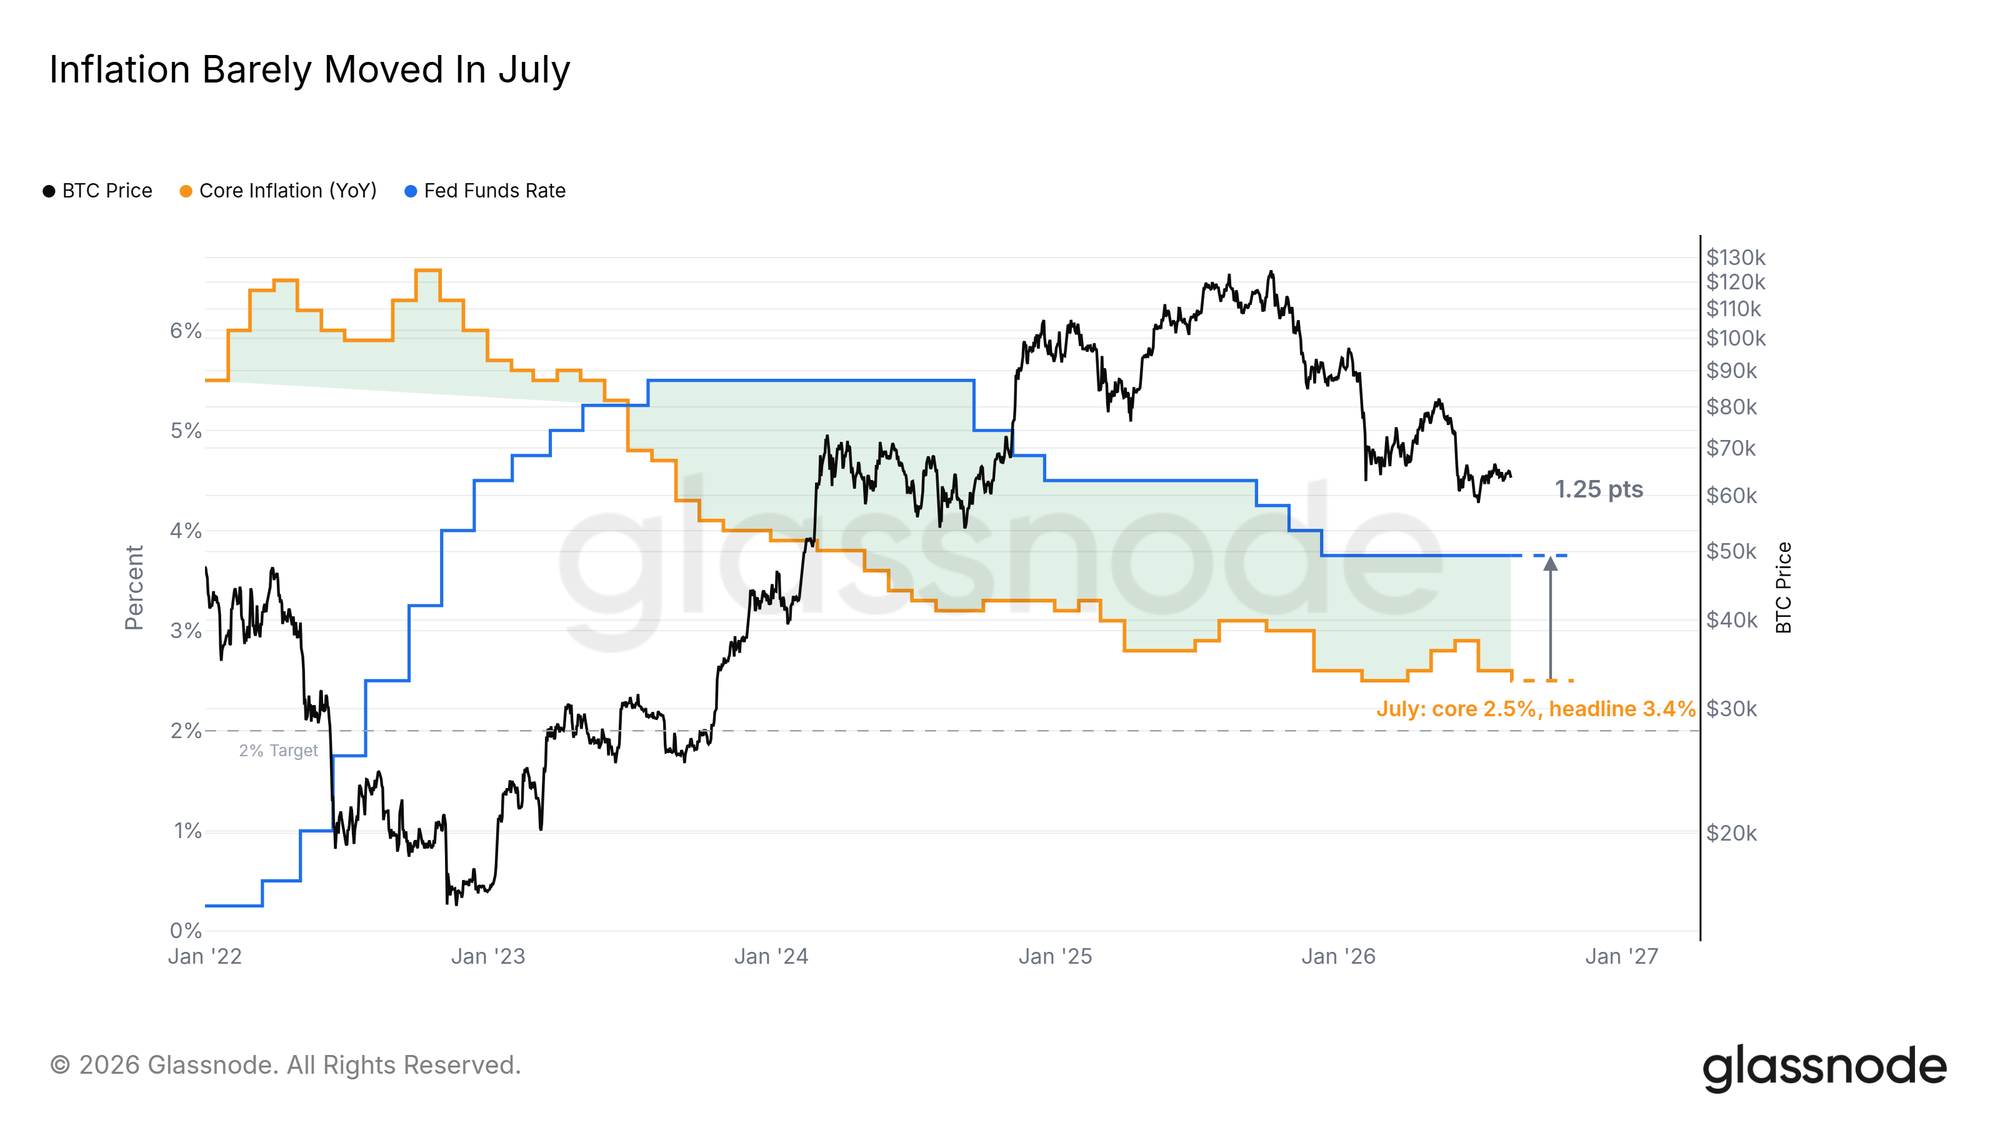
July's CPI, released this morning, changed almost nothing: core inflation eased a tenth to 2.5%, and the headline rate was flat. This morning's release is drawn onto the chart as a dashed continuation of the series. Policy remains static. The Effective Fed Funds Rate has been parked since December and still sits more than a full point above core inflation, so real rates stay restrictive and the gap narrows only as inflation drifts lower.
The response worries us more than the release. In the hours since the print, Bitcoin has barely bounced and equities have slipped. Flat inflation with policy on hold is a benign backdrop, and a healthy market would have treated it as one. If price cannot build on this news over the coming sessions, we would read that as confirmation that demand remains absent. The same concern applies to equities.
The Flight Into Assets
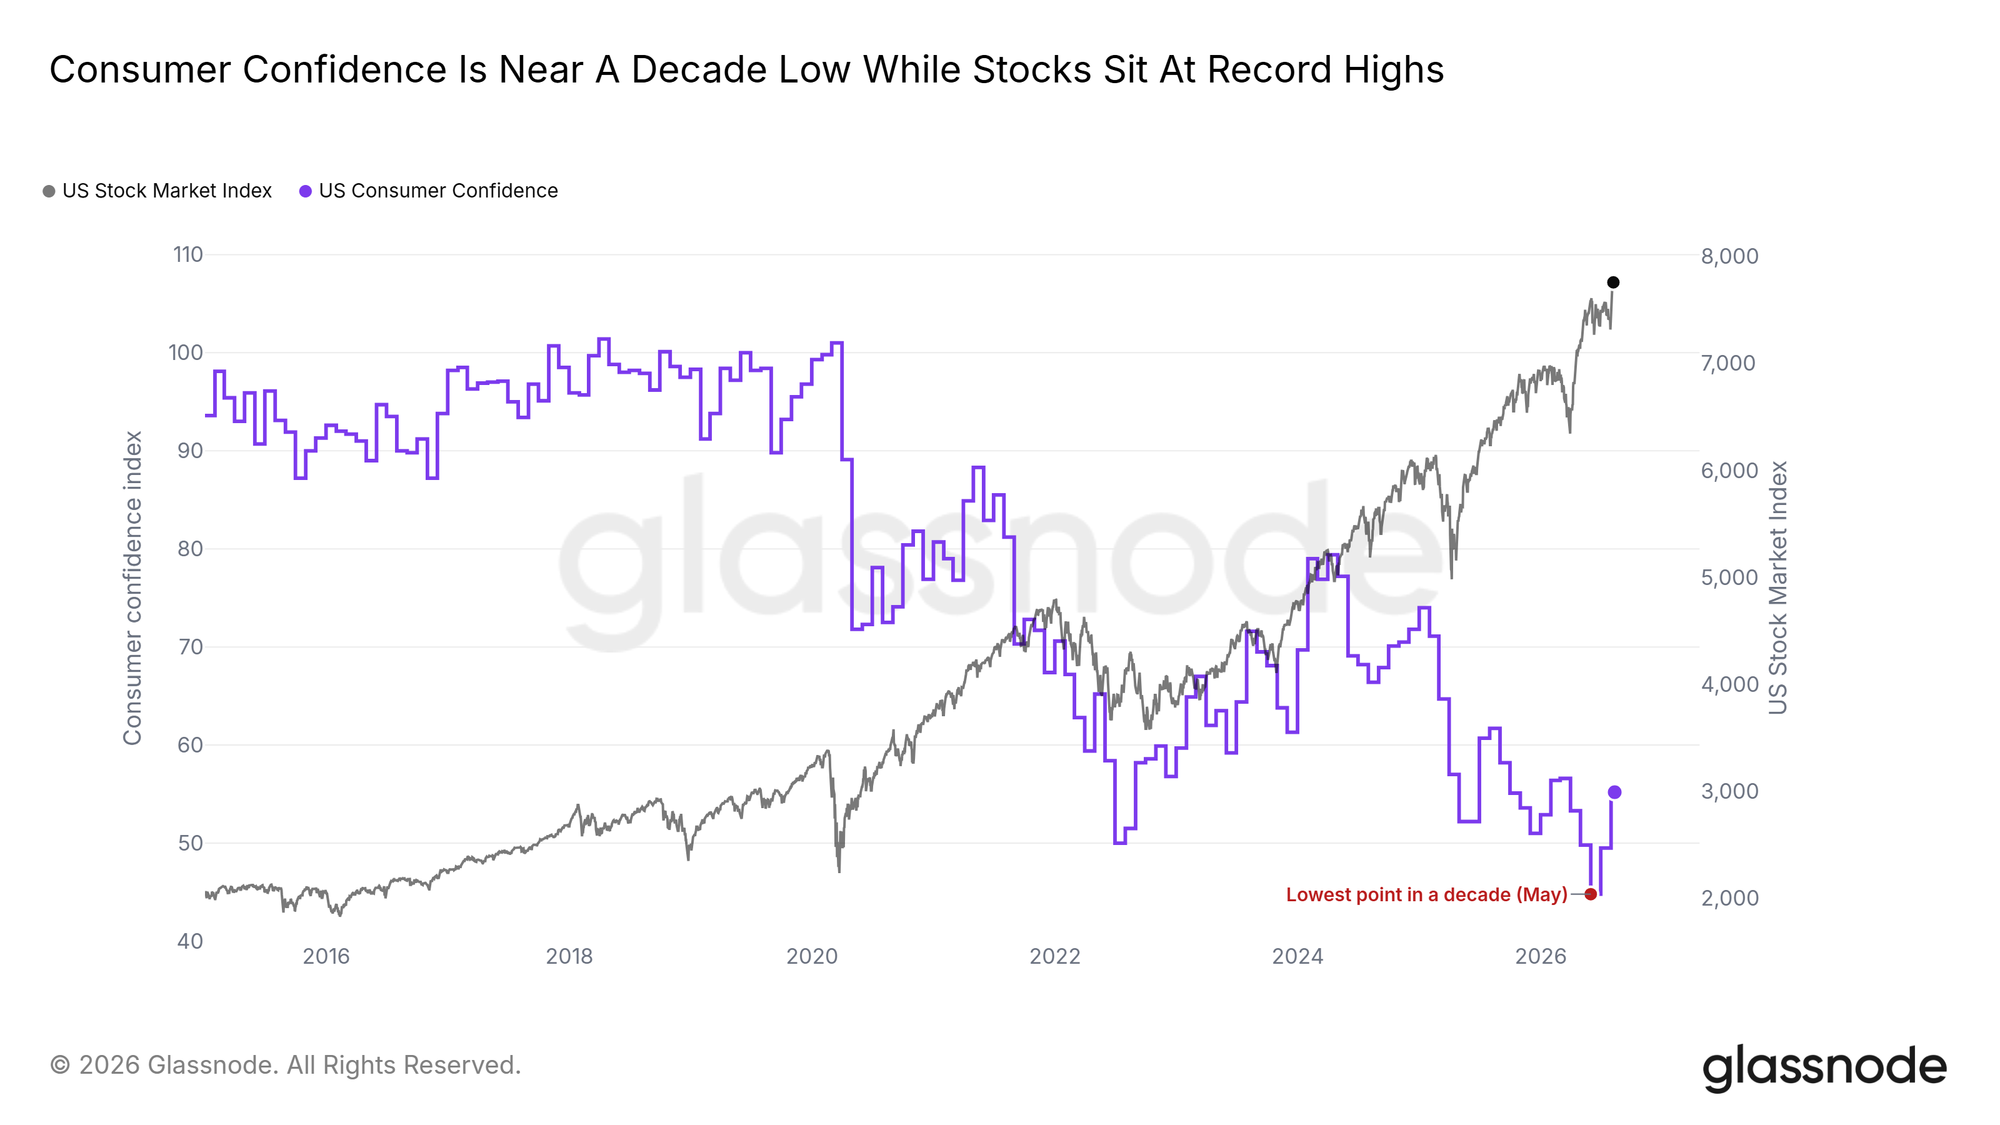
Consumer Confidence remains among the weakest readings of the past decade even after two consecutive improvements, while the US Stock Market Index set a fresh all-time high on August 7 and holds just beneath it. Weak sentiment next to record prices looks like a contradiction until the driver is named: households that expect living costs to rise and the economy to soften are moving out of cash and into assets. The equity market, carried above all by the AI trade, is where that capital lands.
Bitcoin has been left out of the rotation. Spot changes hands at roughly half the October 2025 peak and has lagged the equity tape all summer, even though the case for Bitcoin has always leaned on exactly this kind of flight into scarce assets. The money is chasing what already moves, and until some of that flow returns, record equities offer Bitcoin little support. A turn would show first in ETF flows, and the flows section below finds no sign of one yet.
A Market Wound Tight
Pinned Between Two Levels
The cost-basis ladder frames the stalemate. Spot sits just above the Median Realized Price at $63.0K, the level that splits every coin's cost basis down the middle, and below the Short-Term Holder Cost Basis at $68.7K, the average entry of the market's most recent buyers. That cohort is underwater, which historically makes it quick to sell into recoveries, while the median level has absorbed every test from above for more than a month.
Price has spent nearly three months in this pocket, and the two levels keep converging as volatility compresses. Deeper down, the aggregate Realized Price near $52.8K shows the average coin still holds a healthy profit, so the broad market has never been forced into loss this cycle. A sustained reclaim of $68.7K would flip recent buyers back into profit and open the first real test of overhead supply; losing the median would leave little structure before the June lows.
The Quietest Tape Since 2019
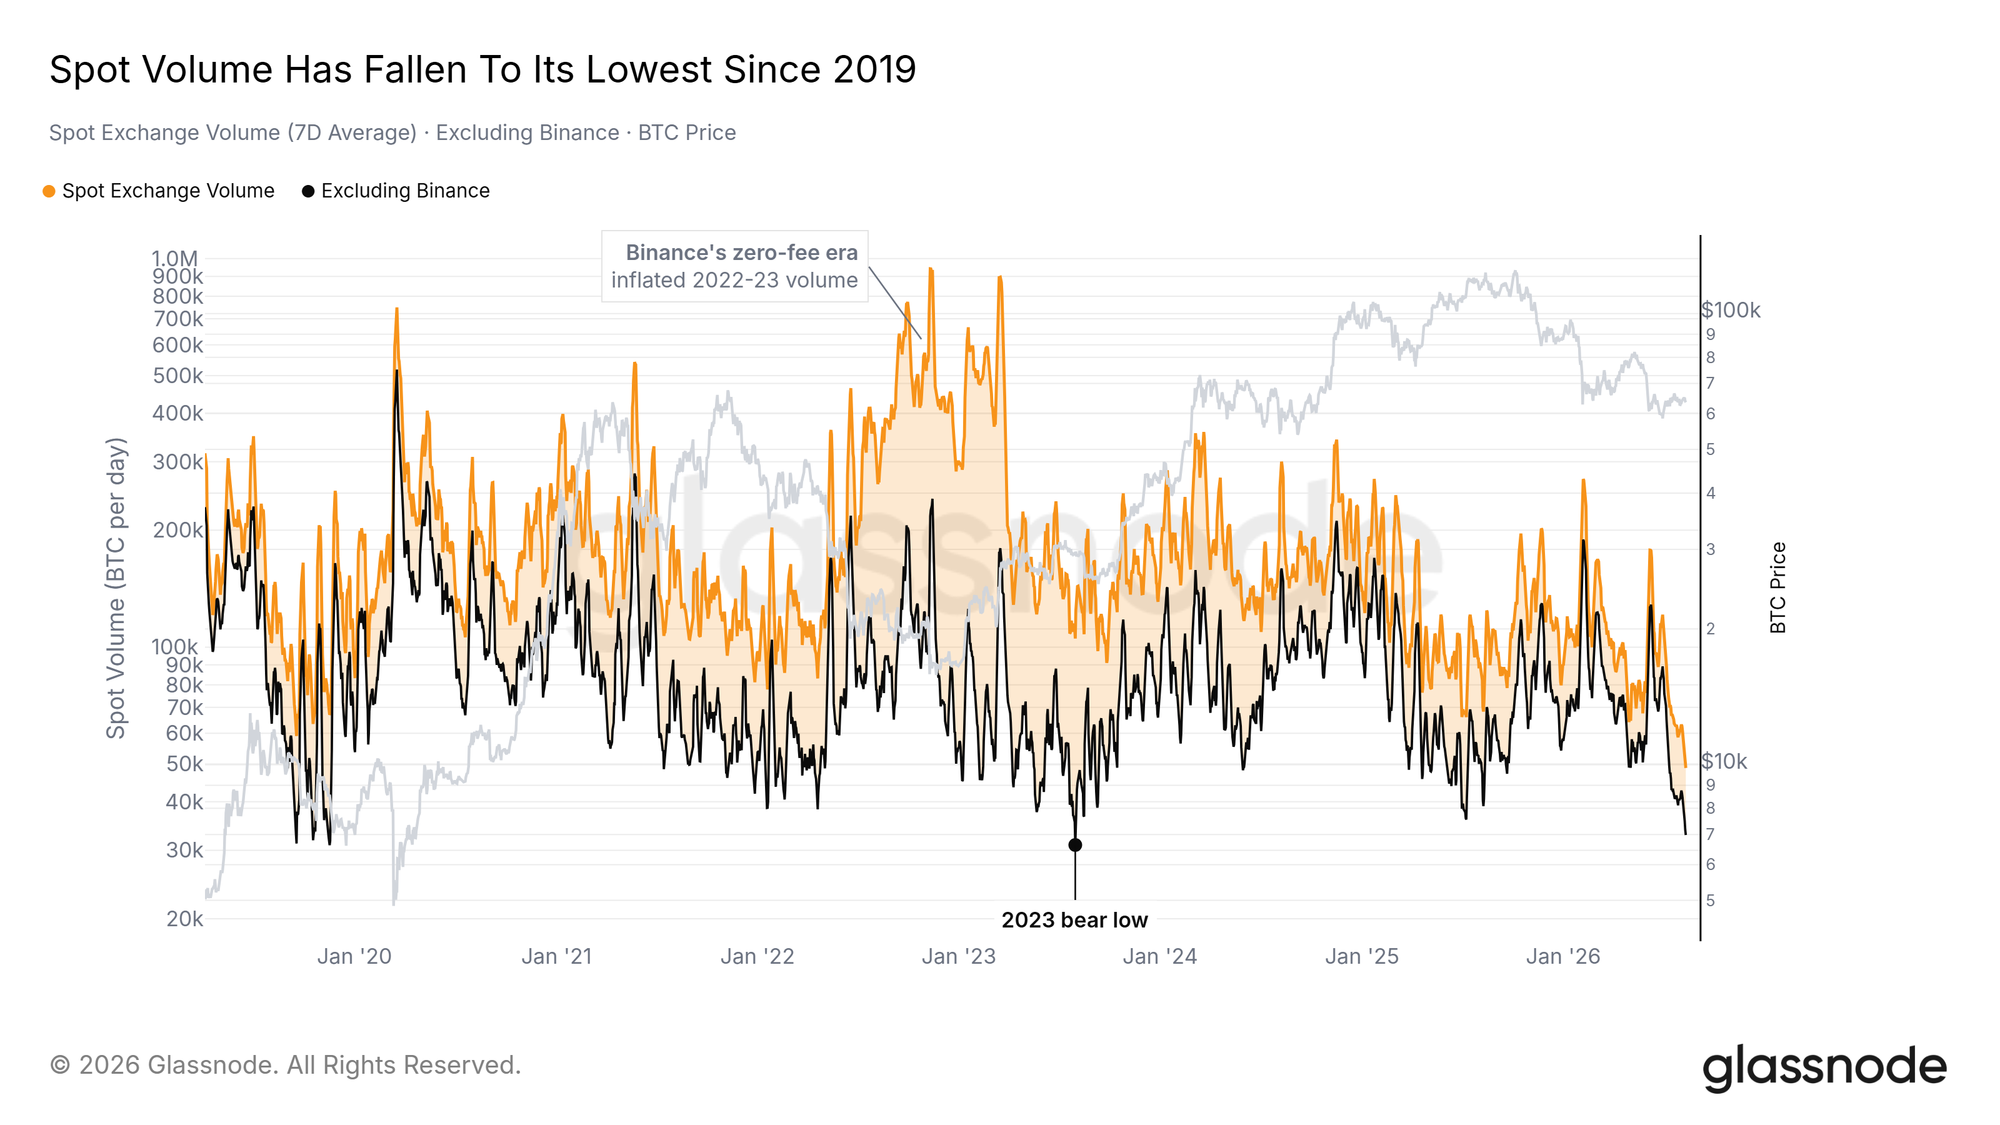
The same compression shows in activity. This report has tracked the shrinking tape for several editions now, and it keeps getting more extreme: Spot Exchange Volume, measured in coins rather than dollars, has fallen to its lowest level since the series began in early 2019, and even with Binance excluded it now scrapes its 2023 bear-market lows. Fewer bitcoin are changing hands than at any point in seven years, as clear a measure of apathy as the market offers.
A tape this thin amplifies whichever side moves first: modest demand can lift price, and modest supply can break it. Participation this low rarely lasts, and it is the classic setup for a volatility expansion. The sections below weigh which side is likelier to arrive first.
The Sellers Are Tiring
The Signatures Of A Floor
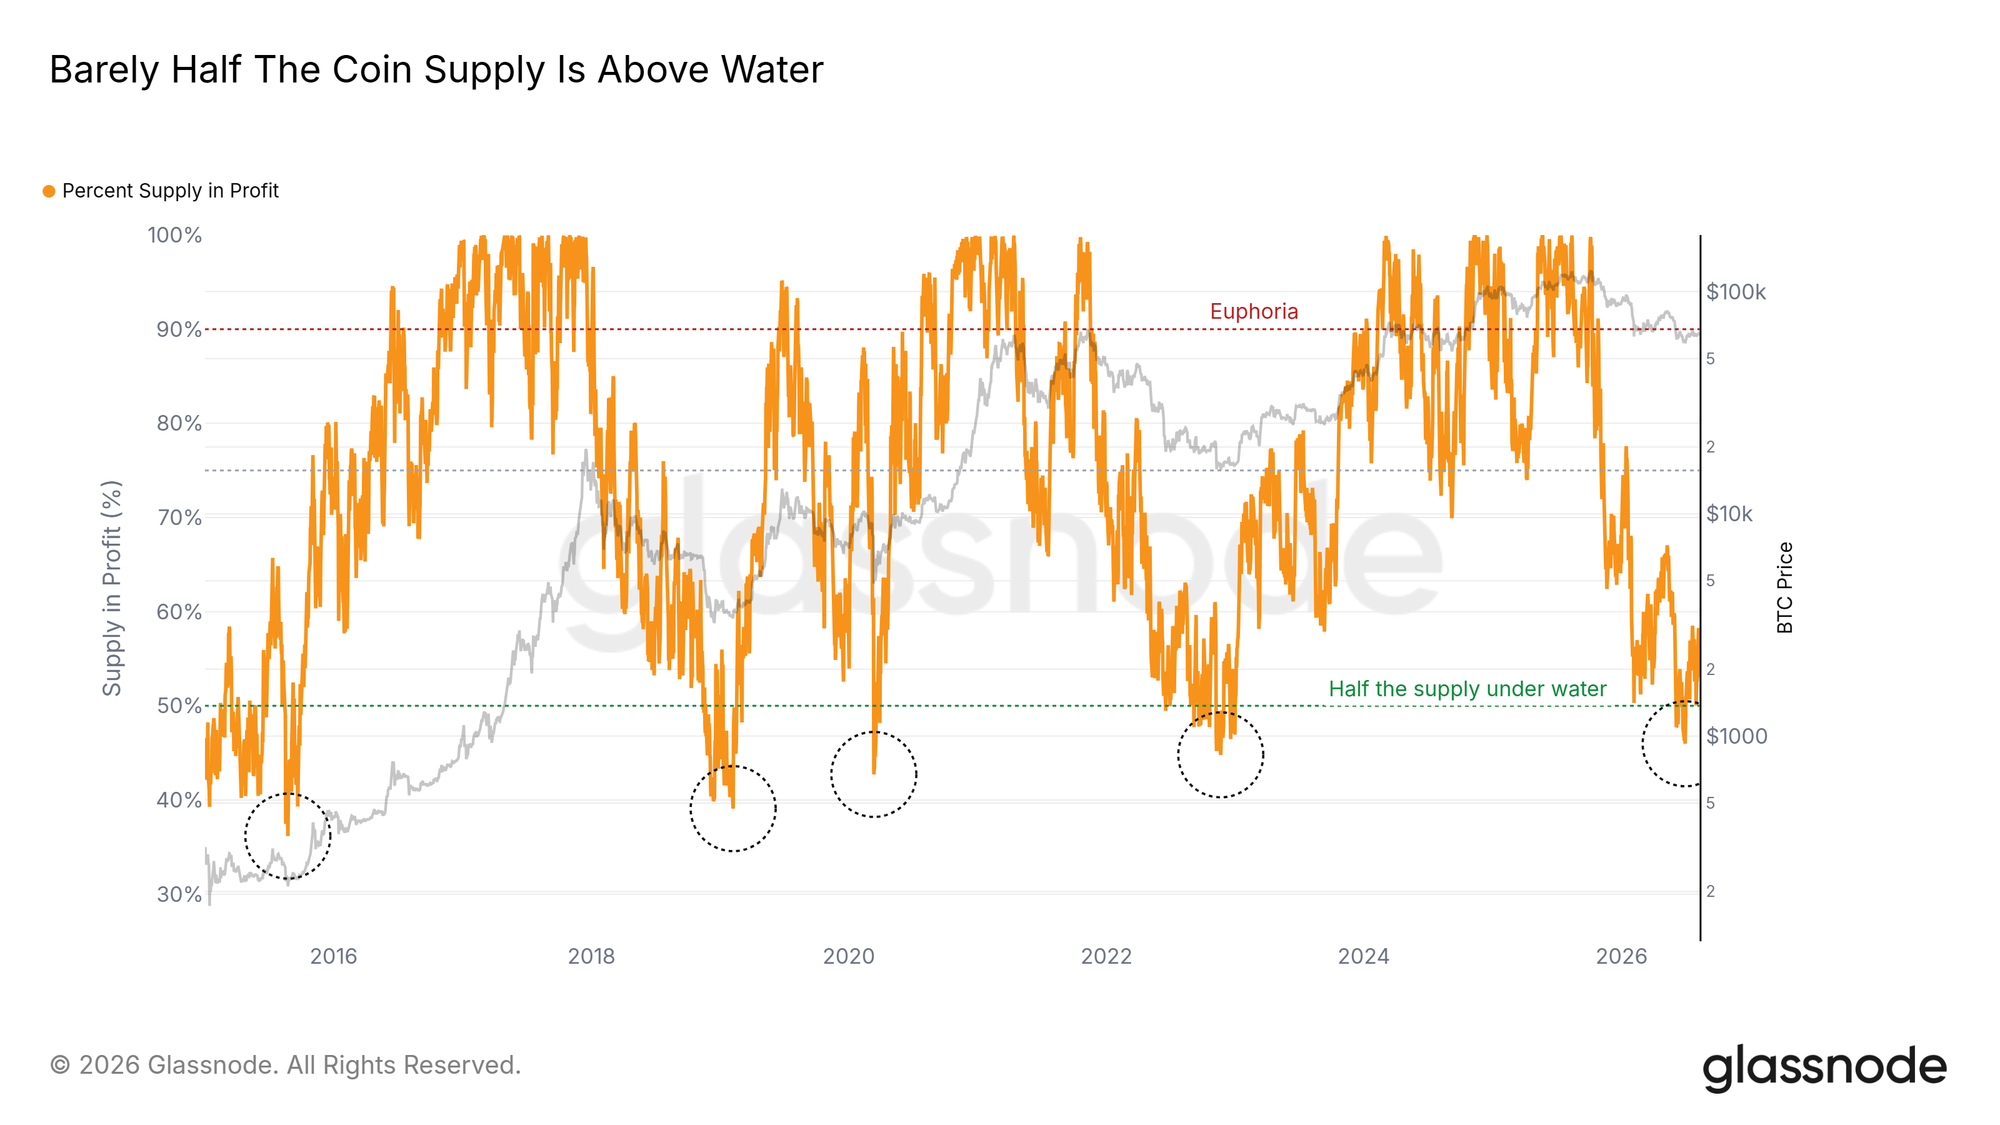
Two standing bear-market gauges are approaching bottom territory. Barely half of the circulating supply holds an unrealized profit, and June's trough stopped just short of the zone where the last four bears ended; the circles on the chart mark how much deeper each of those floors went.
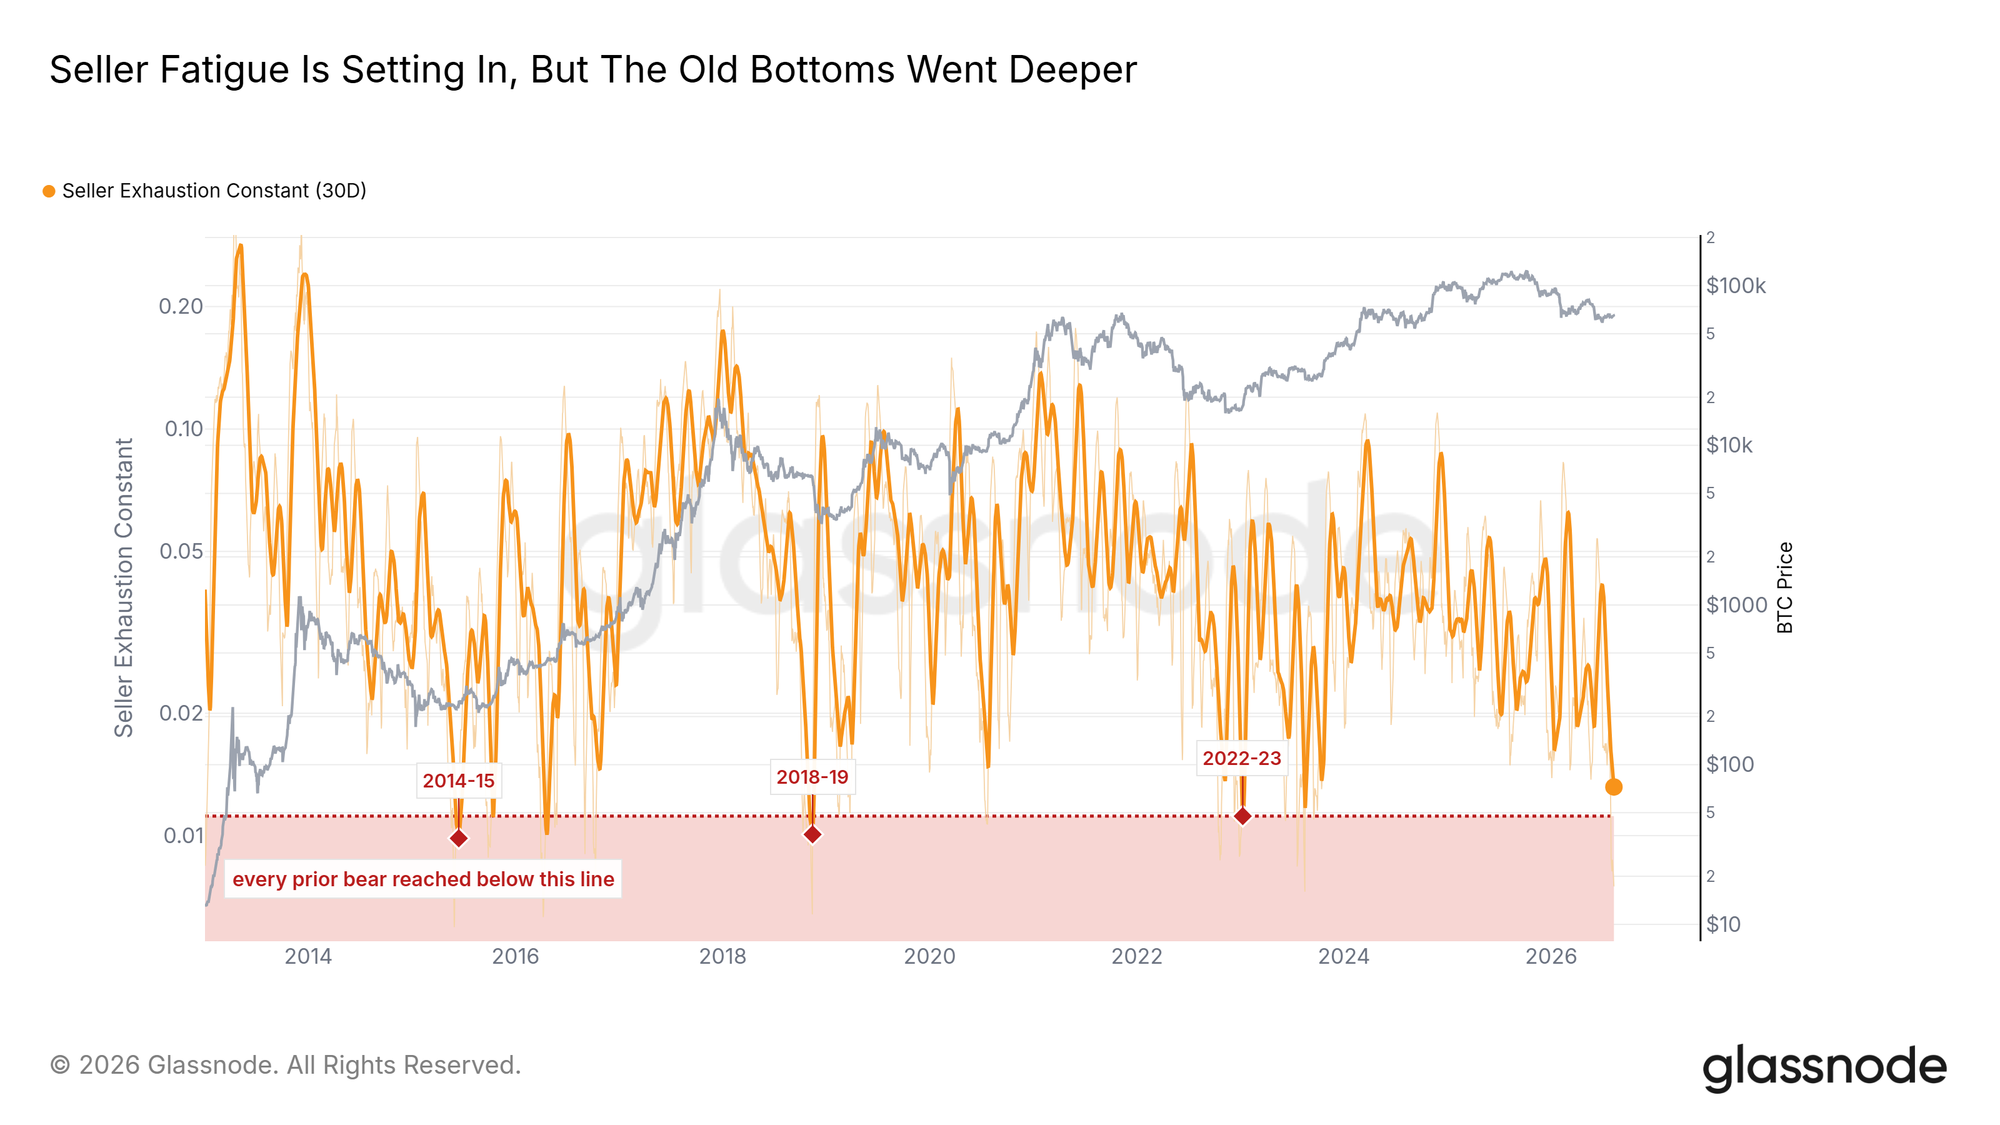
The Seller Exhaustion Constant, which pairs supply in profit with volatility to flag the moments sellers give up, has ground down to a cycle low, among the weakest readings since 2013, and it too remains above every prior floor. Sellers are visibly tiring, but the final flush that ended earlier bears has not happened. Last week we described this drawdown as a capitulation of boredom rather than pain; a dose of pain would complete the historical pattern, though the other way out is time, and a grind can run far longer than anyone positioned for it expects.
Nine Rejections At Break-Even
Adjusted SOPR, the ratio of sale price to purchase price across meaningful on-chain spending, has spent most of this bear just below 1.0, where the average coin moved sells for what it cost. Nine times since the October top the 7-day average has climbed back to that line, and nine times sellers used the touch as an exit. The market is still digesting overhead supply.
Both prior bears spent more of their days below break-even and travelled far deeper before they turned, which places this cycle among the milder ones so far. A durable recovery would show up here as the ratio holding above 1.0 through a rally. Until then, sellers hold the line.
The Buyers Are Missing
A Trickle Of Inflows
The ETF complex has stopped selling. Net flows turned positive at the end of July for the first time in months, though at a small fraction of any past accumulation wave, and the cumulative position still sits well below its October peak. Flows this small can flip sign on a single day's redemptions.
We read this as apathy. The June outflow wave has exhausted itself, which removes one source of pressure, but the institutional bid that powered 2024-2025 has not returned. Each previous recovery began with a visible demand impulse in this chart, and there is none in it today.
Coins Still Drift In
Supply, meanwhile, keeps arriving. Exchange Net Position Change remains in inflow territory, with coins landing on exchanges on most days this year. The pace has faded to a fraction of its early-June peak, which fits the tiring-seller picture, but the direction has held: coins continue to move toward venues where they can be sold.
Against an empty demand ledger, even modest inflows matter. A normal market would absorb them without moving; on the thinnest tape since 2019, with no ETF bid underneath, the same trickle of supply presses on price.
The Crowd That Didn't Wait
Longs Into The Highs
Derivatives traders have shown none of this hesitation. On Hyperliquid, the whale book has closed net long every day since mid-March, a run without precedent in the data's short one-year history, and the position peaked in mid-July with price at the top of the local range. A cohort that ran persistently short through late 2025 flipped in March and has pressed the long harder as the range matured.
Nothing in the spot or flow data yet validates that conviction. Leverage placed this early concentrates risk exactly where a failed range would hurt most.
Heavy Book, Quiet Tape
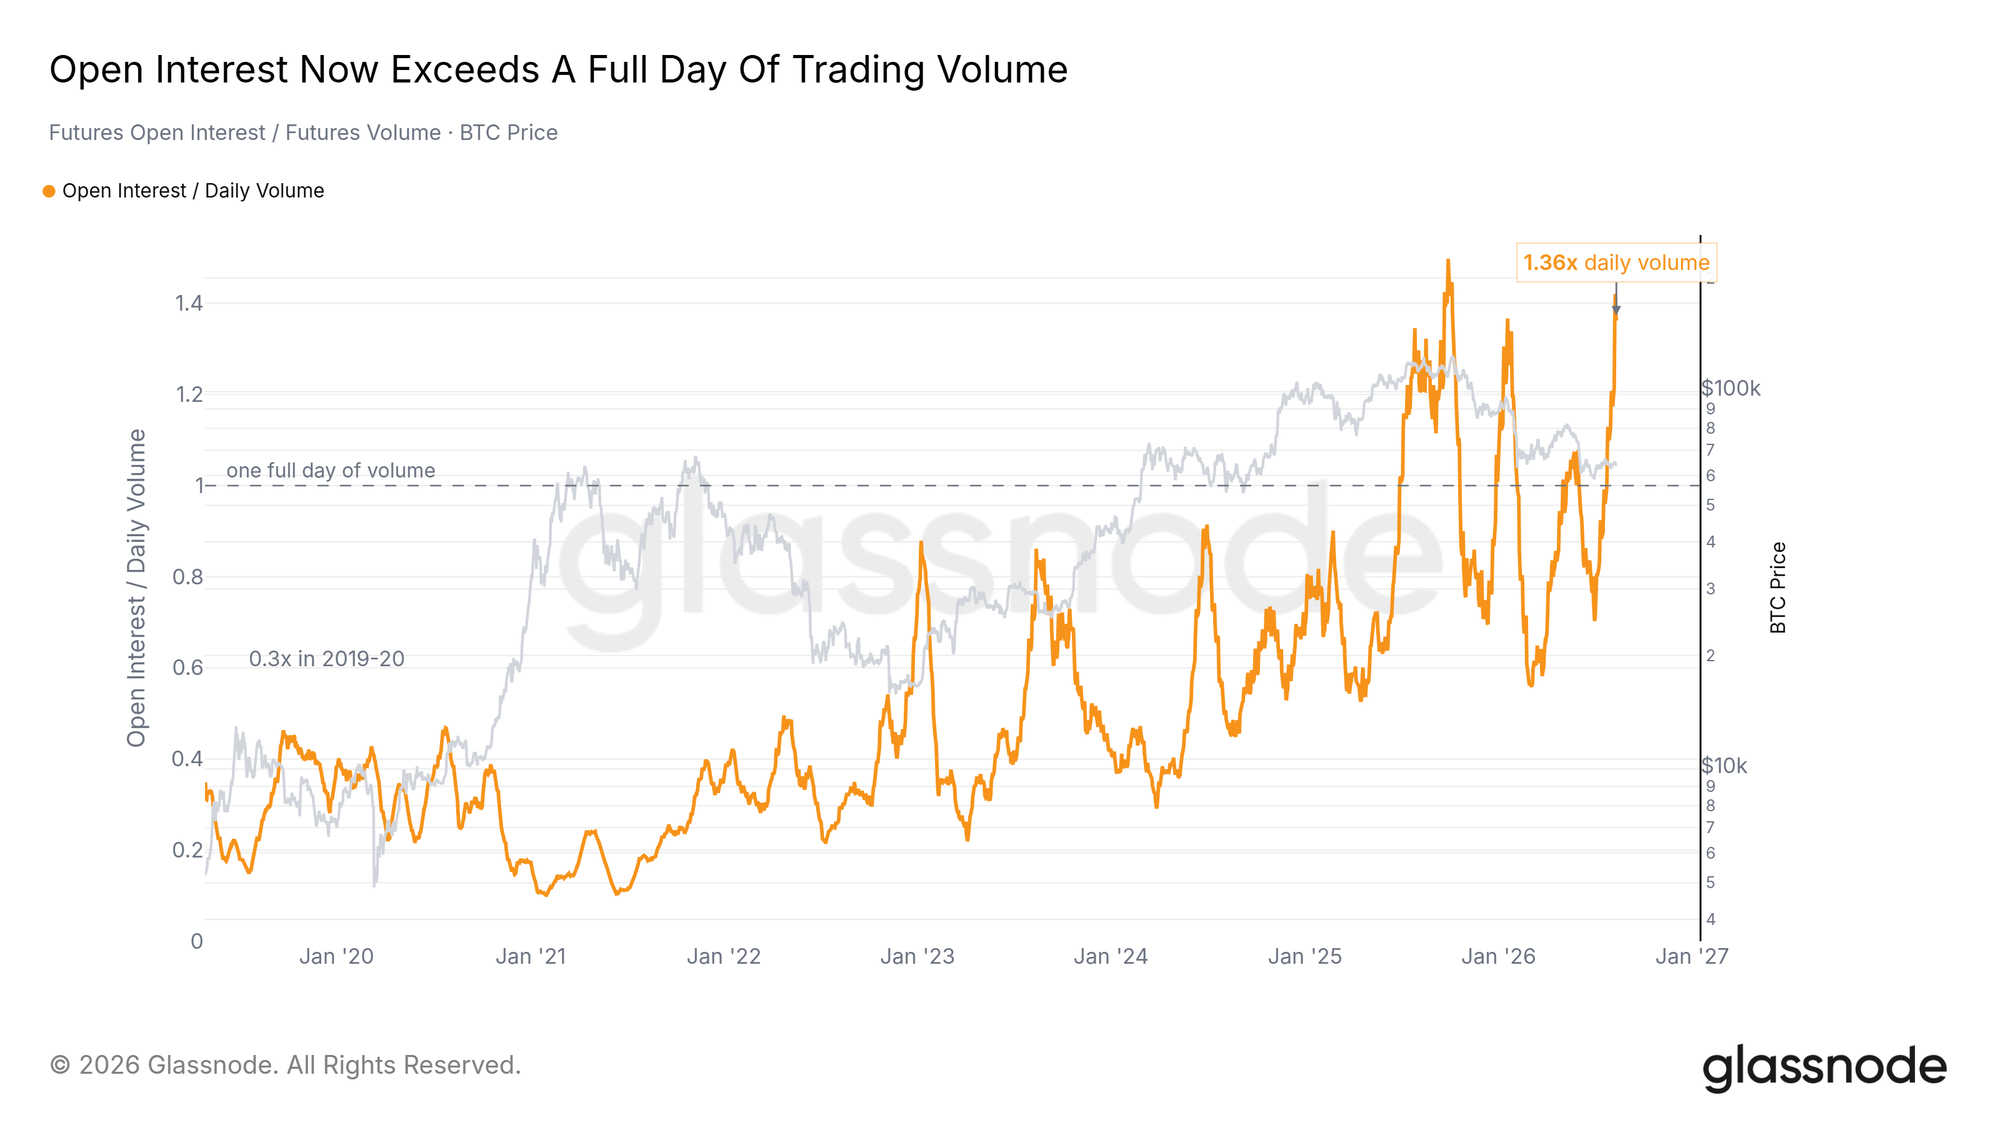
The strain is visible at the aggregate level too. Futures Open Interest now exceeds an entire day of futures volume, close to the record set last September; through 2019-2020 the same book turned over roughly three times a day. Positions have kept growing while participation drained, leaving a large, stale stack of contracts on a quiet tape.
The risk is mechanical. When open interest towers over daily volume, liquidations meet little resting flow to absorb them, and adverse moves extend further than they otherwise would. Traders have added substantial risk, most of it long, into a market that shows no matching demand.
The Thinning Bid
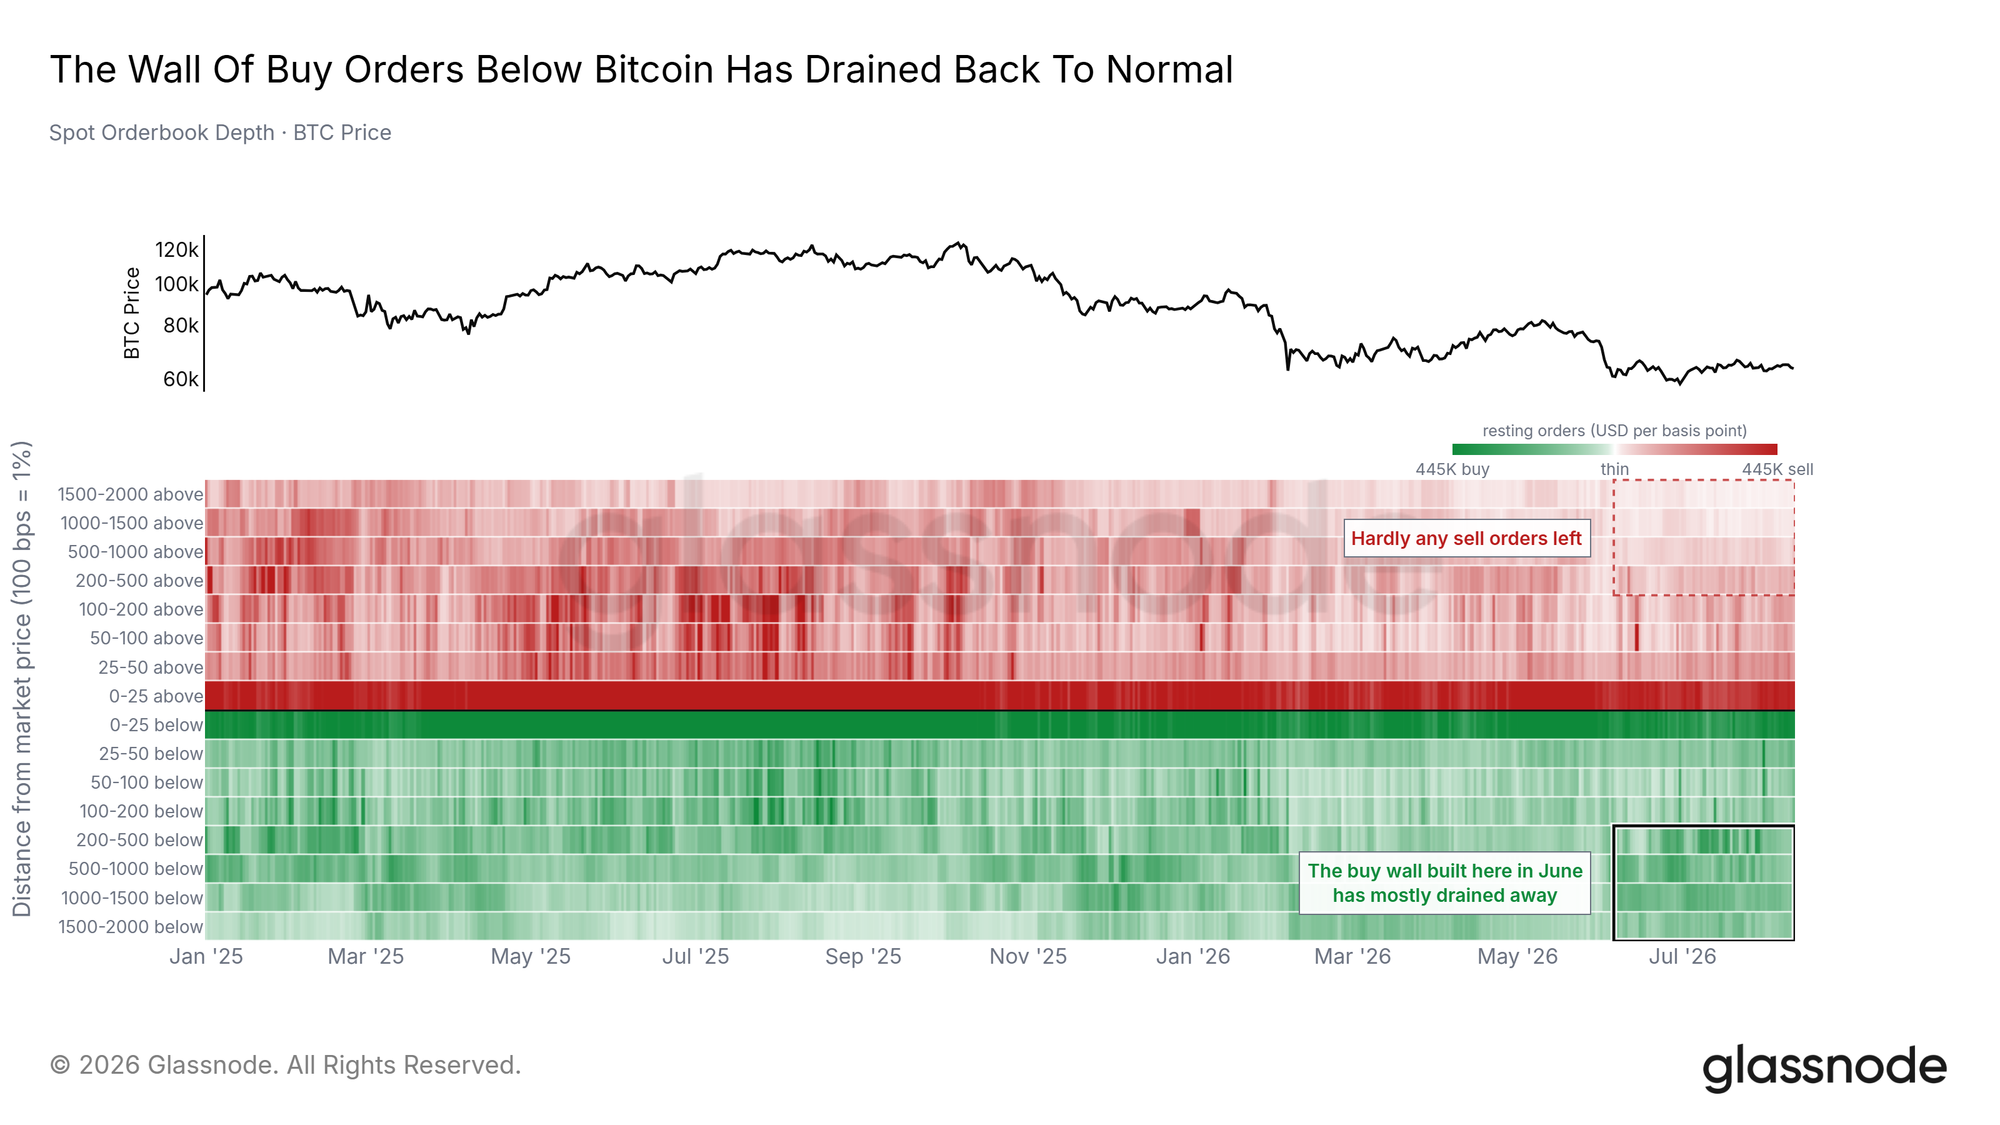
The order book carries the final warning. The band of resting bids that framed the summer range peaked at the start of July and has thinned by roughly a third since, leaving less support beneath price than at the last test of the lows. The ask side is thin as well, so the imbalance flatters the bulls even as absolute depth erodes.
Should the range break, a move toward the June low near $58.5K would land on a softer book than the one that caught it six weeks ago, with the crowded longs above supplying the fuel. Thin bids, heavy leverage and record-low volume leave downside moves prone to overshoot.
Conclusion
This is a late-bear compression with an unusual overlay: the crowd has positioned for the recovery before the demand arrived. The seller side leans constructive, with supply in profit near past floor territory, seller exhaustion at cycle lows and exchange inflows fading. The buyer side stays empty, from minimal ETF flows to the thinnest spot tape since 2019, and Bitcoin keeps lagging equities that sit at records. A reclaim of the Short-Term Holder Cost Basis at $68.7K on rising volume, with ETF inflows following, would confirm improvement. Failure to rally on this week's benign inflation data, or a loss of the $58.5K range low into thin bids and crowded longs, would invalidate the floor case. We remain cautious, and patient.
Disclaimer: This report does not provide any investment advice. All data is provided for informational and educational purposes only. No investment decision shall be based on the information provided here, and you are solely responsible for your own investment decisions.
Exchange balances presented are derived from Glassnode’s comprehensive database of address labels, which are amassed through both officially published exchange information and proprietary clustering algorithms. While we strive to ensure the utmost accuracy in representing exchange balances, it is important to note that these figures might not always encapsulate the entirety of an exchange’s reserves, particularly when exchanges refrain from disclosing their official addresses. We urge users to exercise caution and discretion when utilizing these metrics. Glassnode shall not be held responsible for any discrepancies or potential inaccuracies.
