Strategy Watch #6
Our monthly analysis of strategy performance and capital flows in digital assets. We examine fund returns, structured product trends, and allocator shifts to reveal how institutional demand and exposure are evolving across crypto markets.


The full report is freely available in PDF format.
Welcome to Strategy Watch #6
Strategy Watch was built to address a clear demand for high-signal, impartial analysis of fund-level performance and allocation trends in digital assets.
Our objective is simple: to make Strategy Watch a must-read monthly publication for the digital asset investment community.
This publication is strengthened by direct input from market participants. Funds and allocators that contribute data and insights help shape a more complete and valuable view of the landscape. If you have insights, data, or allocation updates worth sharing, we welcome your contribution.
Present your latest initiatives and updates to a curated audience of institutional allocators.
Inside the Latest Strategy Watch
The report is structured across six core sections, each focused on a distinct dimension of institutional activity in digital assets:
01 Institutional Flow Monitor | Net capital left every major asset in June, with spot ETFs shedding BTC and ETH while treasury vehicles kept accumulating before their bid faded into month-end. What does the divergence signal for allocator positioning?
02 Fund and SMA Performance | Directional strategies fell broadly as the majors weakened, led lower by Fundamental, while nearly every market-neutral sub-strategy ground out gains.
03 Strategy Deep Dive: Volatility Arbitrage | A trading team's view on where the volatility risk premium has gone as options flow matures, featuring Iqana co-founder and CTO Albert Ventura-Traveset.
04On-chain Vault Performance | Curated-vault deposits kept climbing even as USD curators only matched the risk-free rate, and isolation contained a late-month token collapse. On-chain credit continues to stabilize, but can vault yields compete with Treasury rates and native ETH staking?
05Manager Monitor | See how 400+ managers are positioning as cash levels climb, fundraising stays subdued, and focus rotates from Hyperliquid back toward Ethereum and Solana.
06Allocation Updates | New investment firms, dedicated crypto divisions, and fund launches across the institutional landscape.

The Premier Digital Assets Allocator Platform. Learn more
Institutional Flow Monitor
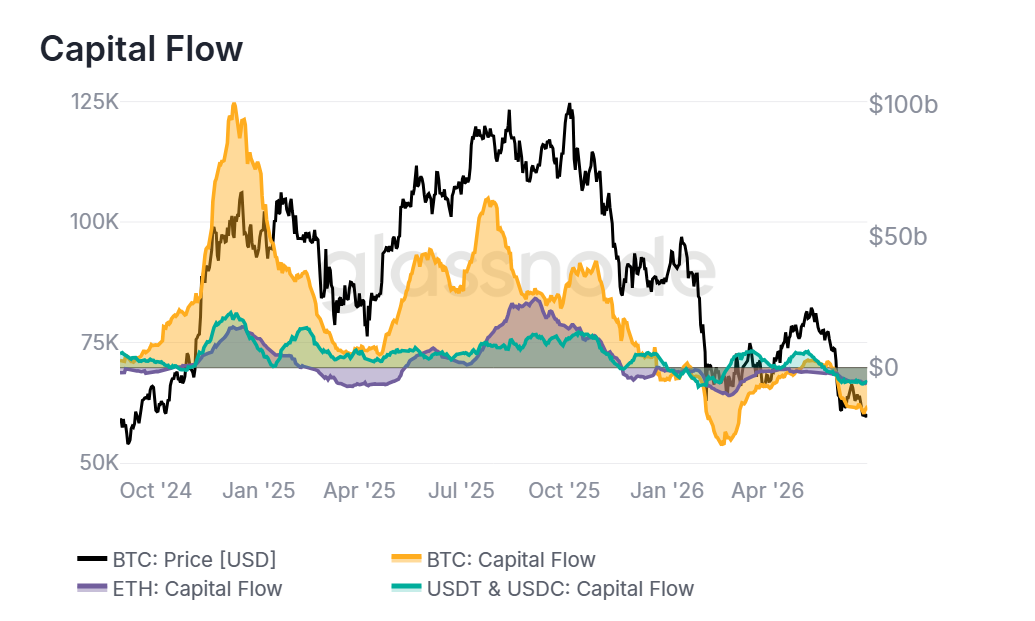
- Net capital left every major asset in June, with stablecoin balances contracting alongside spot rather than absorbing the rotation.
Capital flows turned broadly negative through June and deepened as the month wore on. Bitcoin saw the heaviest drain, with net outflows widening to -$16.3B by the close after reaching -$17.5B on June 26, while Ethereum ended at -$5.8B. Stablecoins offered no offset, contracting -$5.7B rather than absorbing capital leaving the majors. That mix of spot outflows and a shrinking stablecoin base points to genuine de-risking rather than a rotation within the ecosystem, and it suggests allocator conviction stayed under pressure through month-end.
ETF & DAT Net Flows
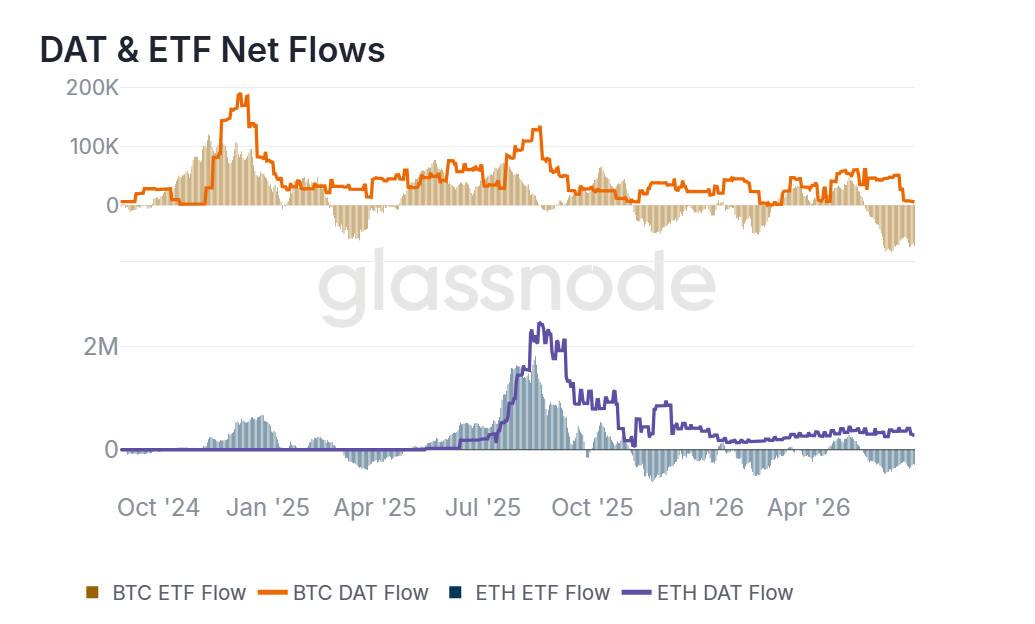
- Spot ETFs shed BTC and ETH through June while treasury vehicles kept accumulating, though their buying faded sharply into month-end.
The institutional channels split again in June. US spot ETFs posted net outflows of -69.2k BTC and -292.9k ETH, with redemptions troughing near -79.8k BTC on June 10 and -467.6k ETH on June 5 before both pared back. Treasury vehicles leaned the other way, closing at +5.4k BTC and +280.6k ETH, but the pace matters more than the sign, with BTC accumulation running as high as +52.3k mid-month before fading to a near-neutral finish. That cooling treasury bid, set against steady ETF outflows, suggests balance-sheet demand is thinning rather than backstopping spot.
DeFi TVL
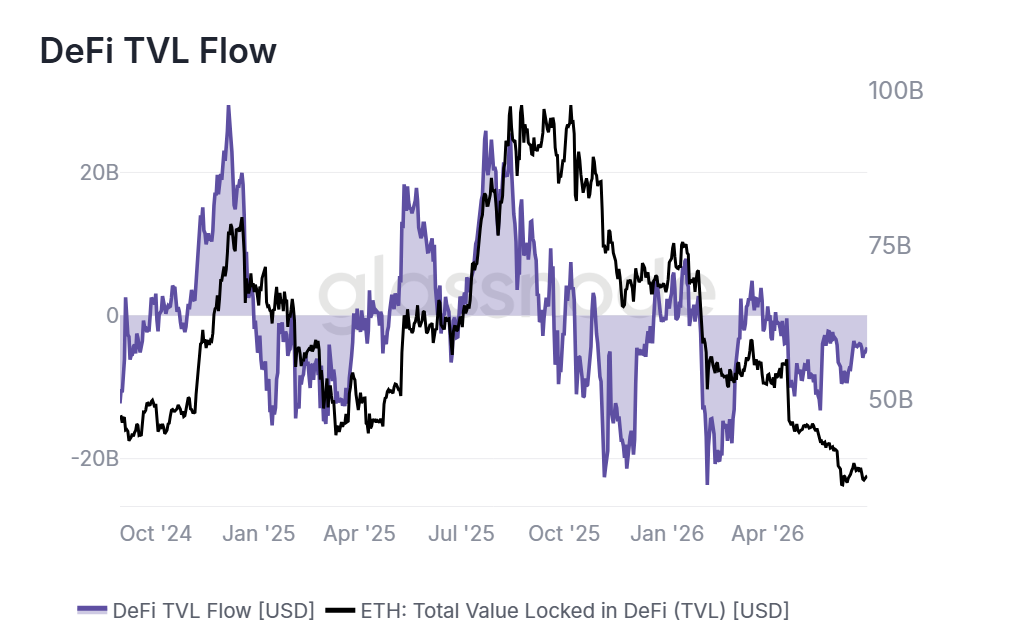
- Ethereum DeFi TVL fell back through June as net outflows widened, pointing to renewed pressure on on-chain yield participation.
On-chain yield participation weakened again in June. Total value locked on Ethereum fell from $41.9B to $37.2B, dipping to $36.2B on June 7, while the 30-day flow rate stayed negative throughout and widened to -$4.5B by the close after an early-month low of -$9.5B. Falling balances alongside persistent net outflows suggest the decline reflects real capital exit rather than price effects alone. One month does not make a trend, but the fading momentum warrants monitoring, and durable inflows would be needed before calling a return of allocator conviction in on-chain yield.
CME Basis Yield
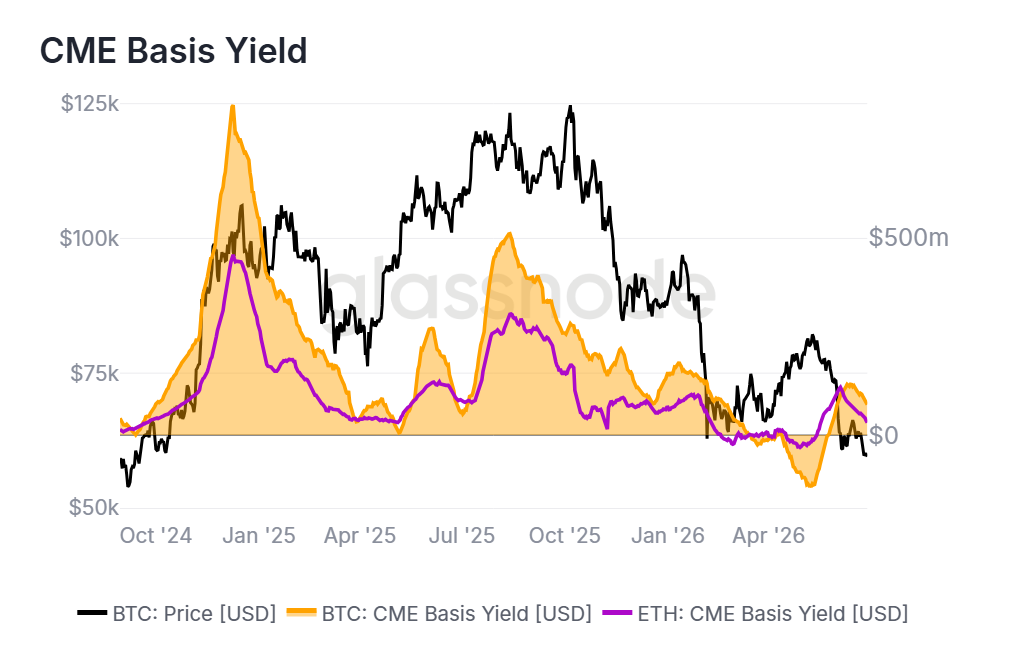
- CME carry stayed positive but compressed through June, with the Ethereum premium thinning far faster than Bitcoin's.
The cash-and-carry environment cooled without breaking. Bitcoin's 30-day CME basis yield spiked to $128.6M on June 13 before retracing to $77.0M at the close, leaving the premium intact but well off its peak. Ethereum was weaker, compressing from $107.3M to a month-end low of $31.7M. Both stayed positive, so futures still trade above spot and the market-neutral trade keeps an economic rationale, yet the thinning premium, sharpest on ETH, points to easing leveraged-long demand. Continued compression would narrow the carry cushion for market-neutral deployment, a dynamic worth watching into July.


Disclaimer: This report does not provide any investment advice. All data is provided for information and educational purposes only. No investment decision shall be based on the information provided here and you are solely responsible for your own investment decisions. Exchange balances presented are derived from Glassnode’s comprehensive database of address labels, which are amassed through both officially published exchange information and proprietary clustering algorithms. While we strive to ensure the utmost accuracy in representing exchange balances, it is important to note that these figures might not always encapsulate the entirety of an exchange’s reserves, particularly when exchanges refrain from disclosing their official addresses. We urge users to exercise caution and discretion when utilizing these metrics. Glassnode shall not be held responsible for any discrepancies or potential inaccuracies. Please read our Transparency Notice when using exchange data.
