Doubt at the Boundaries
Following the mid-August short squeeze and a brief wave of euphoria, Bitcoin stalled immediately below long-term overhead supply. With sovereign yields setting new cycle highs and ETF turnover subdued, the market has settled back into a well-defined trading range.



Executive Summary
- The relief rally initiated by the August short squeeze carried spot into the $80K region before encountering expected overhead resistance.
- When price retested May levels, on-chain supply in profit was higher at 68% compared to 65% previously, reflecting summer redistribution and creating heavier potential sell pressure.
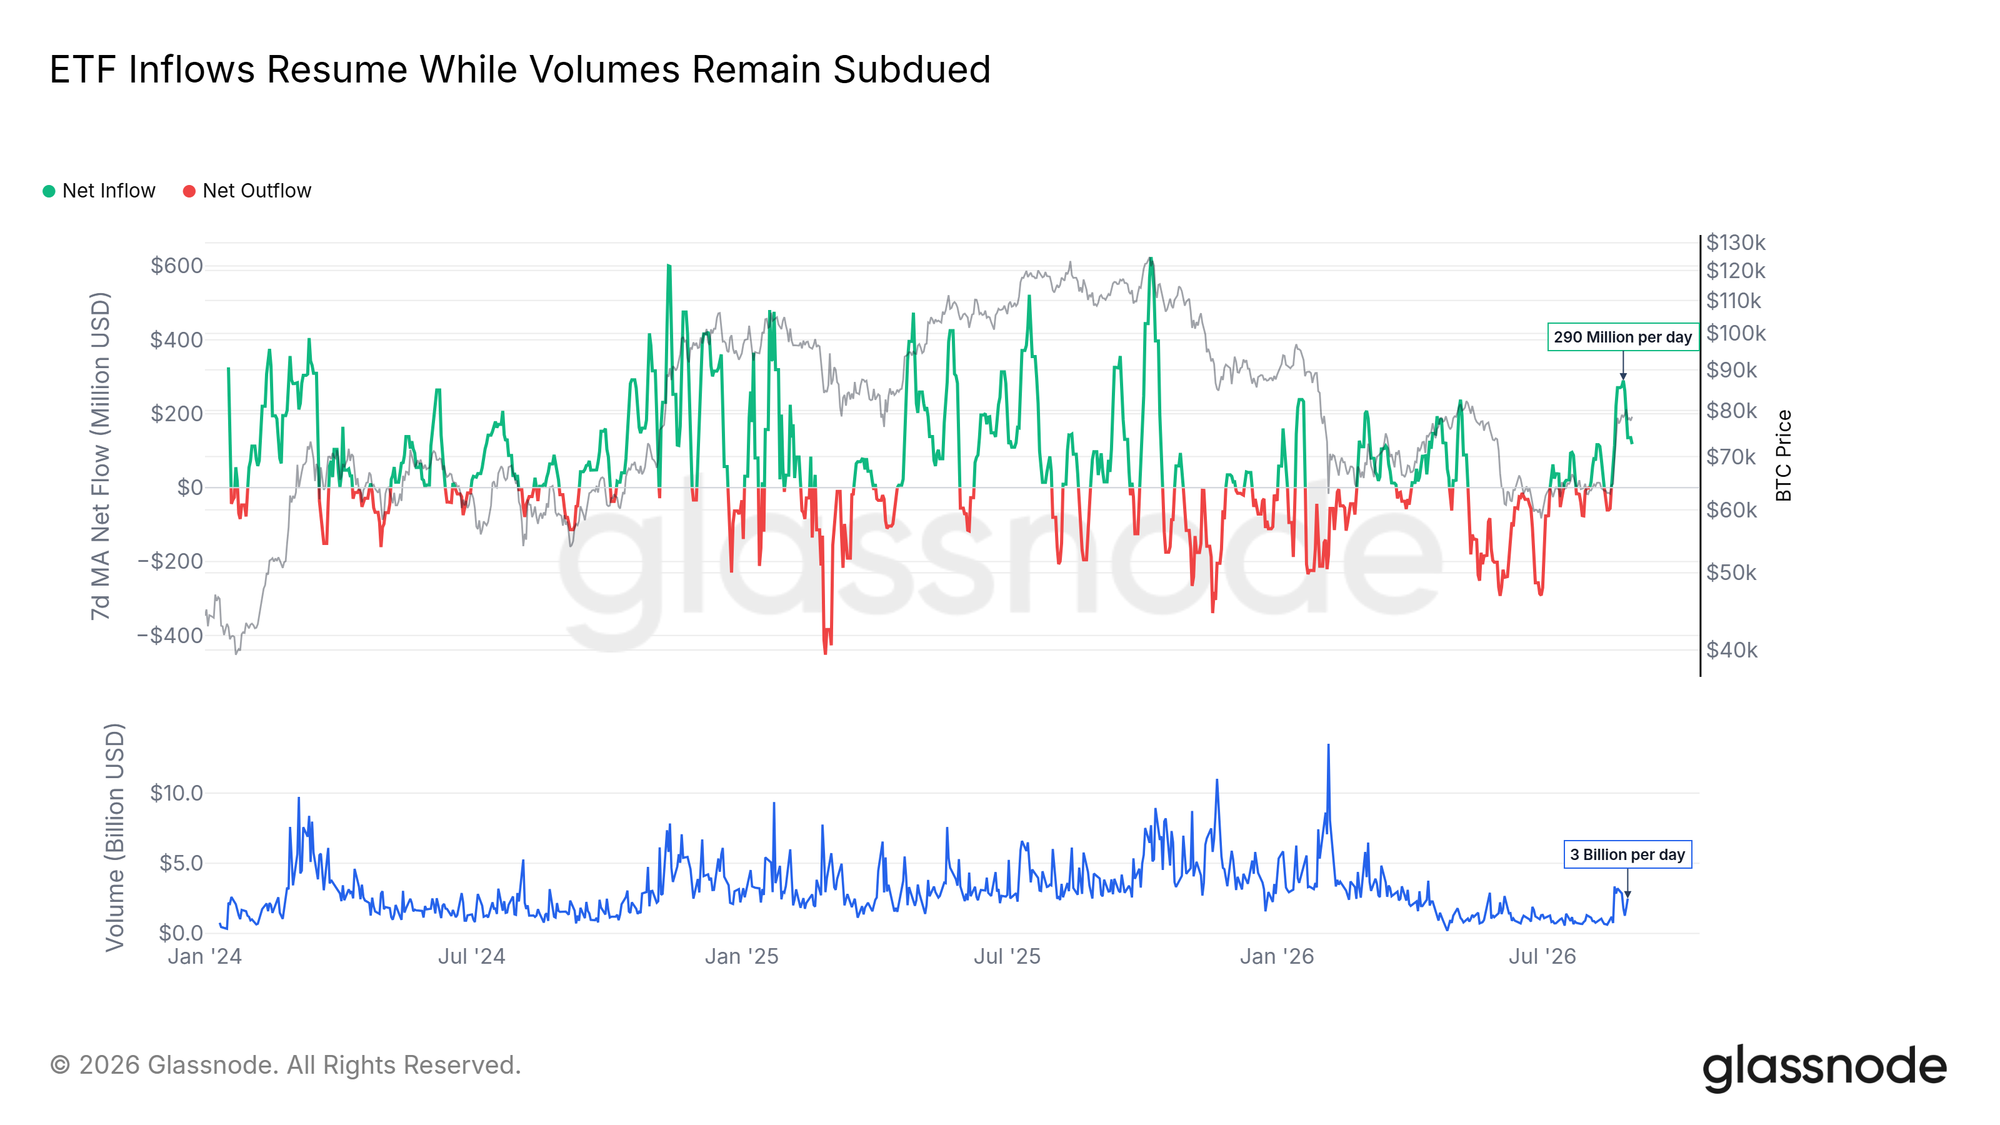
- Spot Bitcoin ETFs absorbed $290M per day at their peak, but secondary turnover remained quiet near $3B per day, typical of news-driven impulses that lack sustained velocity.
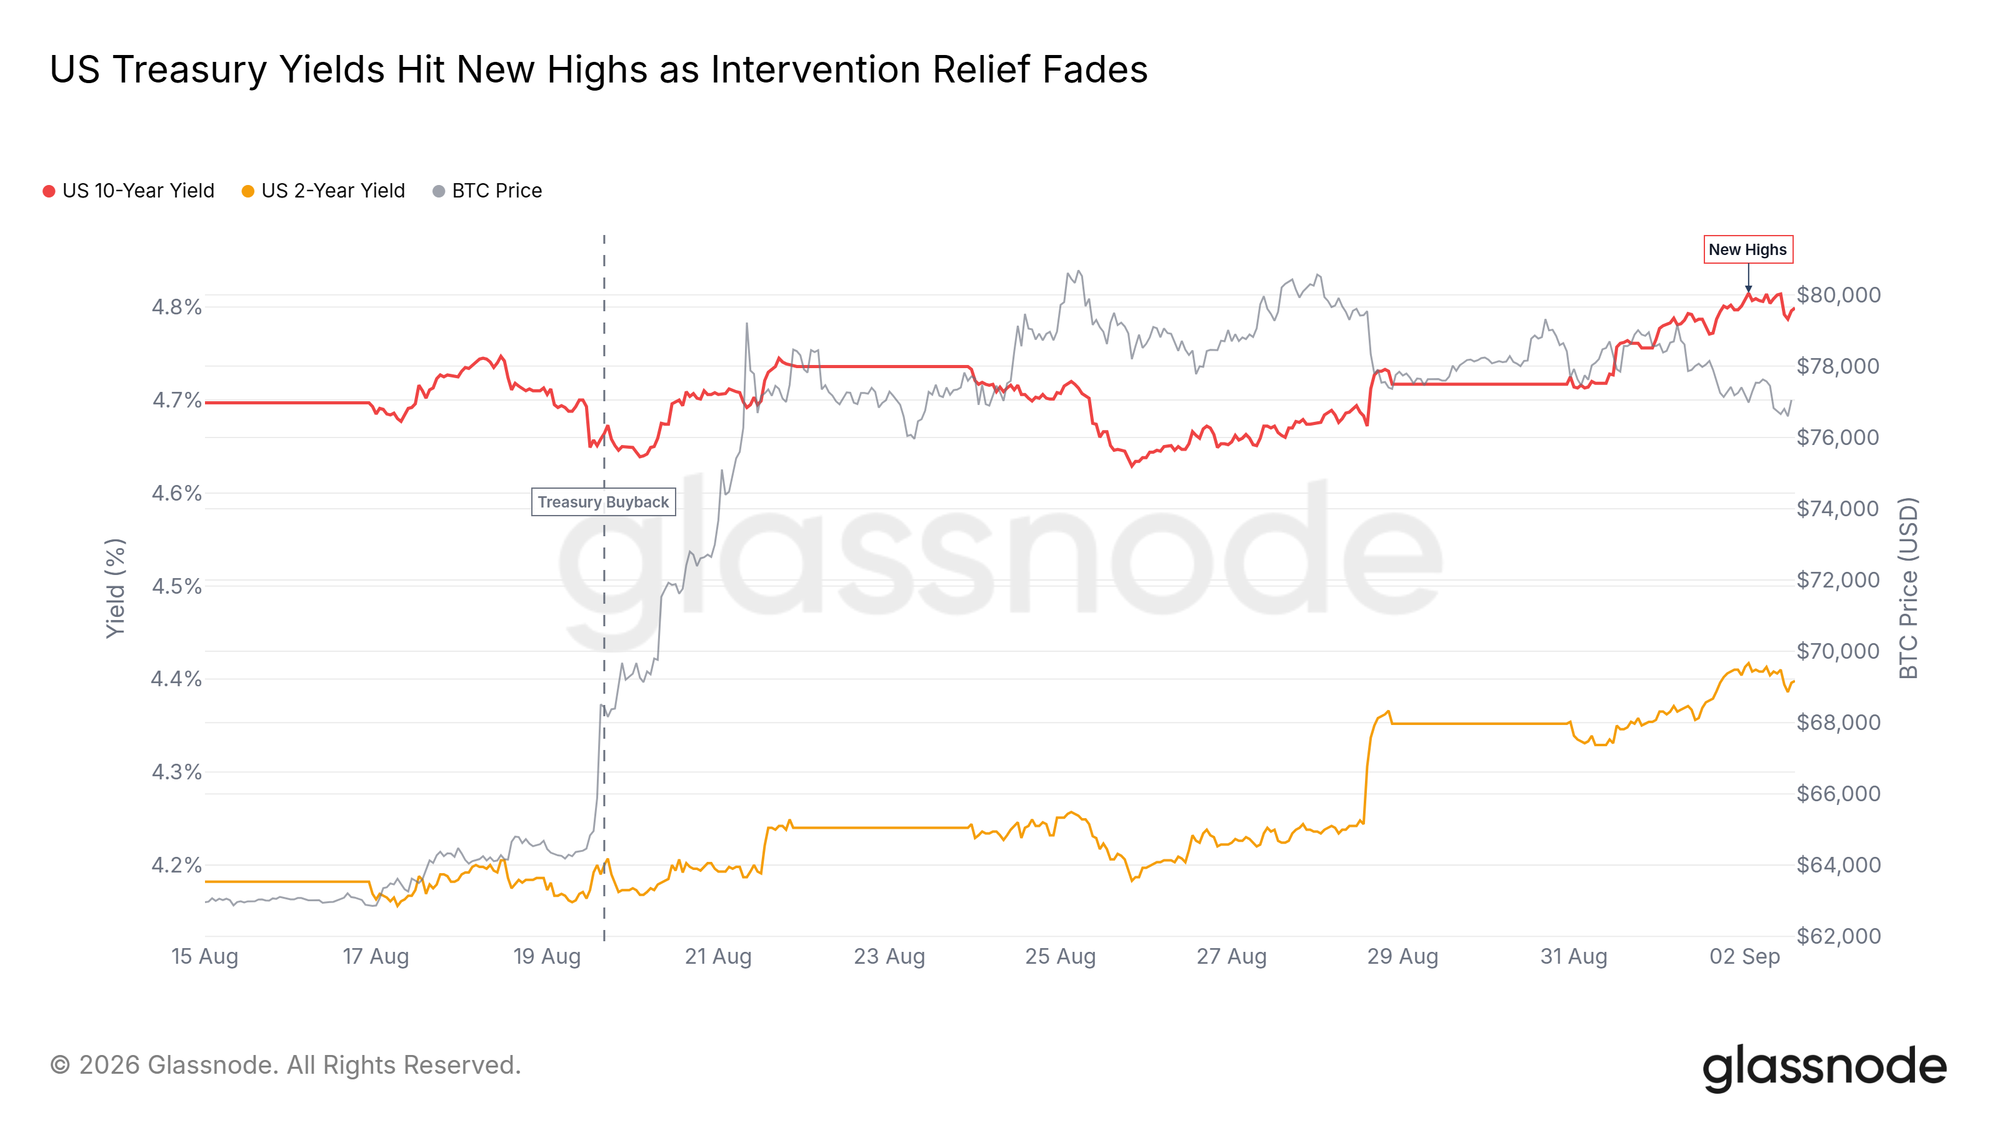
- The macro backdrop reasserted pressure as the US 10-Year Treasury yield climbed to 4.8%, erasing the entire Treasury buyback relief within eight trading sessions.
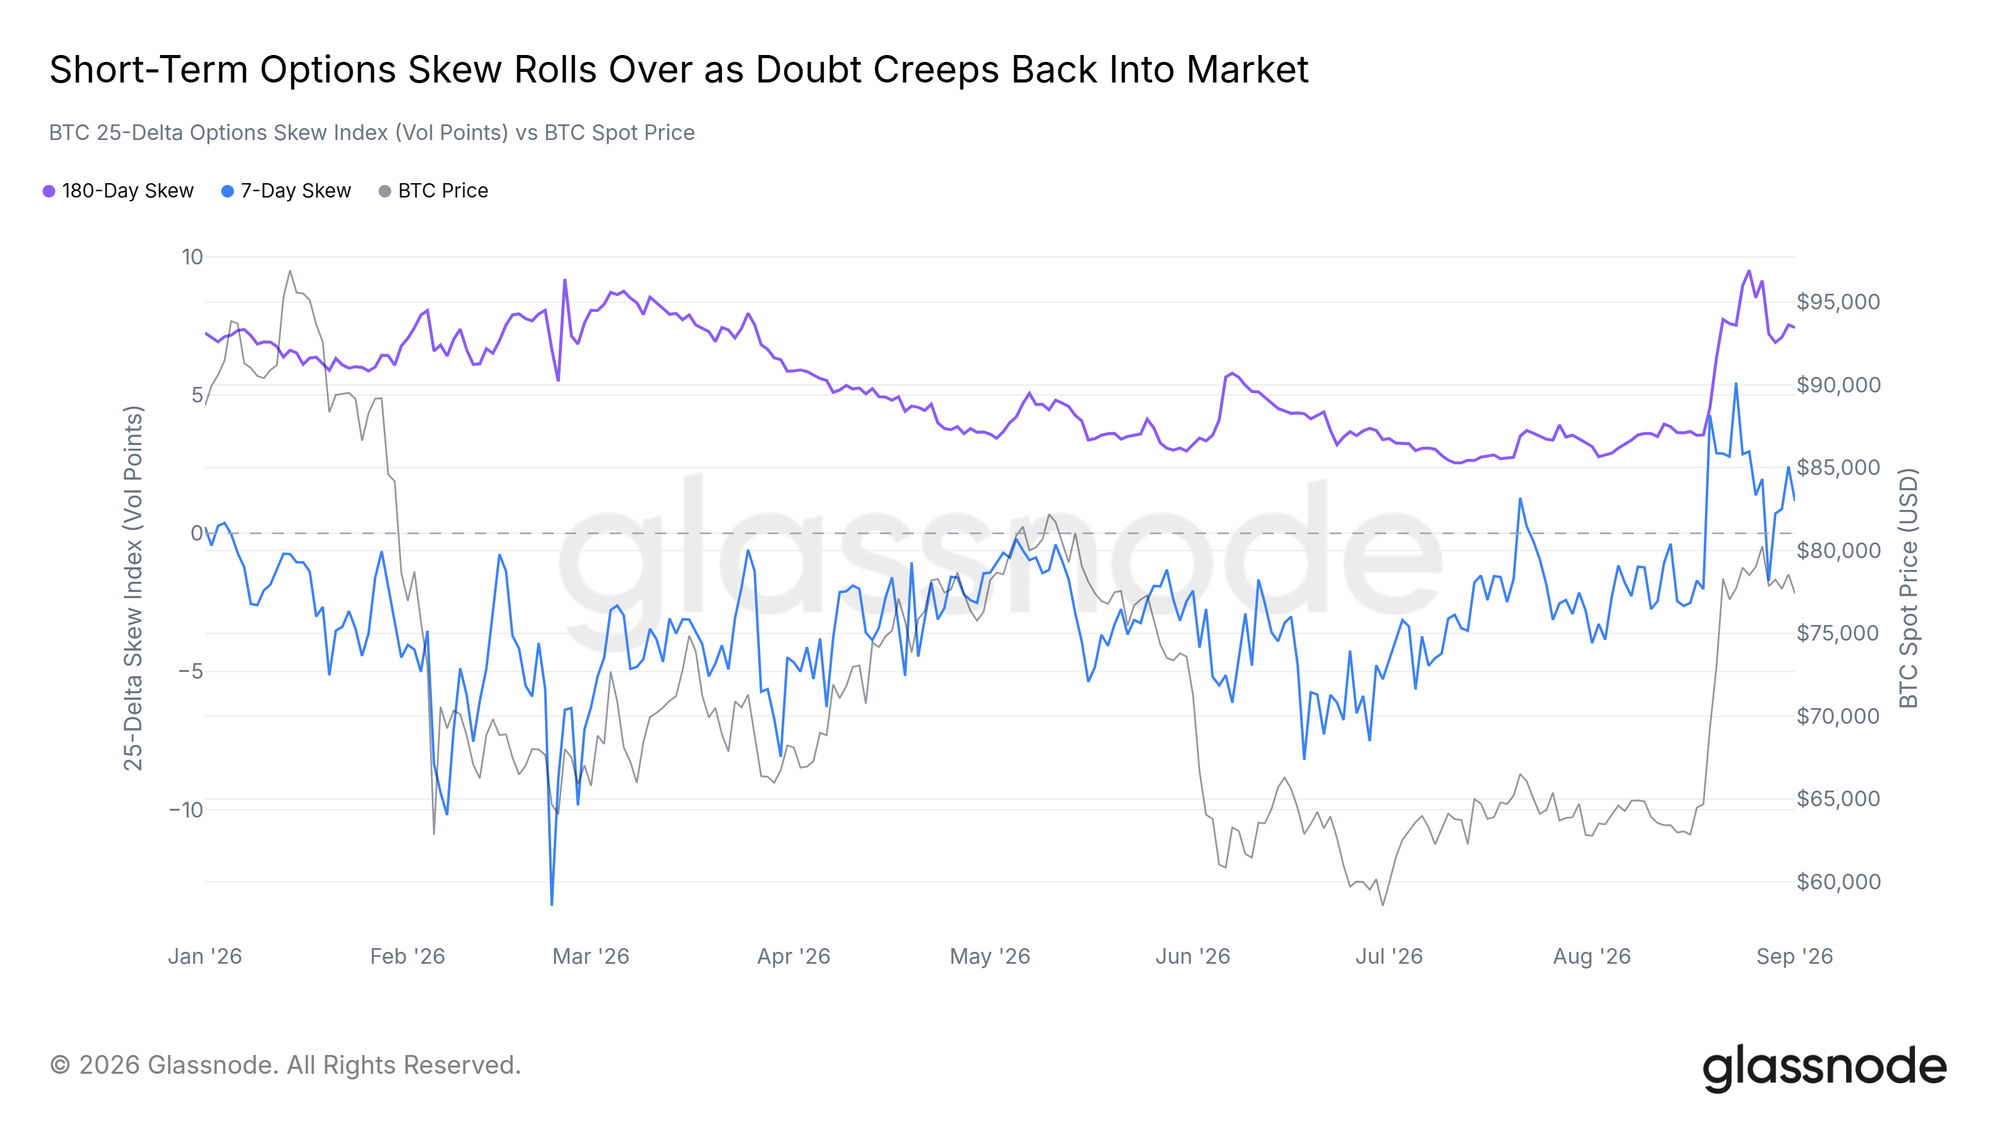
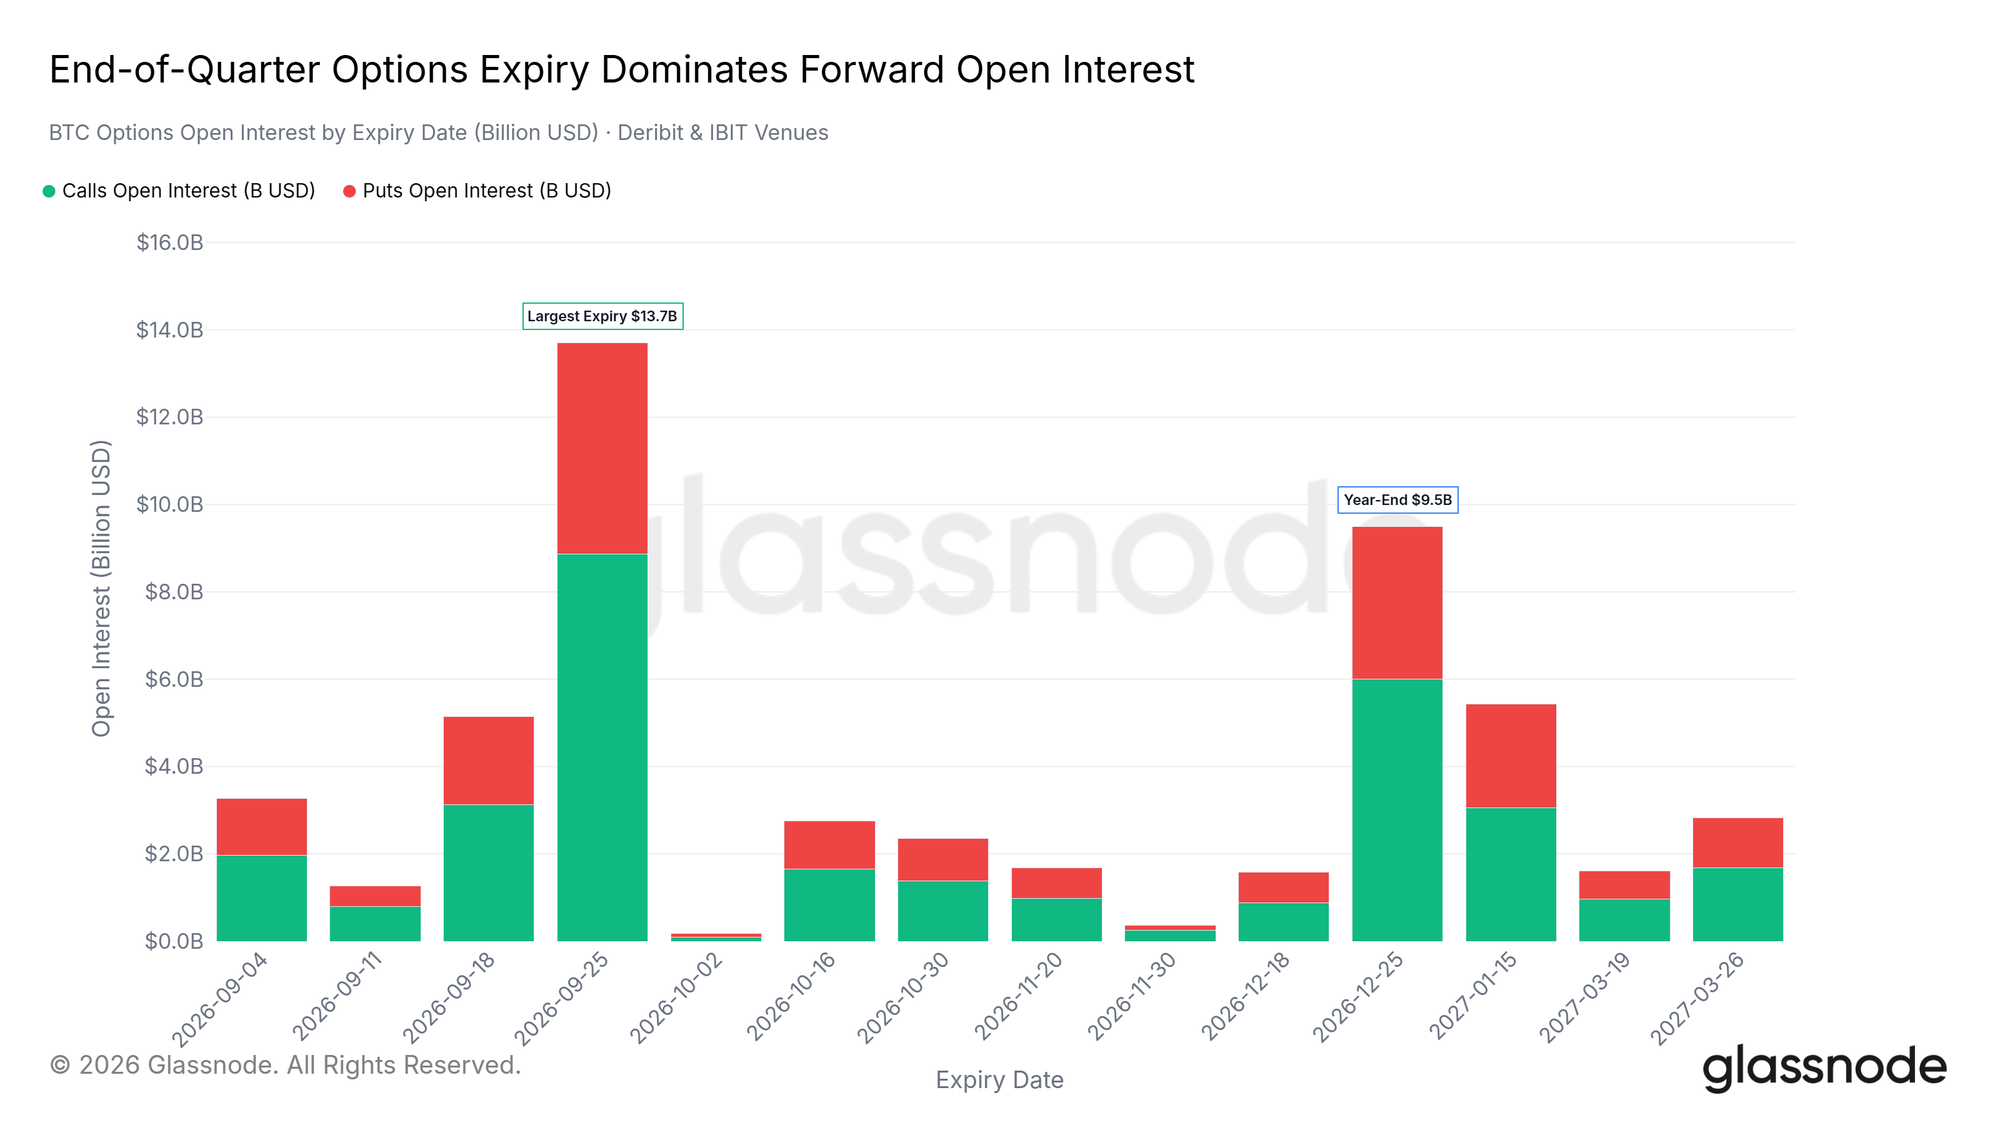
- Short-term options skew has rolled over as market sentiment cooled from euphoria, while the September 25 quarter-end expiry forms a $14B open interest barrier.
Ready to get ahead of markets and sharpen your foresight? Try Glassnode. Sign up or talk to sales.
Squeeze Aftermath
Rejection Below the Wall
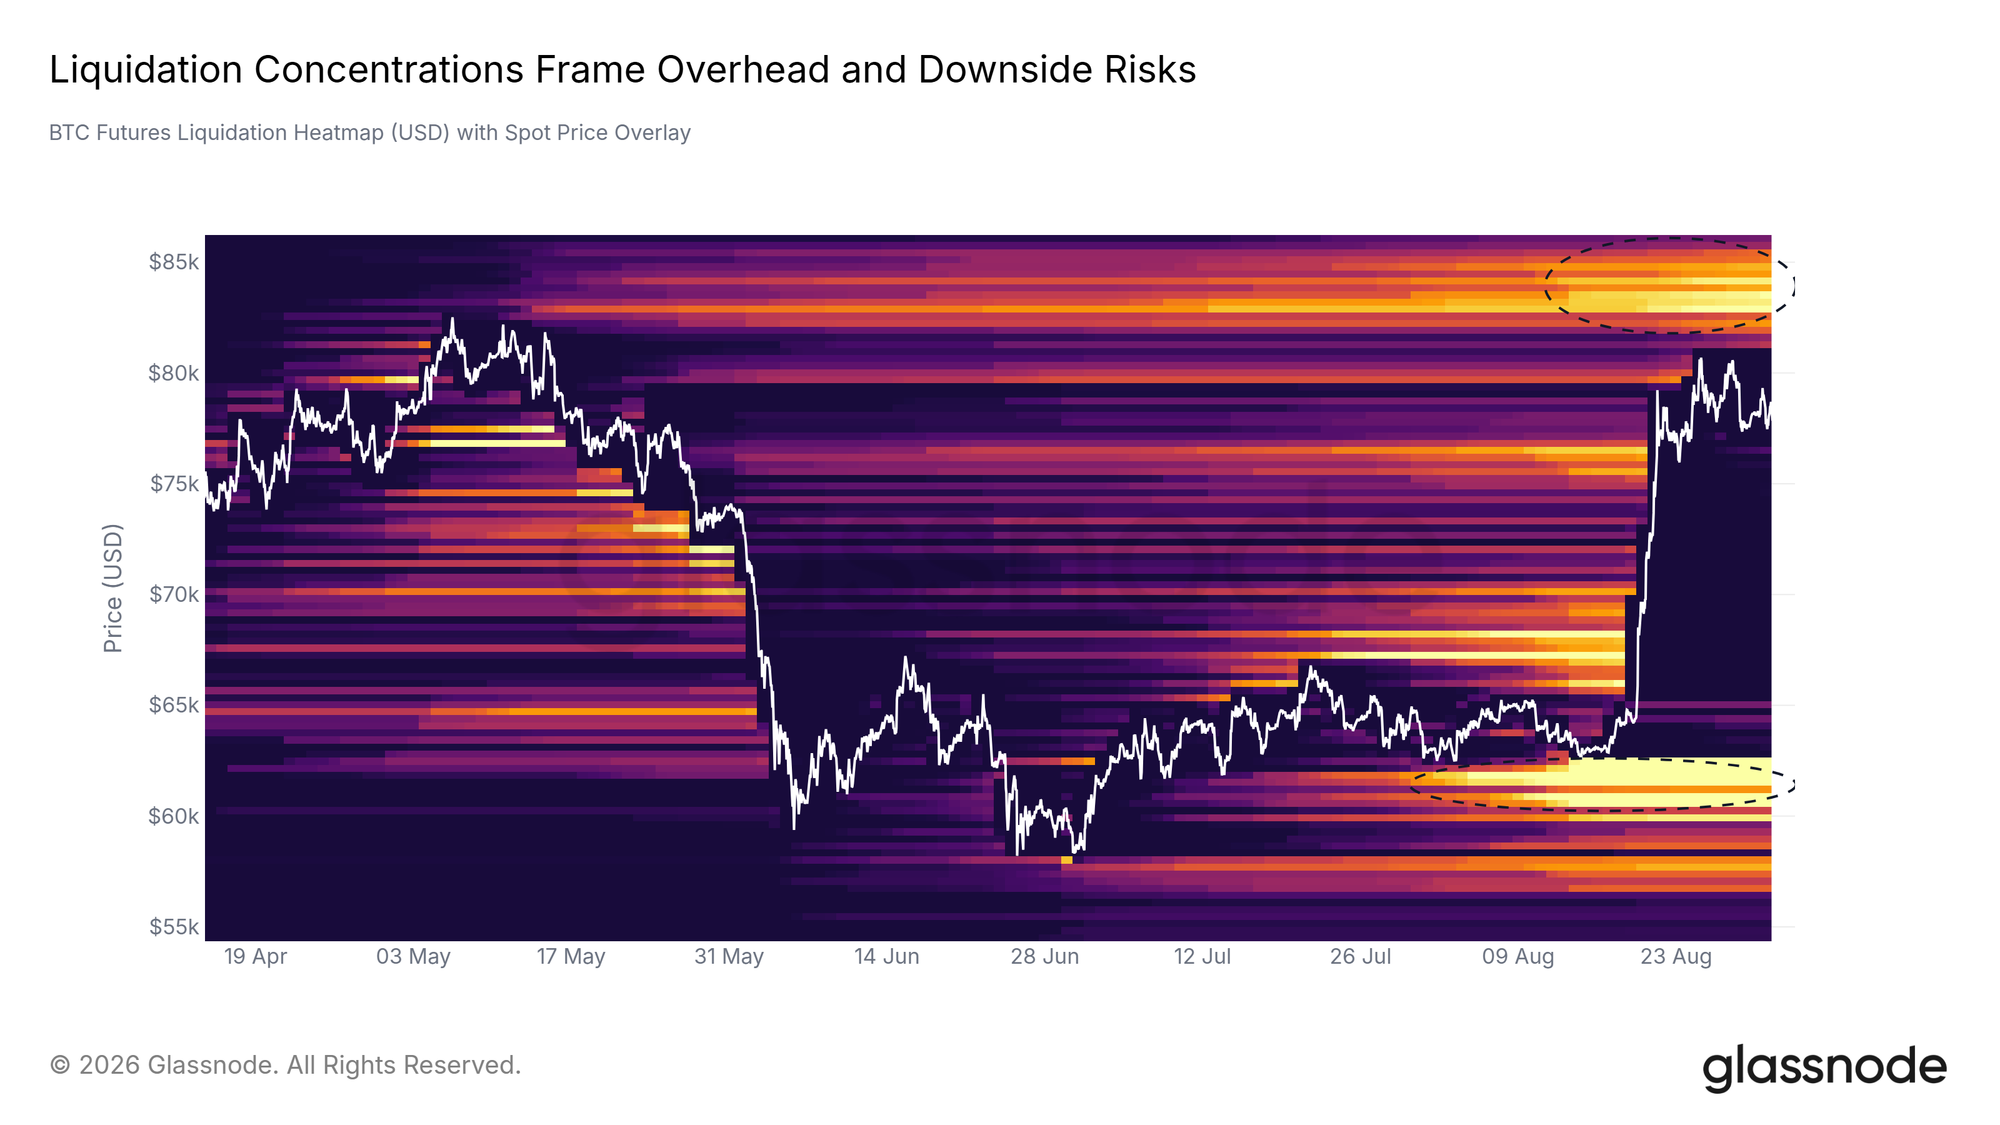
In the previous edition, we noted that while the August 19 short squeeze cleared substantial leverage, the advance was running directly into dense overhead structure. That dynamic materialized over the past week. After pushing above $80K on August 27, price met steady supply and turned lower toward $76K, triggering a sequence of long liquidations.
The futures liquidation heatmap demonstrates the bilateral structure bracketing price. While the upward impulse consumed short orders in its path, it stopped short of the dense cluster of short liquidations situated between $83K and $86K. Below spot, the move left behind an intact band of long liquidation fuel between $60K and $63K. Price now trades between these two boundaries.
On-Chain Supply
The Profit Overhang
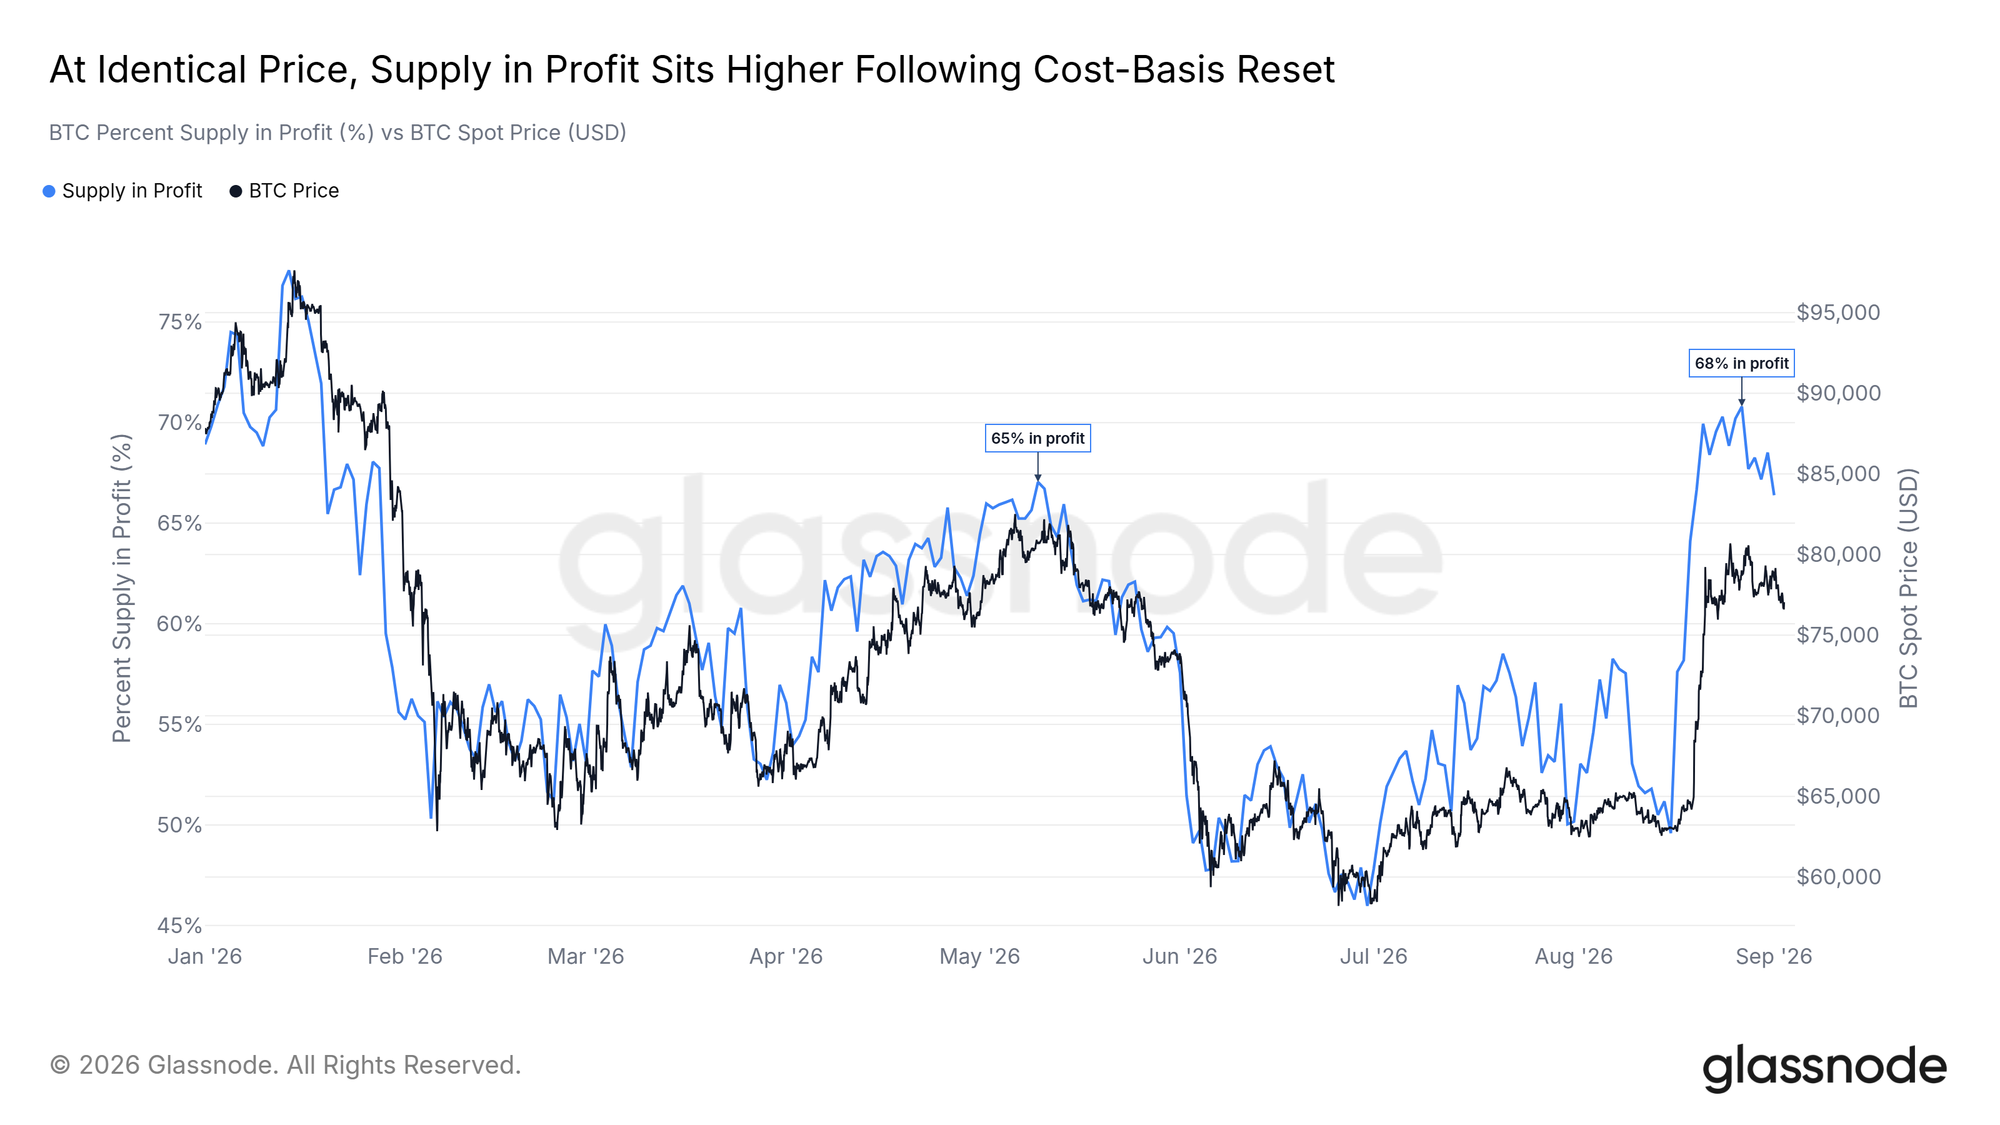
A subtle friction facing this recovery appears in the distribution of network profitability. When Bitcoin traded near $78K in May, roughly 65% of supply was held in profit. When spot returned to the identical level in late August, the share of supply in profit climbed to 68%.
This shift reflects summer accumulation that reset the Short-Term Holder Cost Basis near $71K. Identical nominal prices now activate a larger volume of profitable coins, creating an expanded pool of latent sell-side liquidity when spot tests prior highs.
Defined Range Boundaries
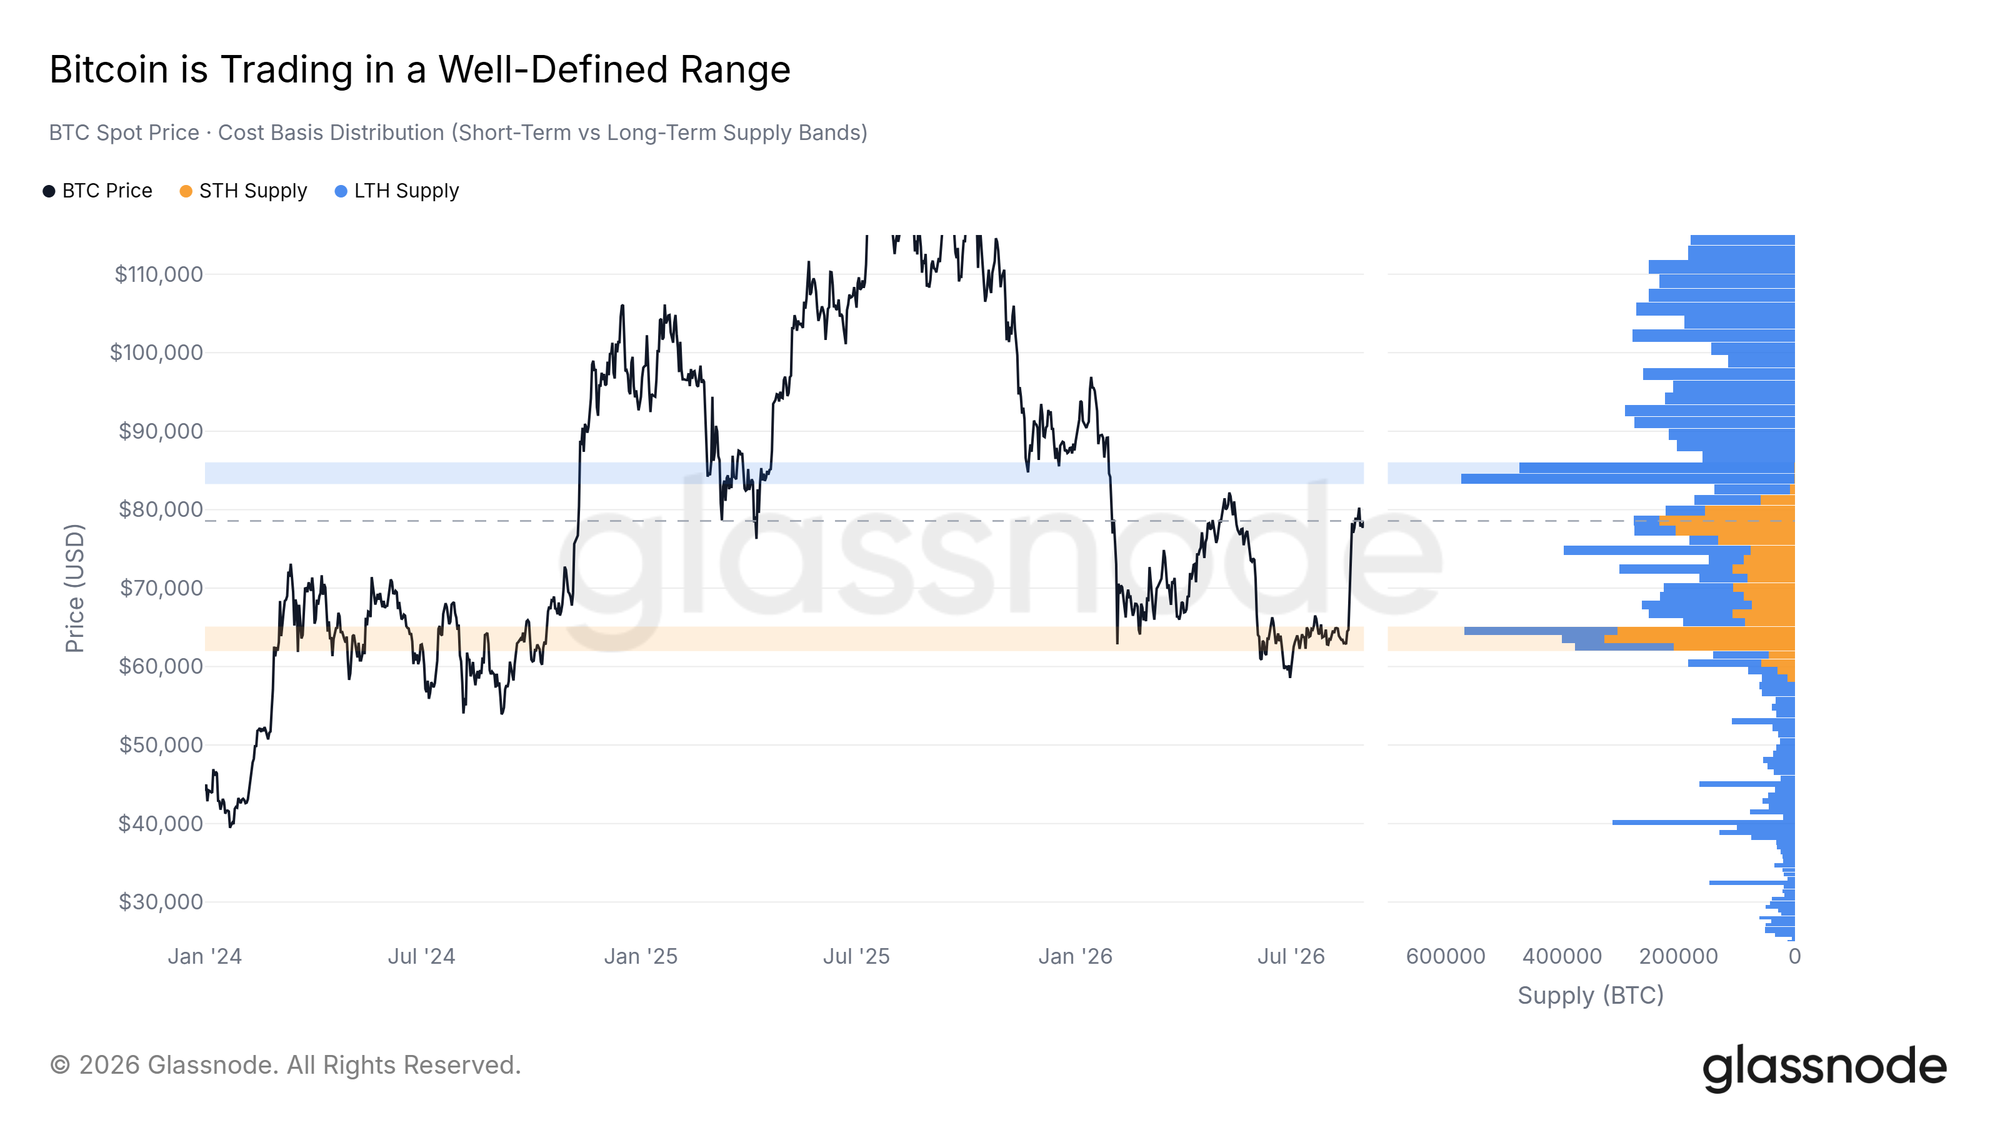
Combining on-chain cost basis models with the coin distribution profile establishes clear structural bands.
Below current spot, the summer consolidation provides a firm accumulation floor between $62K and $65K. Overhead, the market confronts heavy Long-Term Holder supply between $83K and $86K. Spot remains contained between these two zones.
Institutional Rails
Muted Turnover
US spot Bitcoin ETFs absorbed steady capital through the rally, lifting their seven-day average intake to $290M per day.
Secondary trading activity, however, told a quieter story. Daily ETF trading volume held near $3B per day, far below the activity that accompanied earlier expansionary phases. Inflows driven by discrete policy headlines that lack broader market velocity often coincide with local inflection points that retrace once the immediate catalyst clears.
Macro Backdrop
Sovereign Yields Rebound
The broader macroeconomic environment has quickly resumed its restrictive stance. Following the Treasury buyback announcement on August 19, which temporarily pulled the US 10-Year yield down toward 4.6%, yields sharply reversed course.
Over the subsequent eight trading sessions, the 10-Year yield climbed back to 4.8%, printing fresh cycle highs. The rapid reversal indicates that sovereign debt pressures remain the primary driver of global discount rates.
Transient Equity Decorrelation
During the initial impulse, Bitcoin decoupled briefly from traditional equities as US stock indices traded flat.
The rolling 30-session correlation between Bitcoin and the S&P 500 fell toward zero. Historically, sudden decorrelations during sovereign bond selloffs have tended to be short-lived phenomena marking local exhaustion rather than structural regime shifts.

Derivatives and Expiries
Sentiment Cools from Euphoria
Options markets capture the rapid psychological rotation of the past fortnight. The 7-day 25-delta skew index spiked sharply during the squeeze as market participants chased upside calls, before rapidly mean-reverting back toward neutral as resistance held.
Longer-dated 180-day skew remained steady throughout the move, showing that while short-term enthusiasm has cooled, structural demand for long-term optionality remains intact.
The September Expiry Barrier
The forward options landscape is dominated by the September 25 quarter-end expiration, which represents roughly $14B in open interest across Deribit and IBIT.
With substantial open interest clustered at strikes above $80K, the approaching quarter-end expiry represents a significant volatility and positioning anchor for the weeks ahead.
Conclusion
The relief rally that followed the August short squeeze has stalled beneath the $83K-$86K supply band. With network profitability sitting higher at comparable prices, sovereign bond yields setting fresh cycle highs, and options markets resetting back to neutral, the market remains bounded within its established range. Until the overhead ceiling is absorbed, the structural floor between $62K and $65K defines the primary downside reference.
Disclaimer: This report does not provide any investment advice. All data is provided for informational and educational purposes only. No investment decision shall be based on the information provided here, and you are solely responsible for your own investment decisions.
Exchange balances presented are derived from Glassnode’s comprehensive database of address labels, which are amassed through both officially published exchange information and proprietary clustering algorithms. While we strive to ensure the utmost accuracy in representing exchange balances, it is important to note that these figures might not always encapsulate the entirety of an exchange’s reserves, particularly when exchanges refrain from disclosing their official addresses. We urge users to exercise caution and discretion when utilizing these metrics. Glassnode shall not be held responsible for any discrepancies or potential inaccuracies.
