Coinbase + Glassnode: Charting Crypto Q4 2026
The Q4 2026 edition of Charting Crypto, our quarterly report with Coinbase Institutional, reads the market and on-chain data behind bitcoin's early recovery and sets out the outlook into year-end.


Bitcoin moved from a bottoming process into an early recovery in the third quarter, even as the Fed resumed tightening and long-term Treasury yields climbed. The Q4 2026 edition of Charting Crypto, our quarterly report with Coinbase Institutional, reads that recovery in three passes: the macro backdrop and fund flows, bitcoin's on-chain and derivatives data, and Ethereum's market and network activity. Its outlook for the quarter is constructive, with reasons for near-term caution. The charts combine Glassnode on-chain data with market and macro data through the end of September.
The full report is freely available for download in PDF format.
Sentiment has recovered without becoming stretched
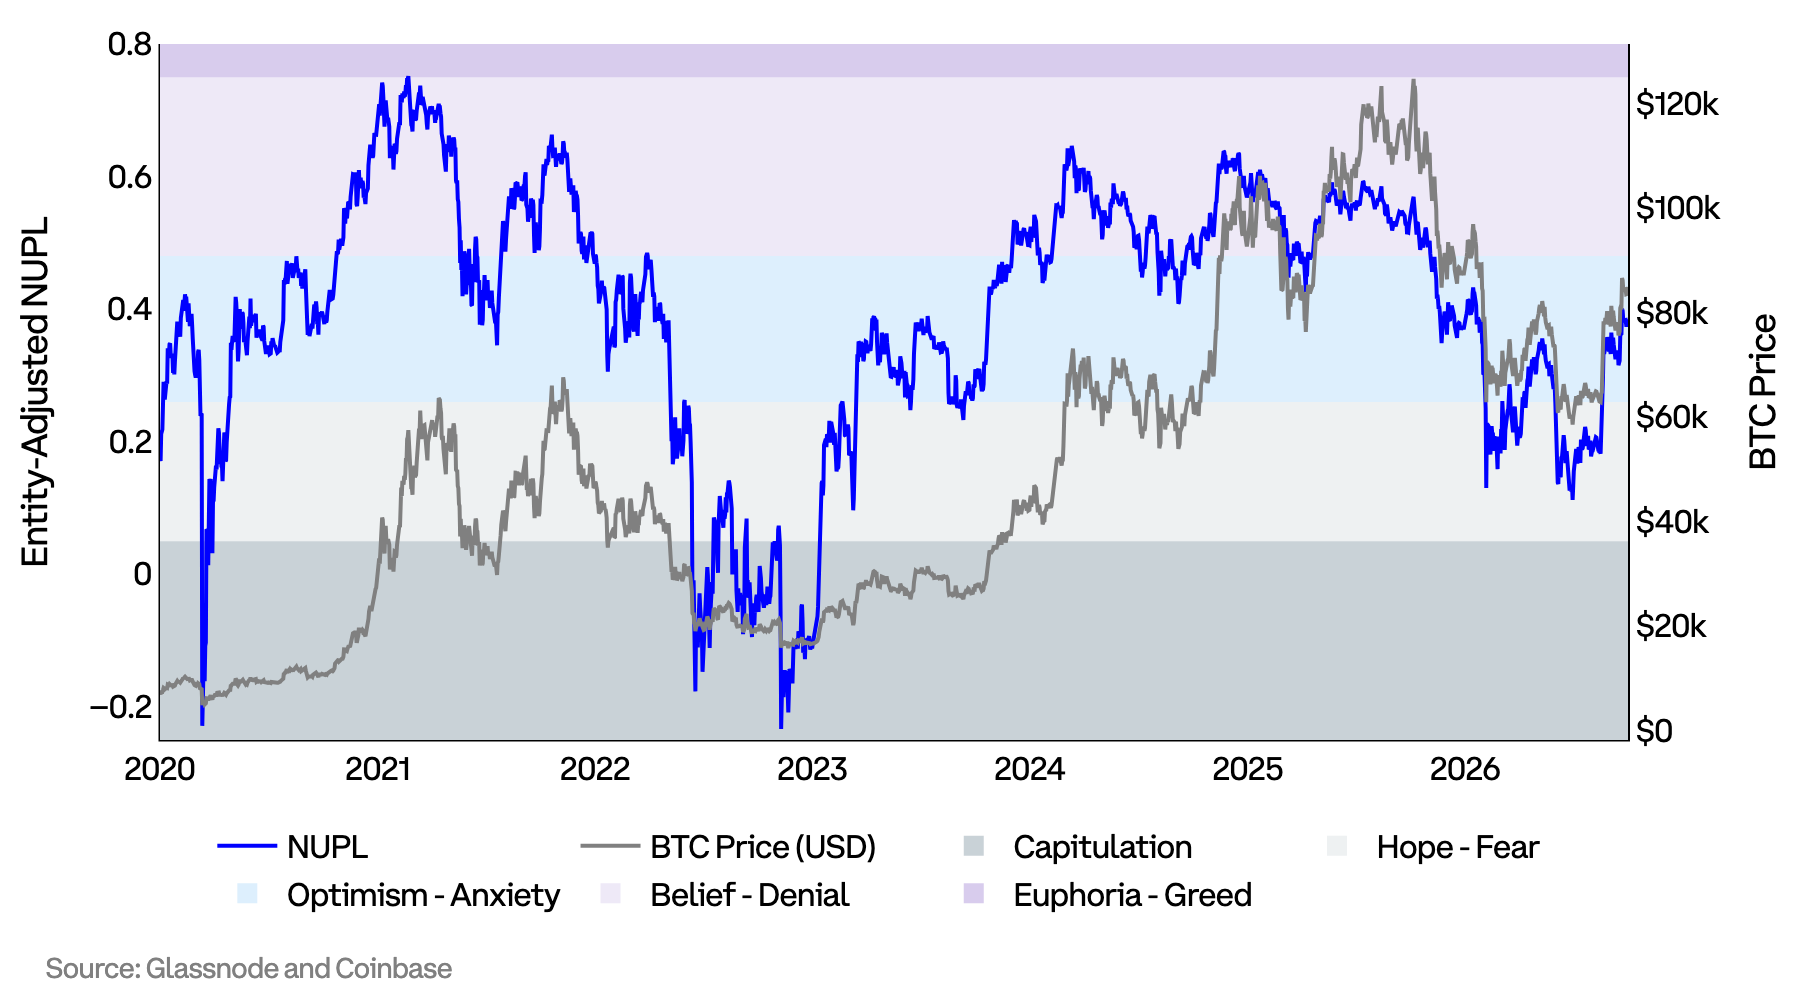
Net unrealized profit/loss (NUPL), a measure of the paper profit or loss held across the bitcoin supply, climbed back into the Optimism/Anxiety band during the quarter and remains well below the Belief/Denial threshold.
Long-term holders largely held through the rally
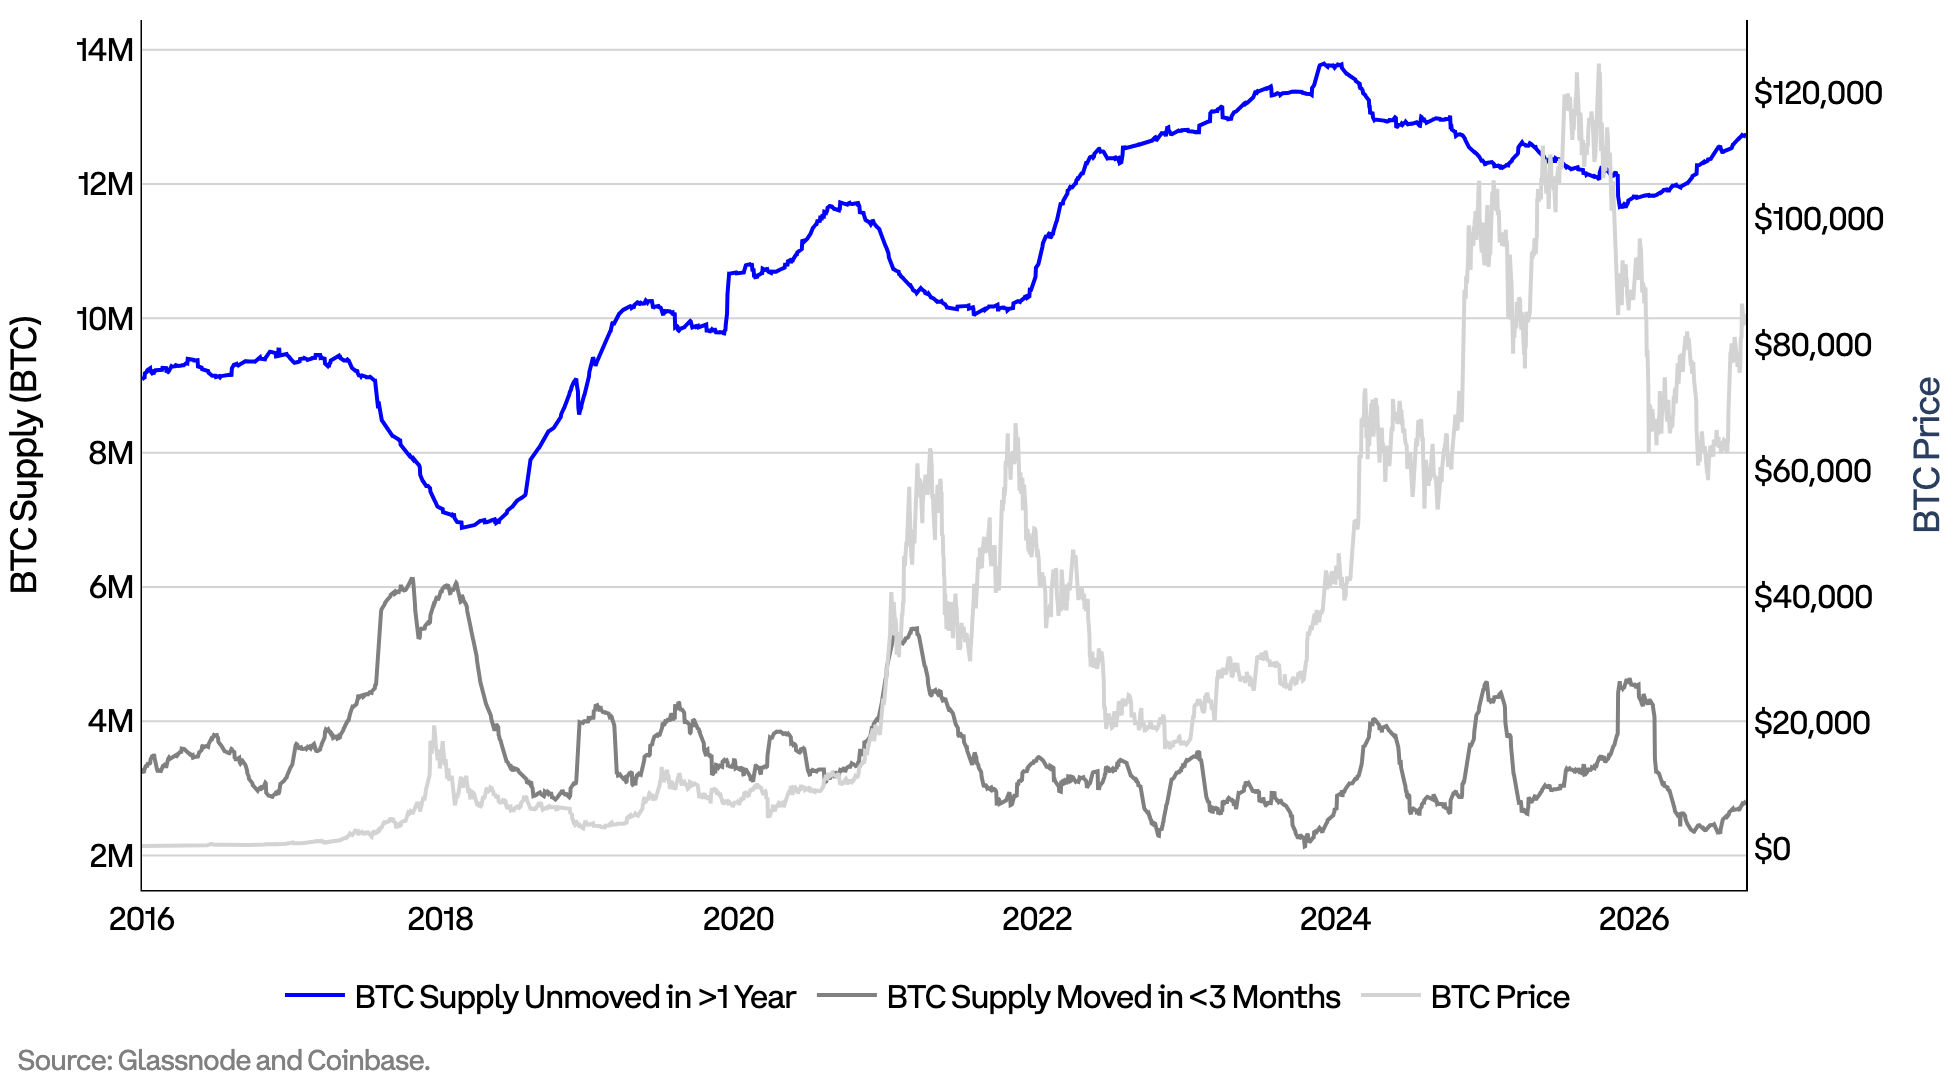
Supply dormant for more than a year kept growing as bitcoin rallied, while the rally drew recently moved coins back into circulation as newer participants returned.
A dense band of supply sits just above spot
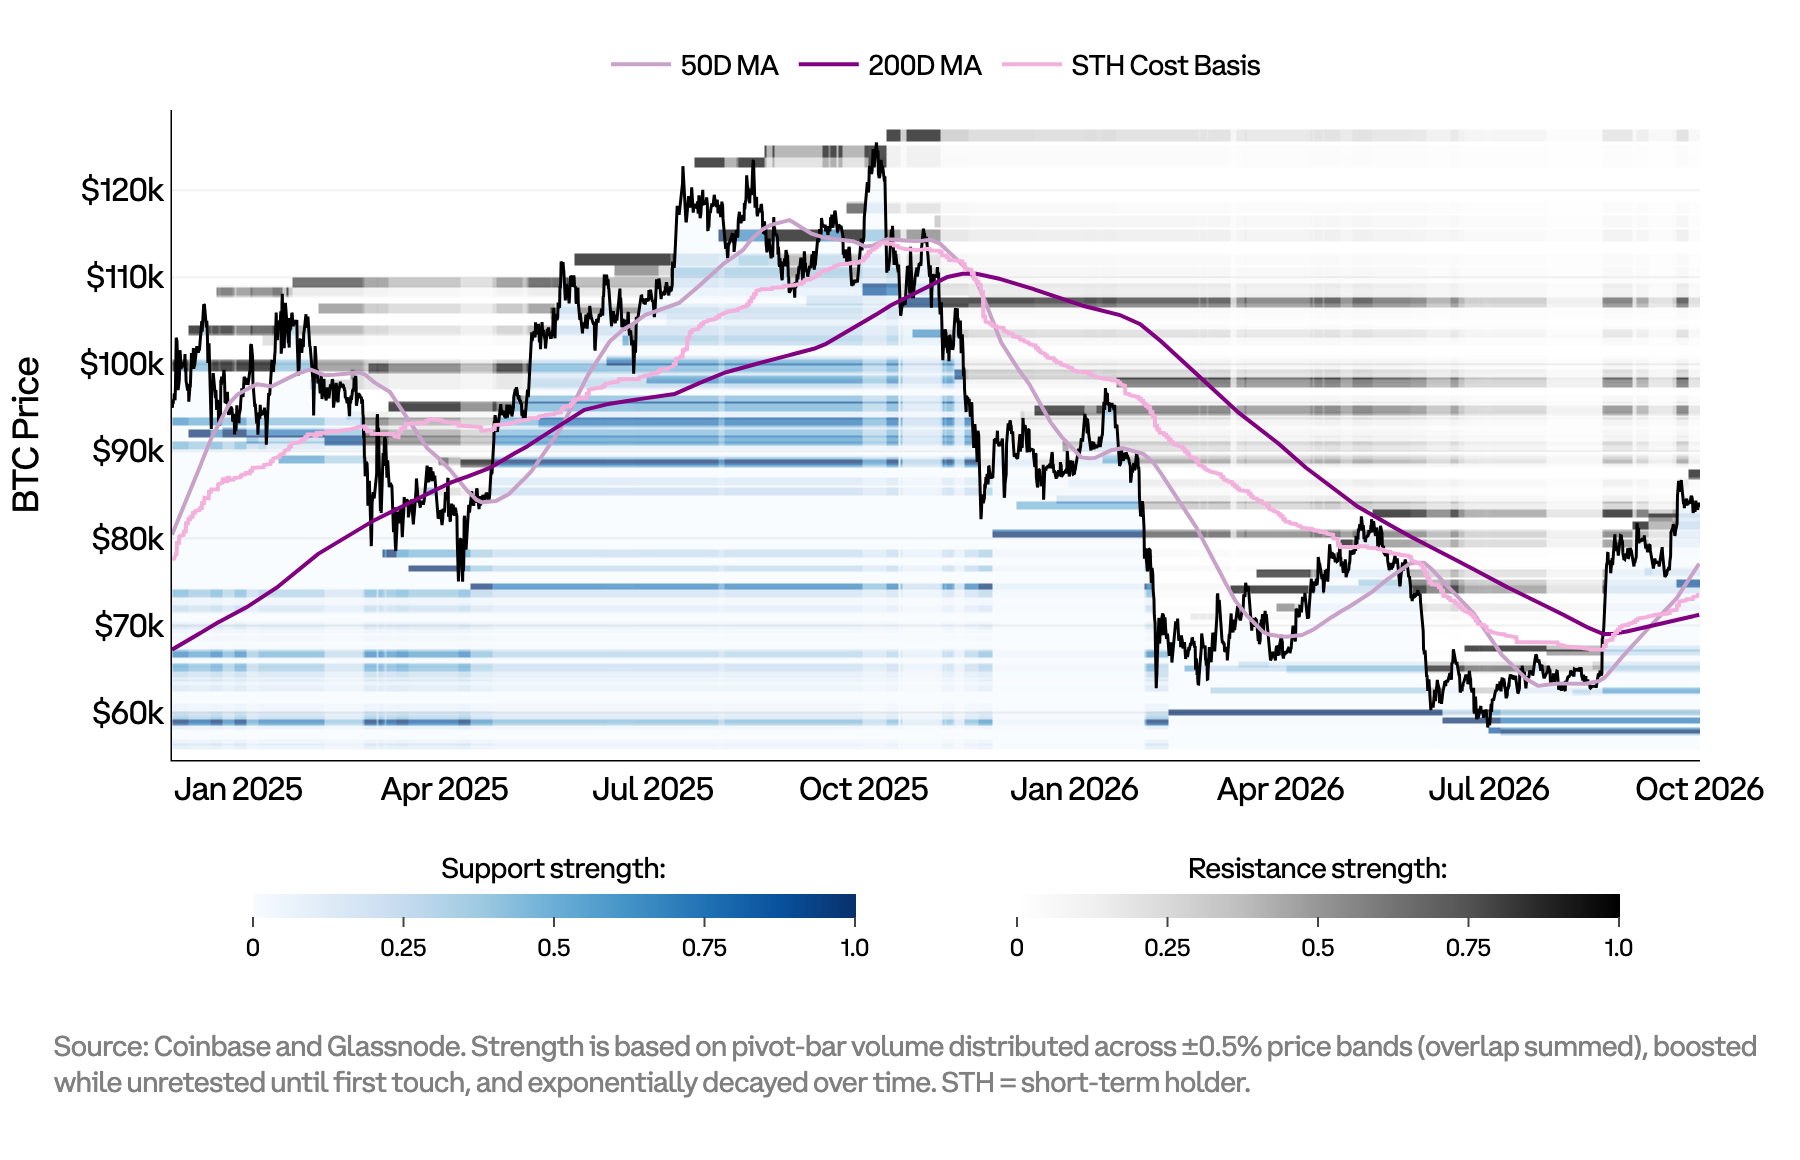
A new support and resistance heatmap shows the zone that capped the September highs, heavier cost-basis supply just above it, and several overlapping layers of support below spot.
What else the report covers
- The topline view for the quarter, and the factors that would change it
- The macro backdrop: bitcoin's correlations with gold, equities, the dollar and Treasury yields
- Spot ETF flows and stablecoin liquidity
- A new indicator map that screens hundreds of on-chain and macro series for their link to bitcoin's returns over the following month
- Valuation, miner revenue and derivatives positioning
- Ethereum: sentiment, supply, ETF flows, DeFi and L2 activity
To explore the data and insights, download the full analysis in PDF format.
Disclaimer: This report does not provide any investment advice. All data is provided for information and educational purposes only. No investment decision shall be based on the information provided here and you are solely responsible for your own investment decisions. We urge users to exercise caution and discretion when utilizing these metrics. Glassnode shall not be held responsible for any discrepancies or potential inaccuracies.
- Follow us on X for timely market updates and analysis
- Join our Telegram channel
- For on-chain metrics, dashboards, and alerts, visit Glassnode Studio
