BTC Market Pulse: Week 36
BTC holds near $78,300 after rallying from $64k lows. Institutional inflows stay strong, but rising leverage, tight volatility spreads, and softening retail activity point to a cautious, transitional market.



Overview
Bitcoin trades near $78,300, holding onto most of its sharp late-August rally from the $64,000 range after a strong breakout above $80,000. The broader digital asset market shows resilient institutional demand alongside localized cooling in spot and derivatives activity. Price momentum sits well above upper statistical thresholds, but secondary market turnover and spot cumulative volume delta suggest an approaching shift in taker dynamics and softening retail participation.
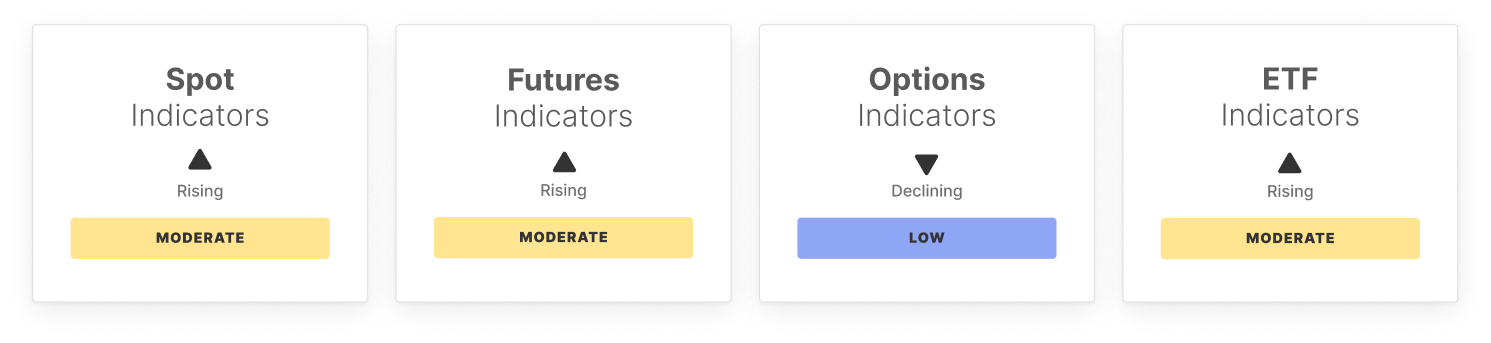
Traditional finance continues funneling capital into regulated vehicles. US spot ETF positions remain solidly profitable, with sustained weekly net inflows. At the same time, short-term, price-sensitive capital is entering the market, a trend that coincides with elevated options open interest and a sharp narrowing of volatility spreads, suggesting participants may be underpricing near-term volatility relative to actual price behavior.
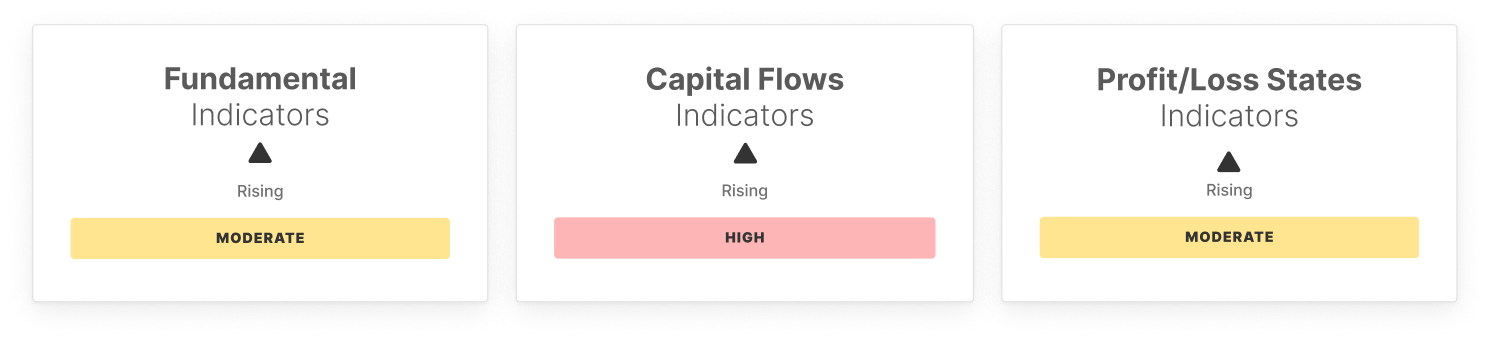
On-chain data tells a similar story: robust settlement activity paired with quieter user engagement. Entity-adjusted transfer volumes have risen well above normal ranges, even as daily active addresses and total fee volume dip modestly. Profitability metrics remain strong, with most of the circulating supply still holding unrealized gains and realized capitalization turning positive on a monthly basis.
In short, the market is in transition. Strong institutional allocation and healthy on-chain revaluation are counterbalanced by rising speculative leverage and early signs of short-term distribution.
Off-Chain Indicators
On-Chain Indicators
🔗 Access the full report in PDF

- Follow us and reach out on X
- Join our Telegram channel
- For on-chain metrics, dashboards, and alerts, visit Glassnode Studio
Disclaimer: This report does not provide any investment advice. All data is provided for information and educational purposes only. No investment decision shall be based on the information provided here and you are solely responsible for your own investment decisions.
Exchange balances presented are derived from Glassnode’s comprehensive database of address labels, which are amassed through both officially published exchange information and proprietary clustering algorithms. While we strive to ensure the utmost accuracy in representing exchange balances, it is important to note that these figures might not always encapsulate the entirety of an exchange’s reserves, particularly when exchanges refrain from disclosing their official addresses. We urge users to exercise caution and discretion when utilizing these metrics. Glassnode shall not be held responsible for any discrepancies or potential inaccuracies.
Please read our Transparency Notice when using exchange data.
