Paid to Wait
Treasuries out-yield the crypto carry trade for only the second time on record, and the downstream surfaces have gone quiet with it: spot volume at its lowest since 2019, exchange flows becalmed, the offer side of the book thinned out. The drawdown is shallow, and short of its predecessors' clock.

Executive Summary
- The bond market has stopped pricing cuts and started pricing a hike. The FOMC decides today.
- Treasuries out-yield the crypto carry trade, which helps explain why the marginal bid is parked in cash.
- Spot sits on the heaviest cost-basis shelf on the chart, the $69K break-even overhead.
- Shallowest bear on record so far by depth, and not yet as long as its predecessors.
- Exchange flows, spot volume and the ETF bid have all gone quiet together.
- Hedges were sold at the top of the rally and started coming back within the week.
- Buyers wait well below spot while the offer side has thinned. The Vector reads Risk Off.
Ready to get ahead of markets and sharpen your foresight? Try Glassnode. Sign up or talk to sales.
Macro Insight
A Lead Handed Back
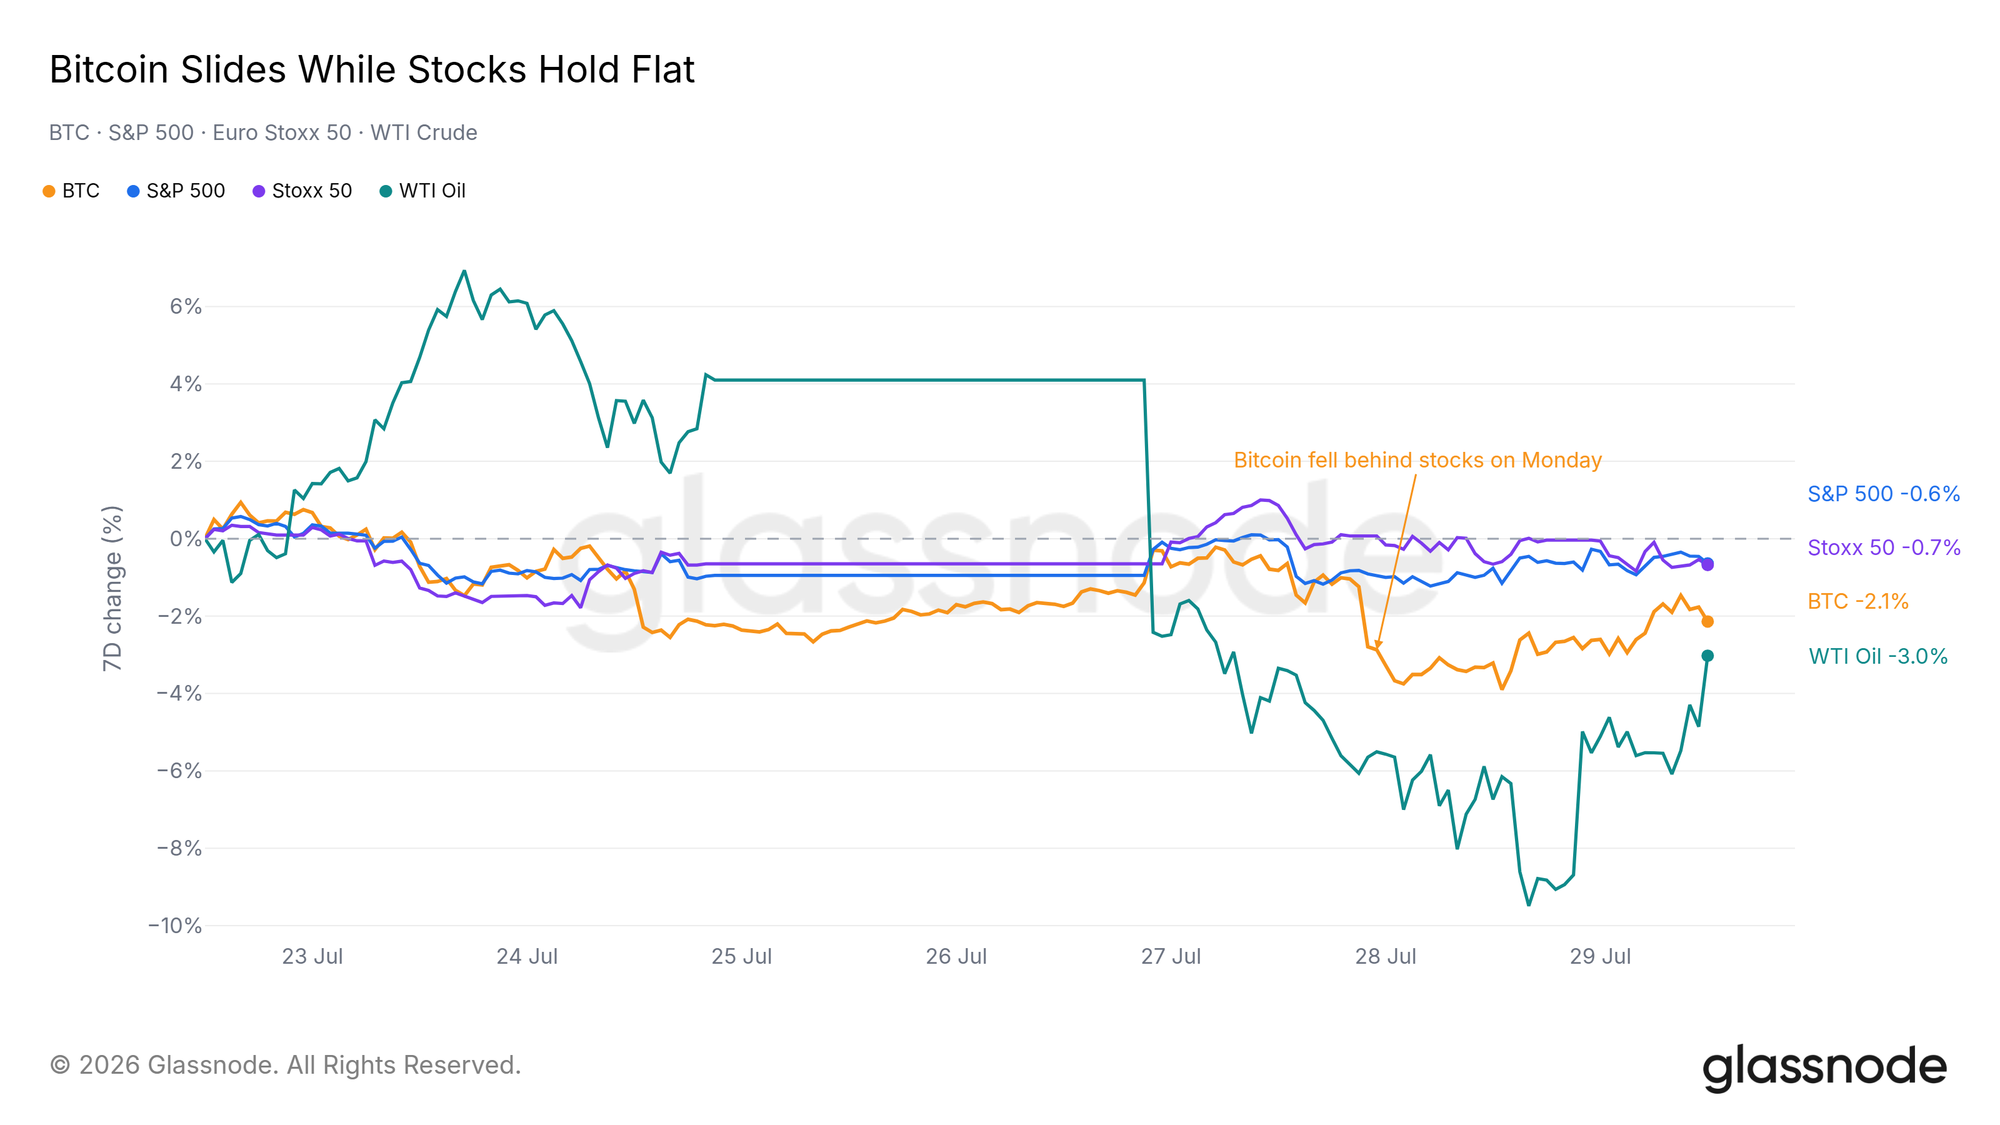
Last week Bitcoin outran the equity indices, absorbing an oil shock that left stocks flat and finishing ahead of both. That relative strength has faded. Bitcoin spent this week sliding while US and European stocks sat still, and the break came on Monday: from that session onward it has not been level with stocks again. Oil gave last week's spike back and ended the week the weakest of the four.
One week of relative weakness is not a regime change. It does take away one of the few things this market had going for it through the June repair, when Bitcoin was being bought on days equities did nothing.
The Bond Market Prices a Hike
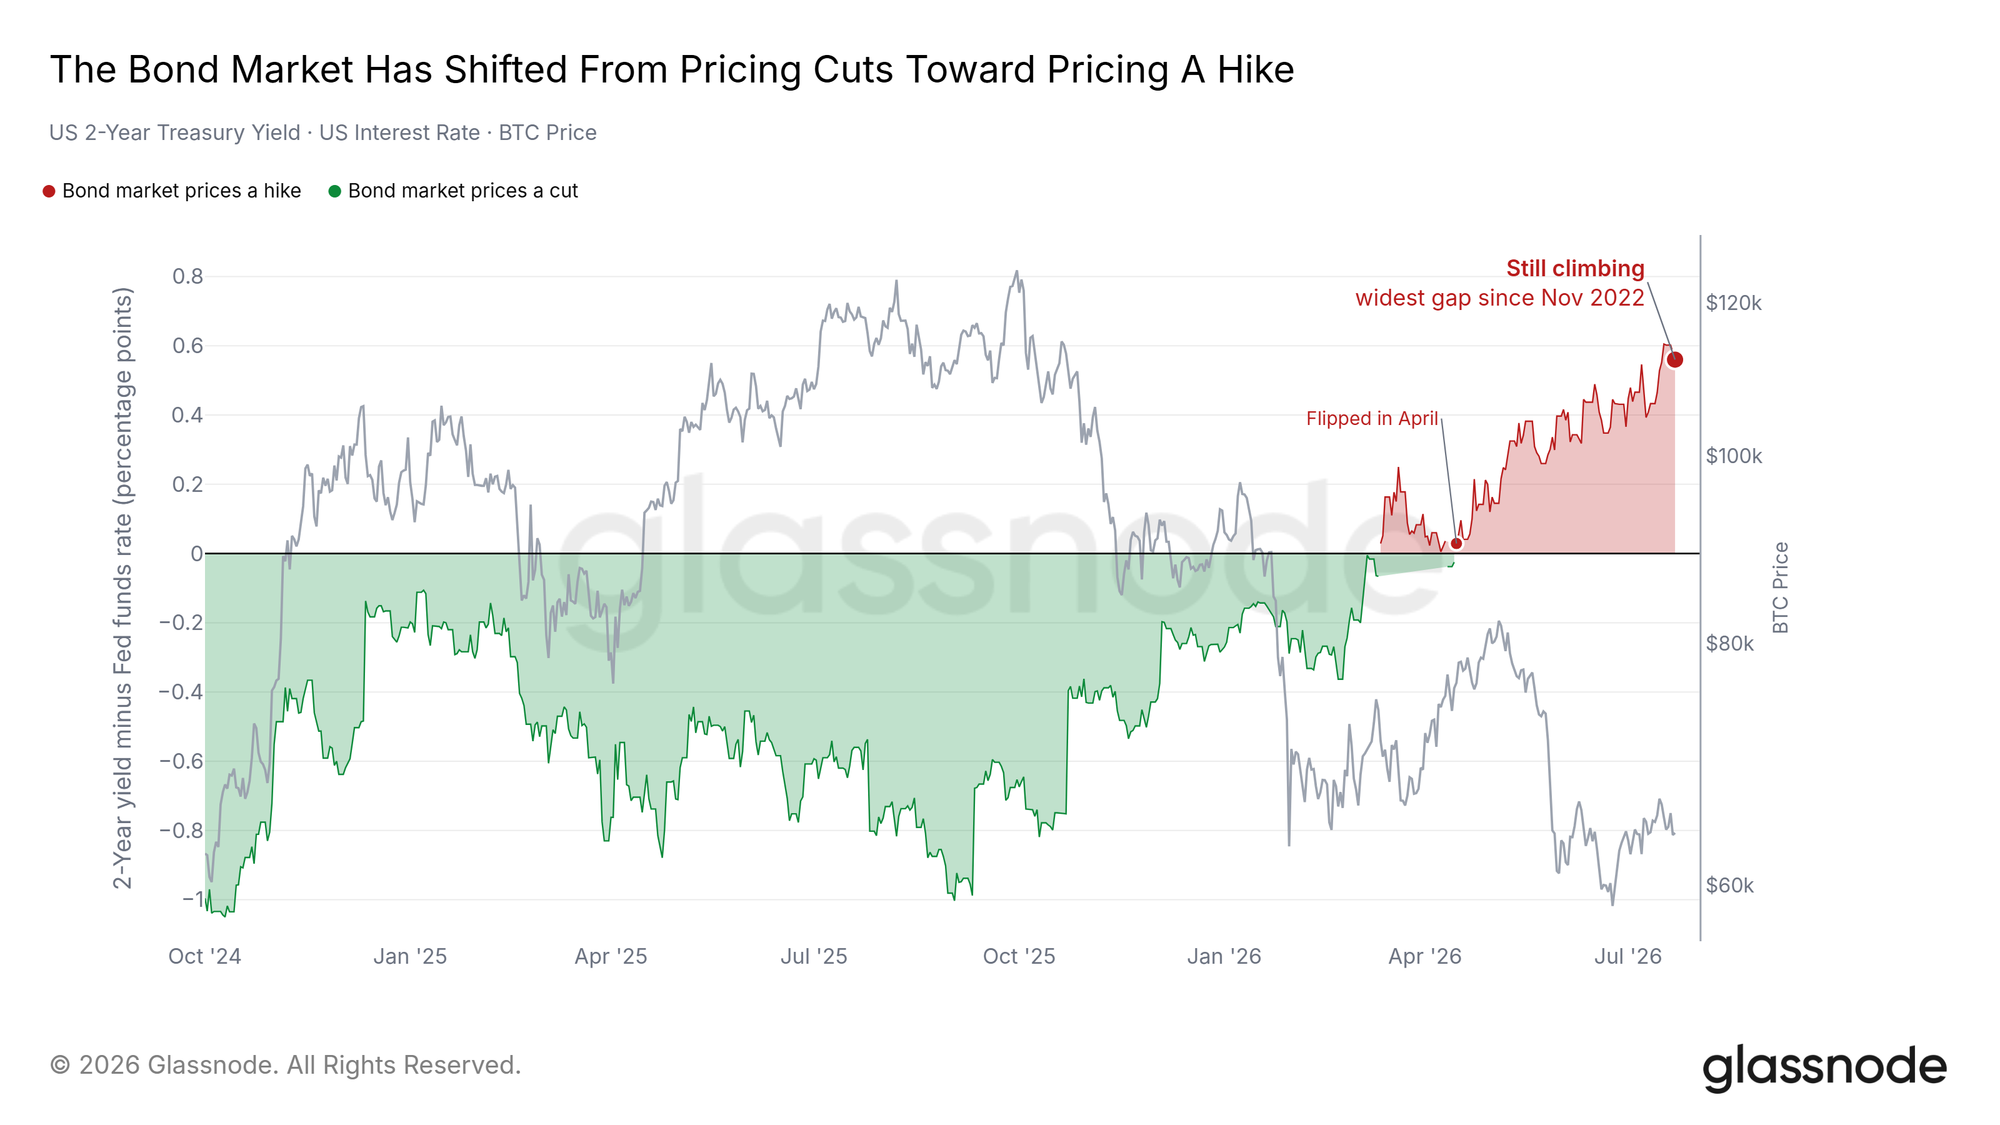
The FOMC decides today, and the bond market has already made up its mind. The 2-year Treasury yield, the cleanest read on where policy goes next, has been sitting above the Federal Funds Rate since April, and the gap is the widest it has been since November 2022. That is not the pricing of a market waiting for a cut; it leans toward the next move being a hike.
A cut today would surprise most of that positioning, and it would sit naturally alongside the soft core inflation print this report flagged last week. The reaction would matter more than the move: should the market fail to hold a bid on good news it was not expecting, that would say more about the absence of a marginal buyer than the decision itself.
Where the Bid Went
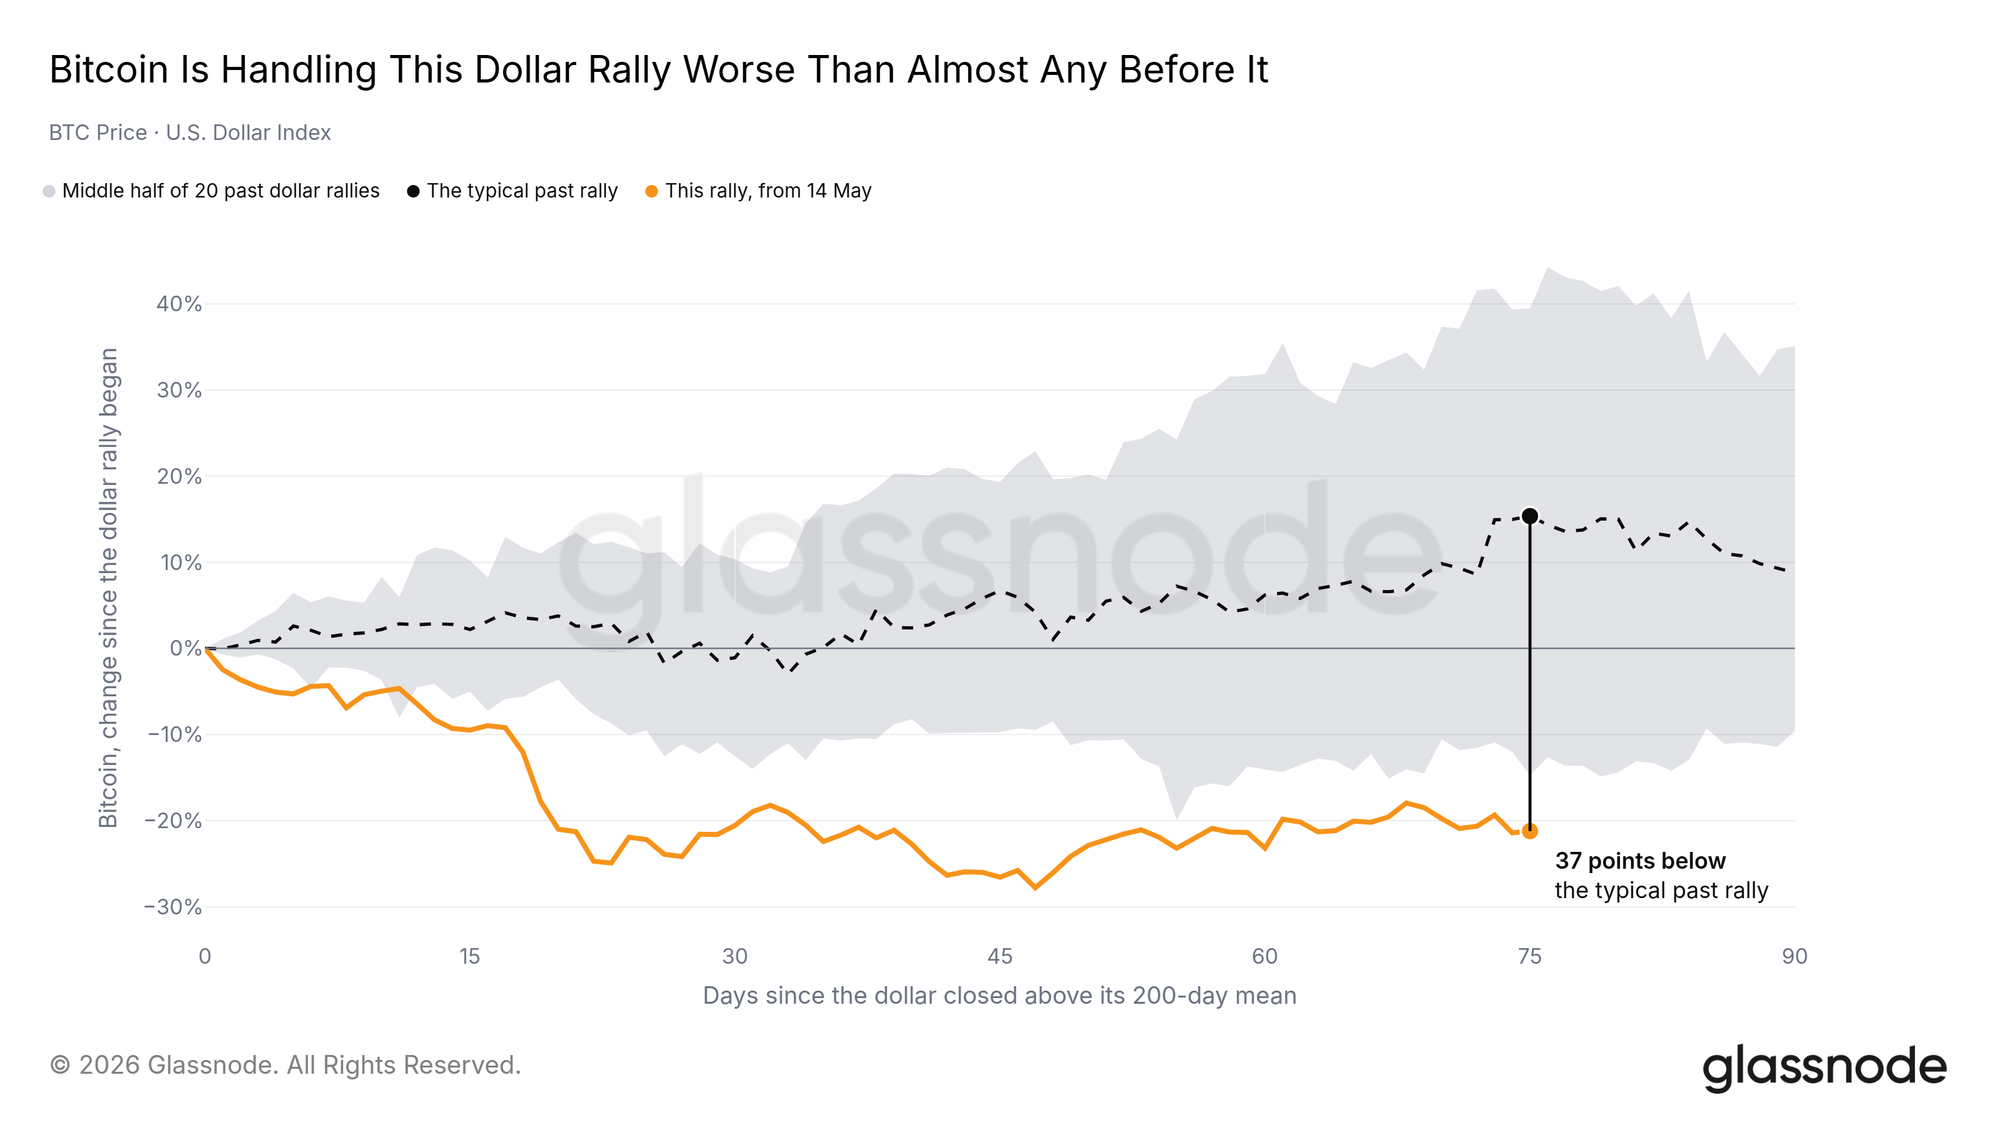
The dollar has been rallying since May, and Bitcoin is handling it worse than almost any dollar rally on record. The typical precedent since 2015 had Bitcoin higher by this point in the run. This time it is deep in the red, with 3 of the 20 past rallies worse.
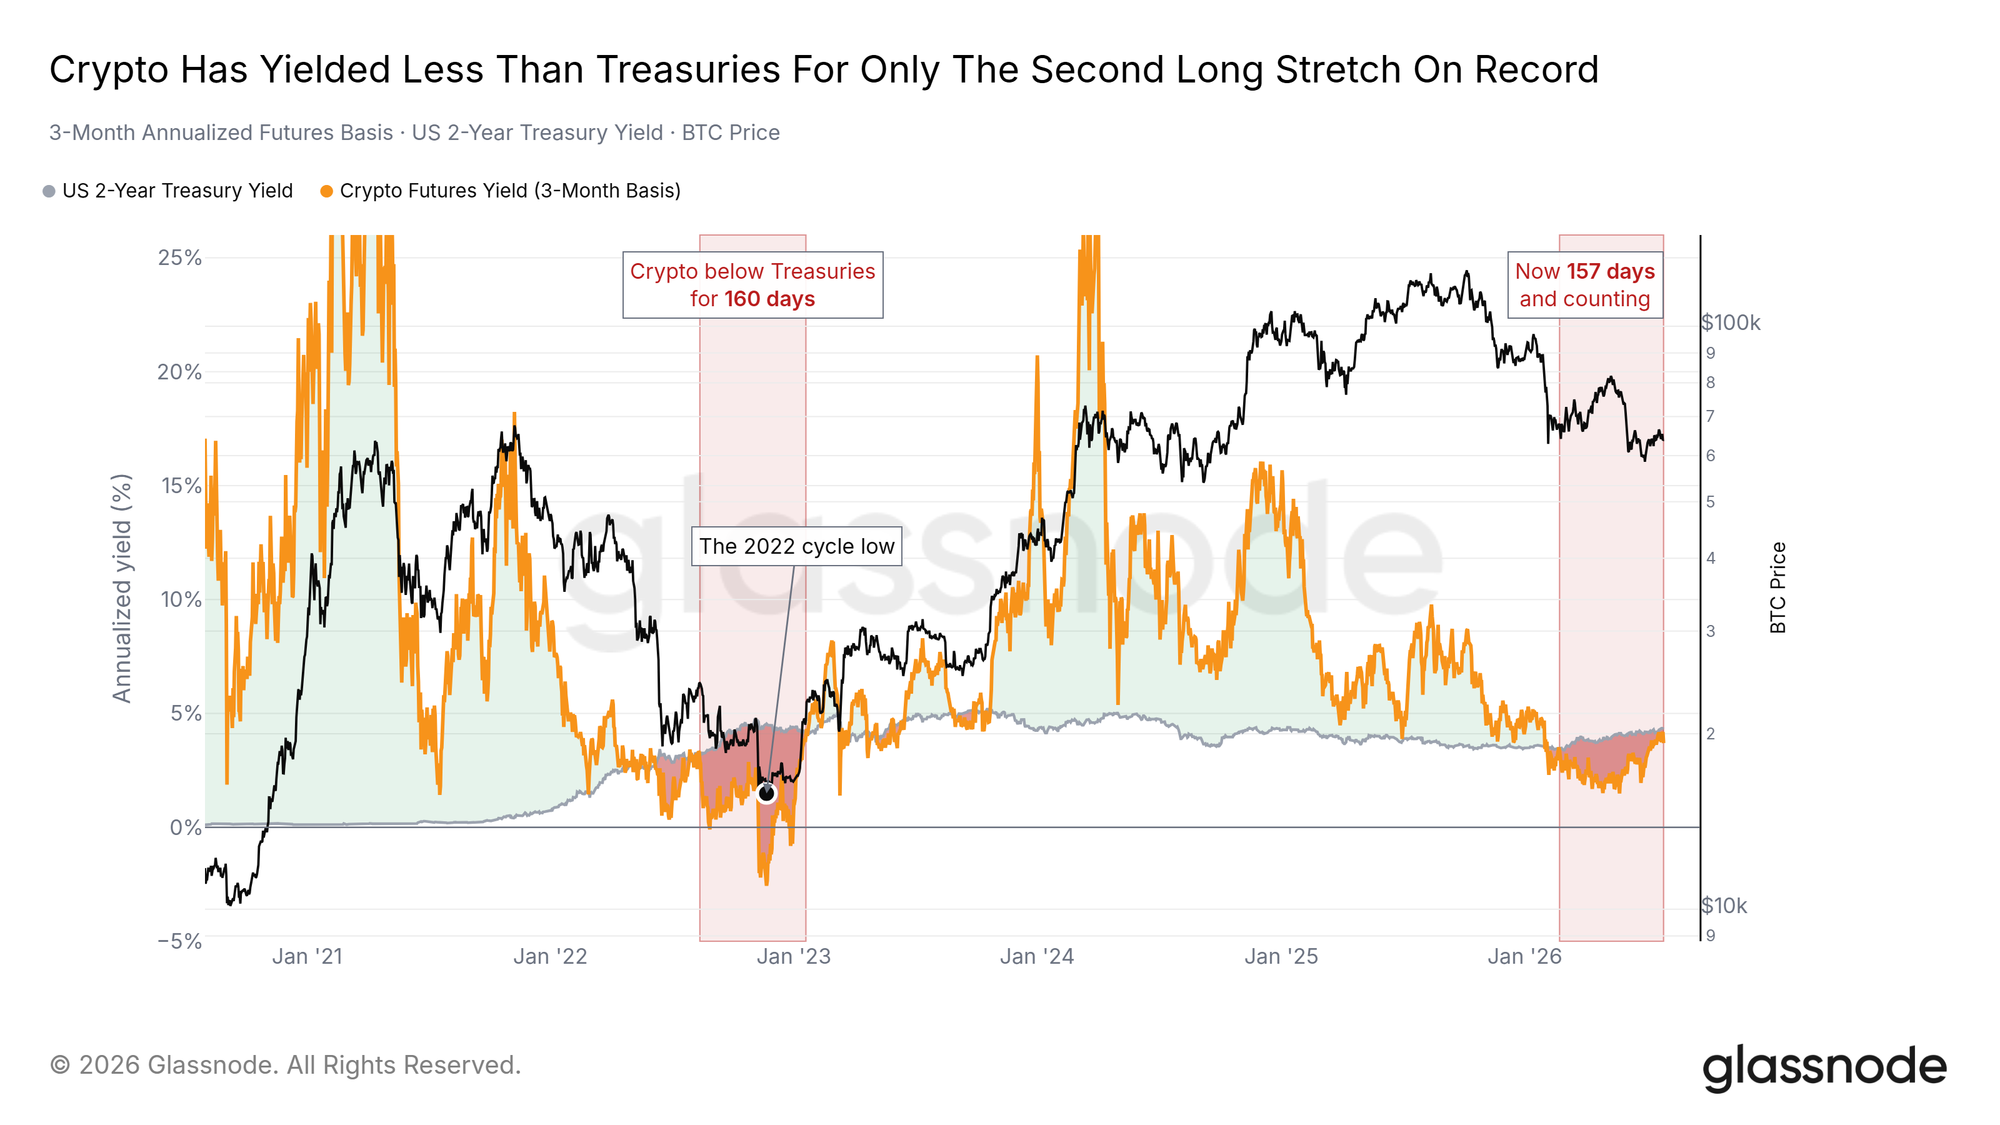
The second channel is more mechanical. Three-month futures basis, the yield on the cash-and-carry trade that anchors institutional participation in crypto, has been paying less than a 2-year Treasury since February. Only one other stretch on record has run this long, from August 2022 into January 2023, and it ended at the cycle low.
When Treasuries out-yield the basis, the desks that supply leverage, depth and volume to this market have little reason to be here. Much of what follows in the off-chain section looks downstream of that one spread.
On-chain Insight
Standing on the Heaviest Shelf
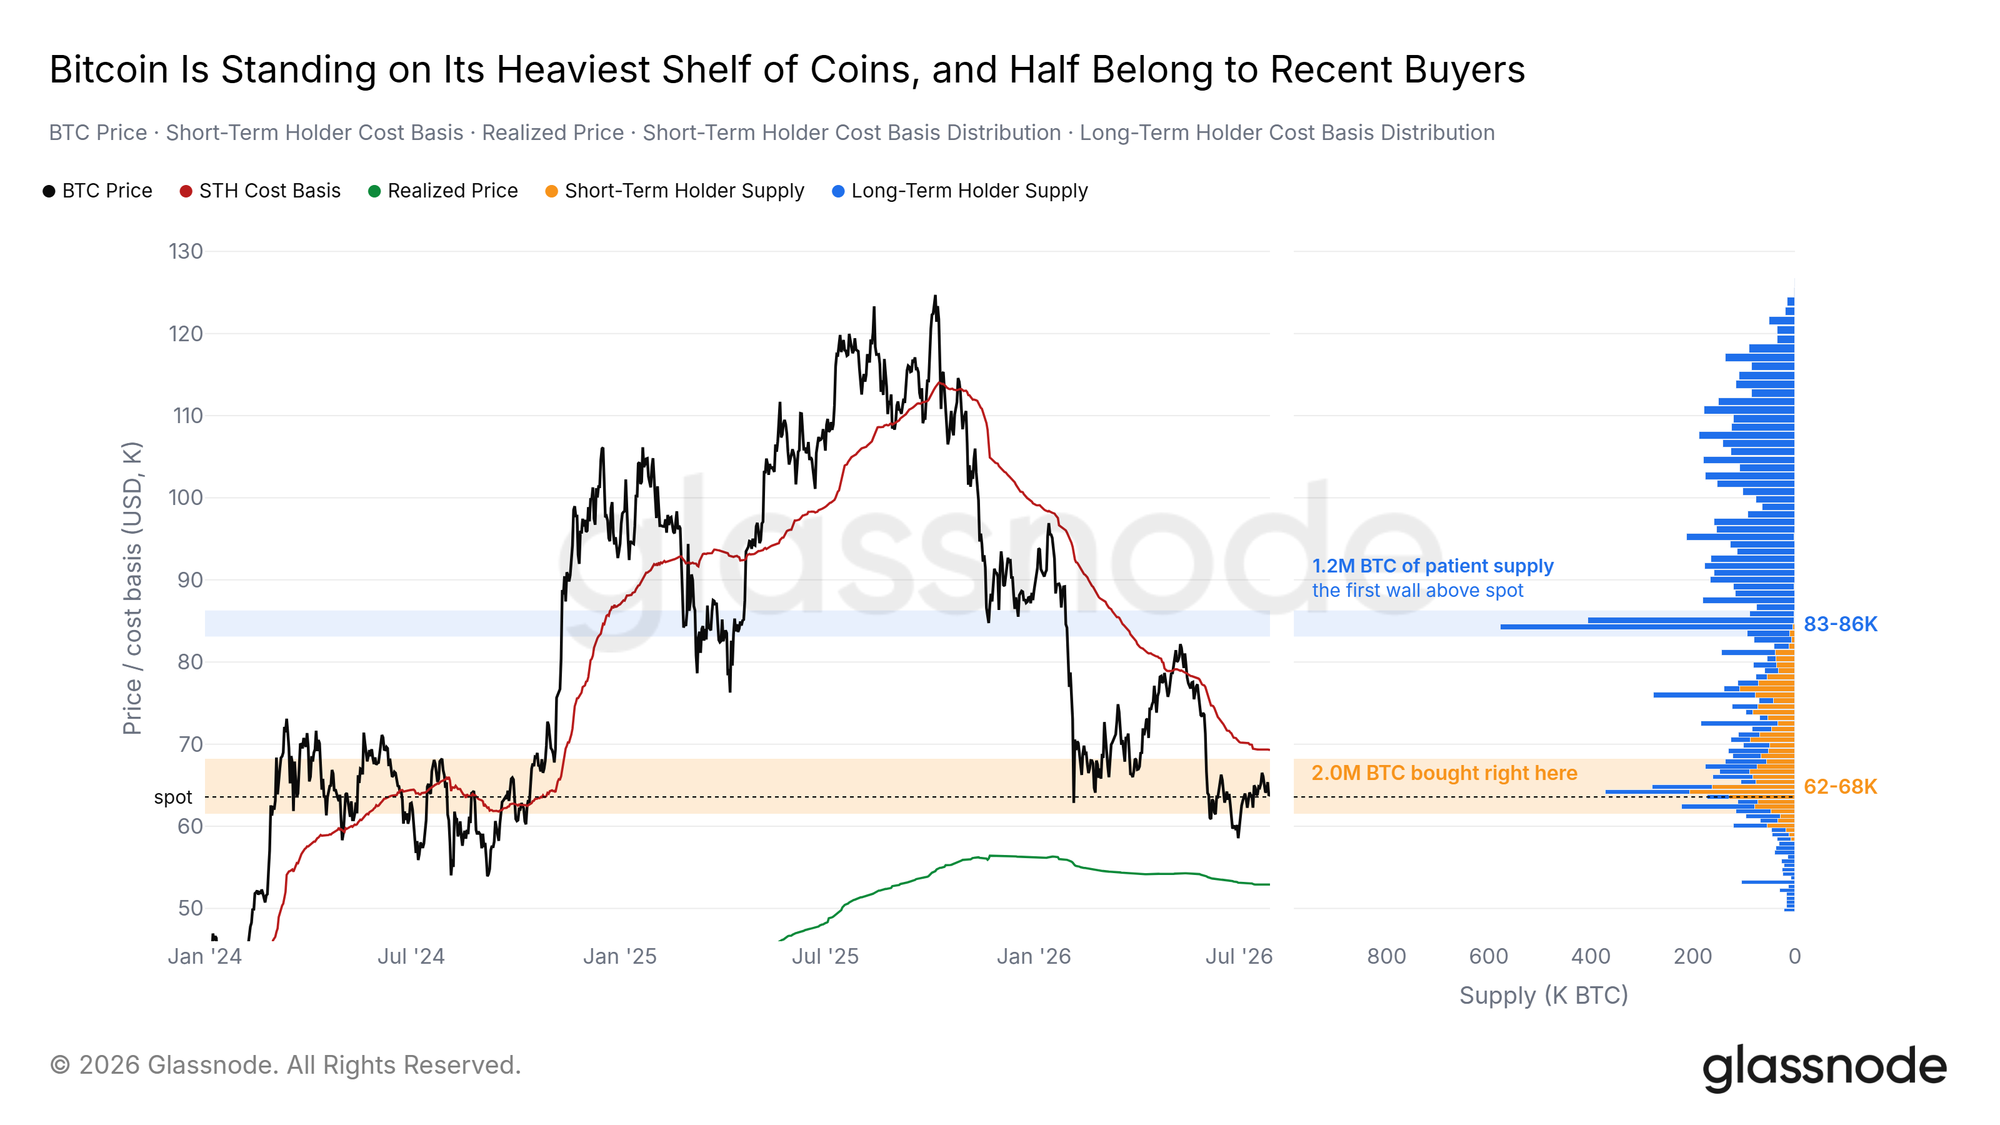
Bitcoin is trading inside the single heaviest cost-basis cluster in the profile, the band from roughly $62K to $68K where more coins last changed hands than anywhere else on the chart. It is split almost evenly. Half belongs to short-term holders who bought into this year's decline; half to long-term holders who have sat through it.
The long-term half is patient supply and tends to behave like a floor. The short-term half is the more reactive of the two, and most of that cohort is underwater, which typically makes it the first supply to move on a bounce. Overhead, the Short-Term Holder Cost Basis at $69K is still the line that decides the next leg, and the next real block of supply above it is the long-term holder wall between $83K and $86K.
Shallow, and Not Yet Late
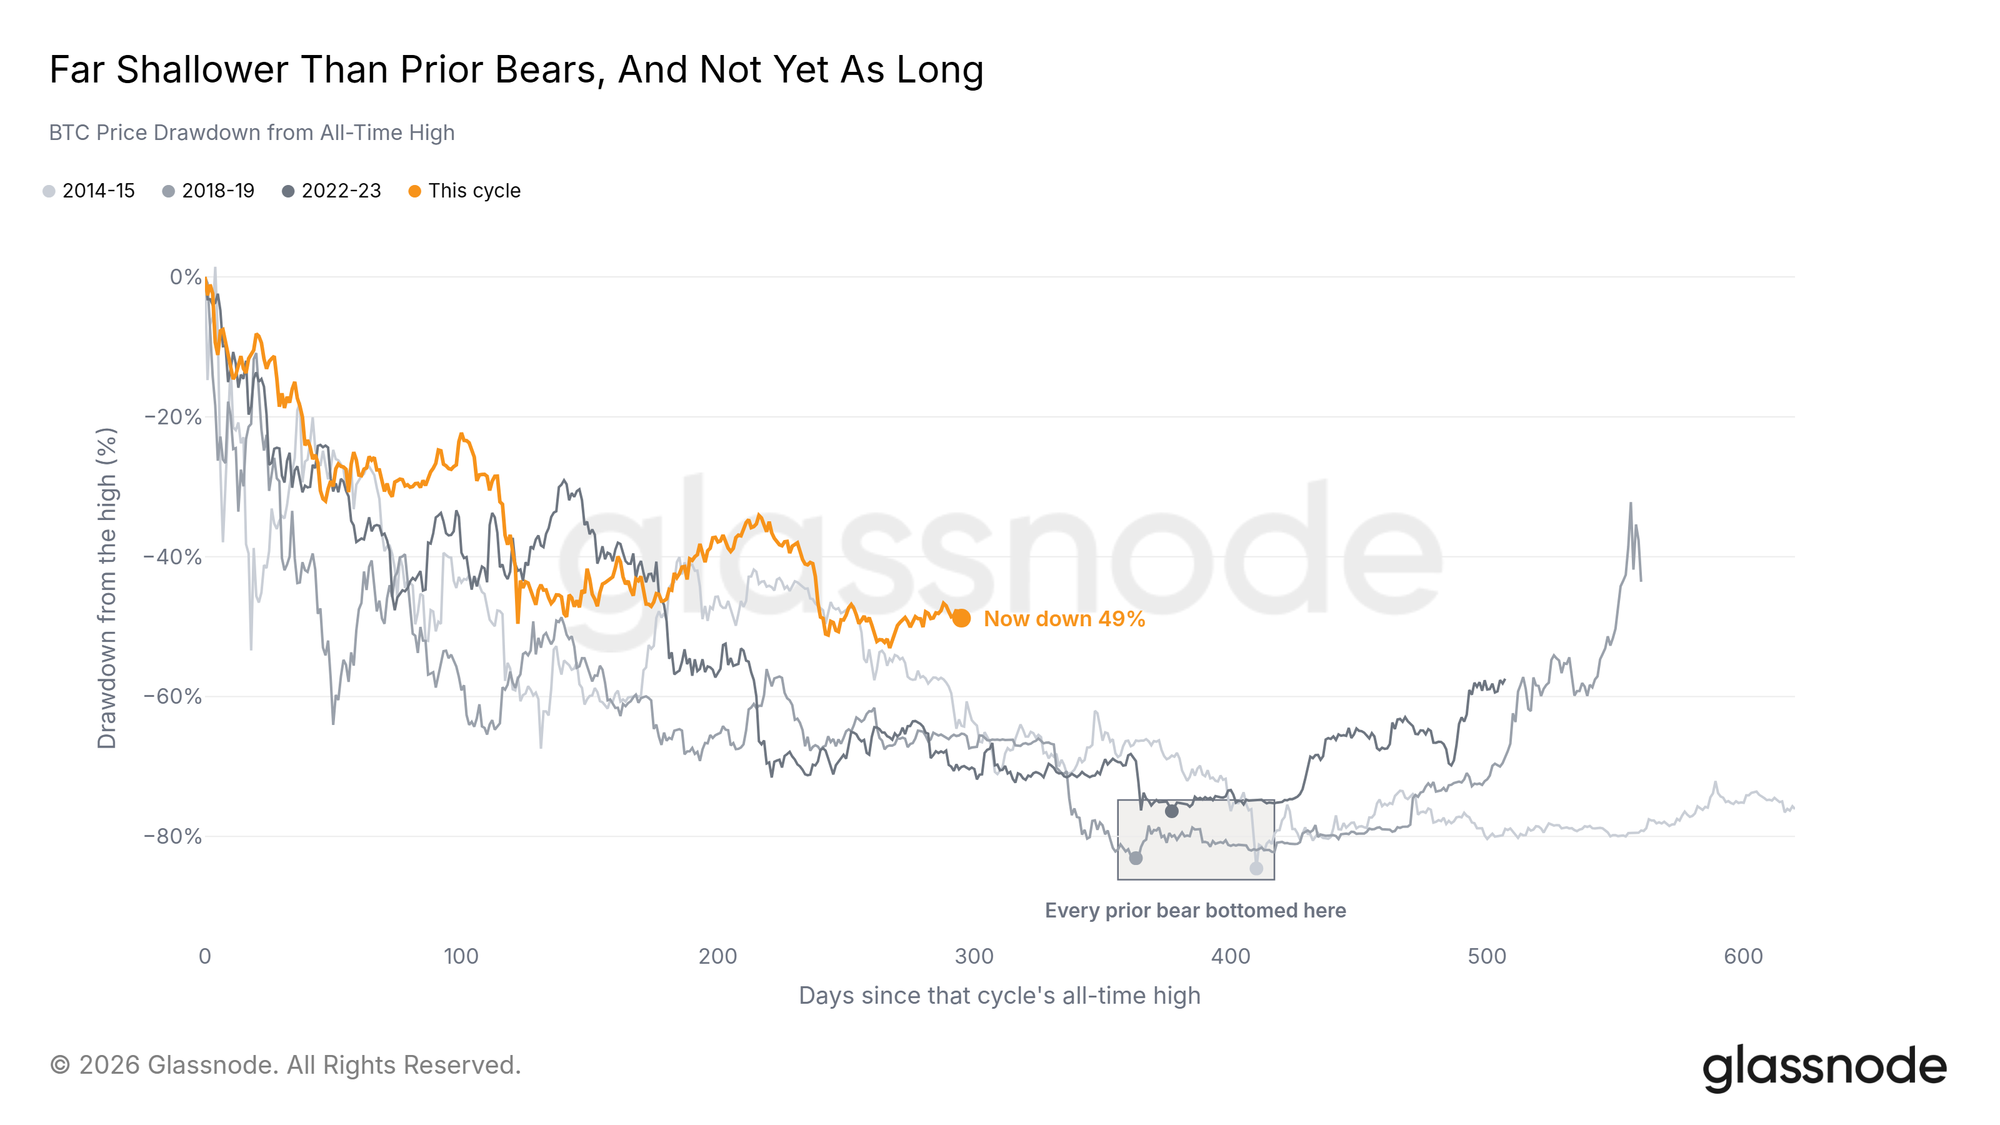
Two measures of this bear agree. Against the 200-day moving average, no prior bear kept price this close to trend: the deepest discount of this cycle stopped well short of the mildest bear before it. Measured as a drawdown from the all-time high, the picture is similar, with prior bears bottoming well below where this one has traded.
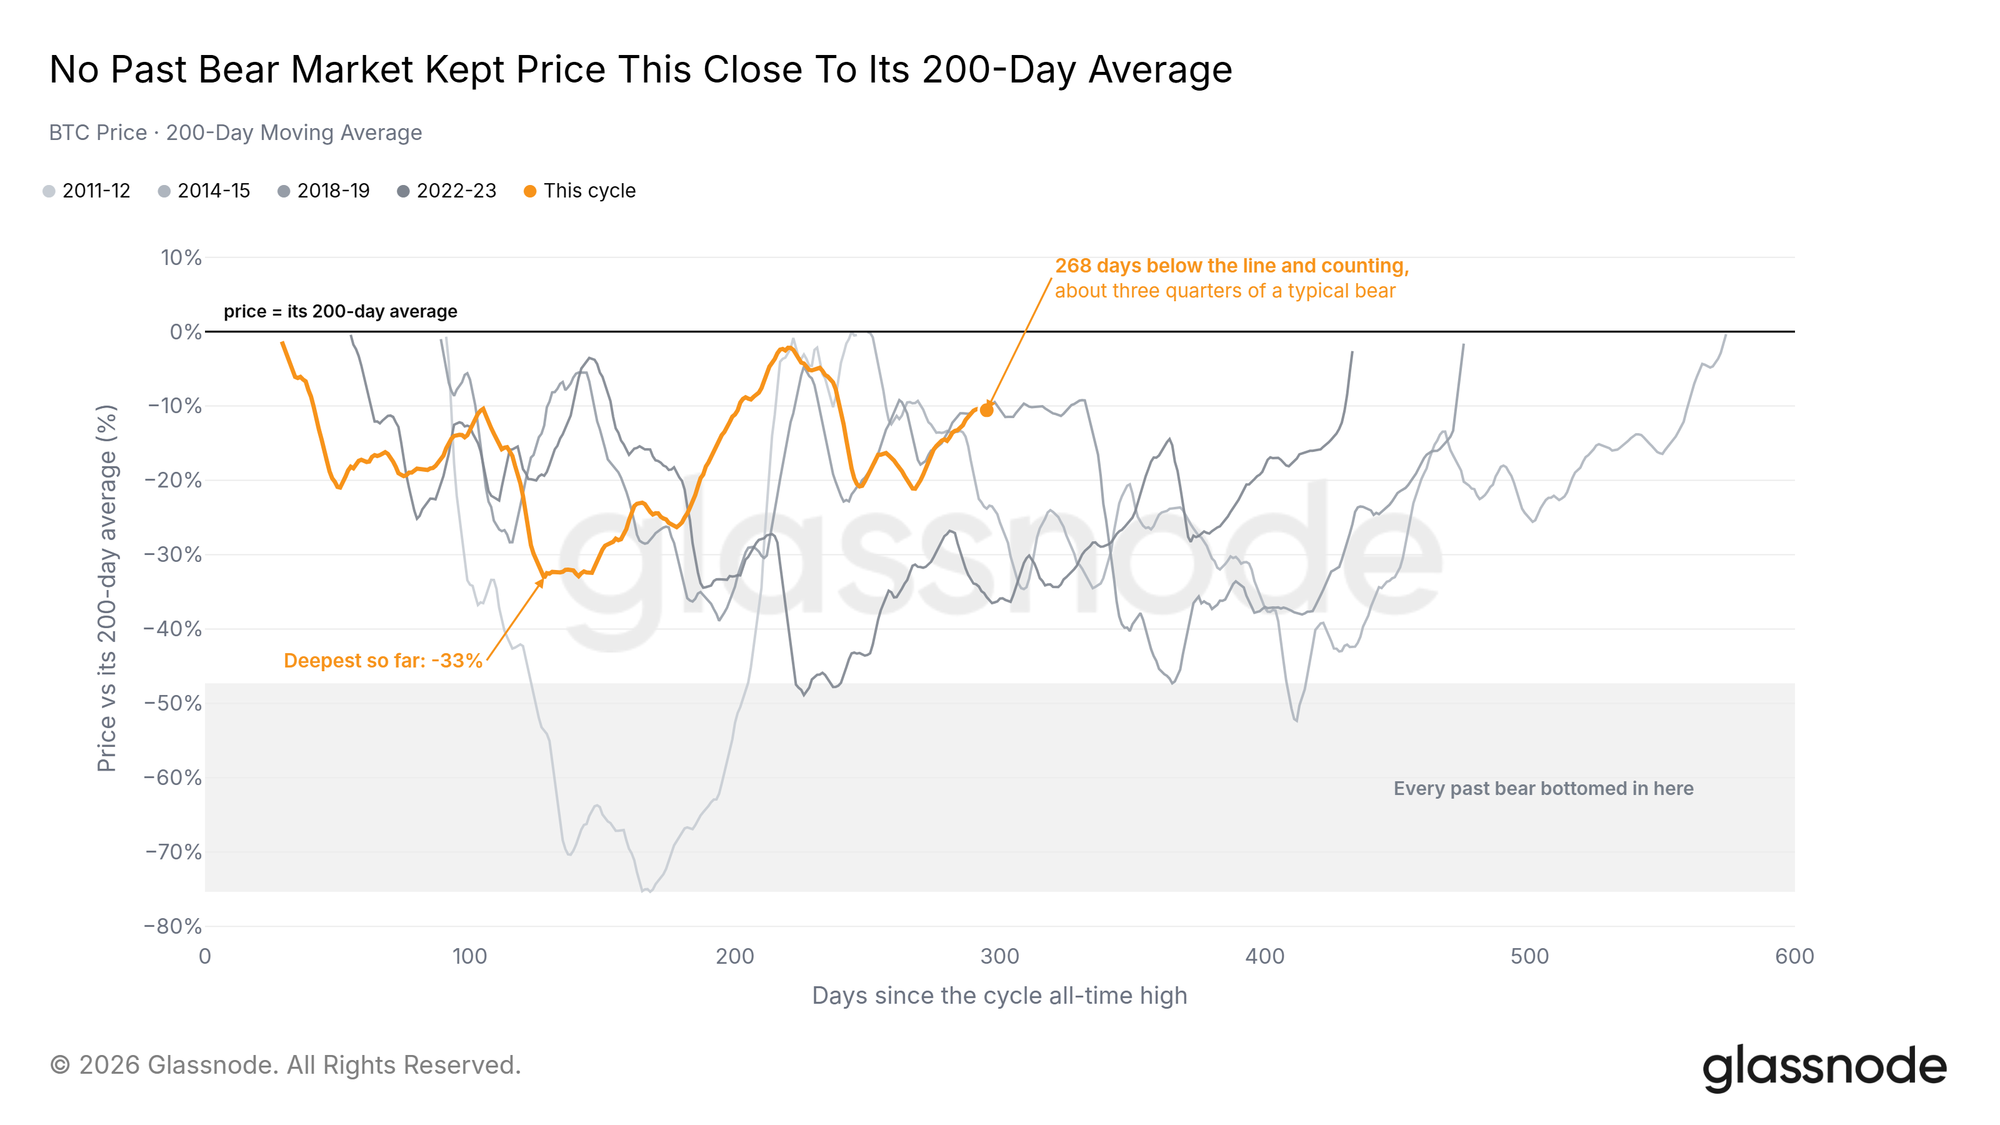
Back on the 200-day view, the clock is the other half. Bitcoin has now spent about three quarters as long below that average as the typical prior bear did, and most of those bears ran longer still. A drawdown this gentle has not yet served the time its predecessors served, which argues for patience rather than for calling the low, particularly for anyone working from a four-year cycle map.
The Exchange Doors Slow
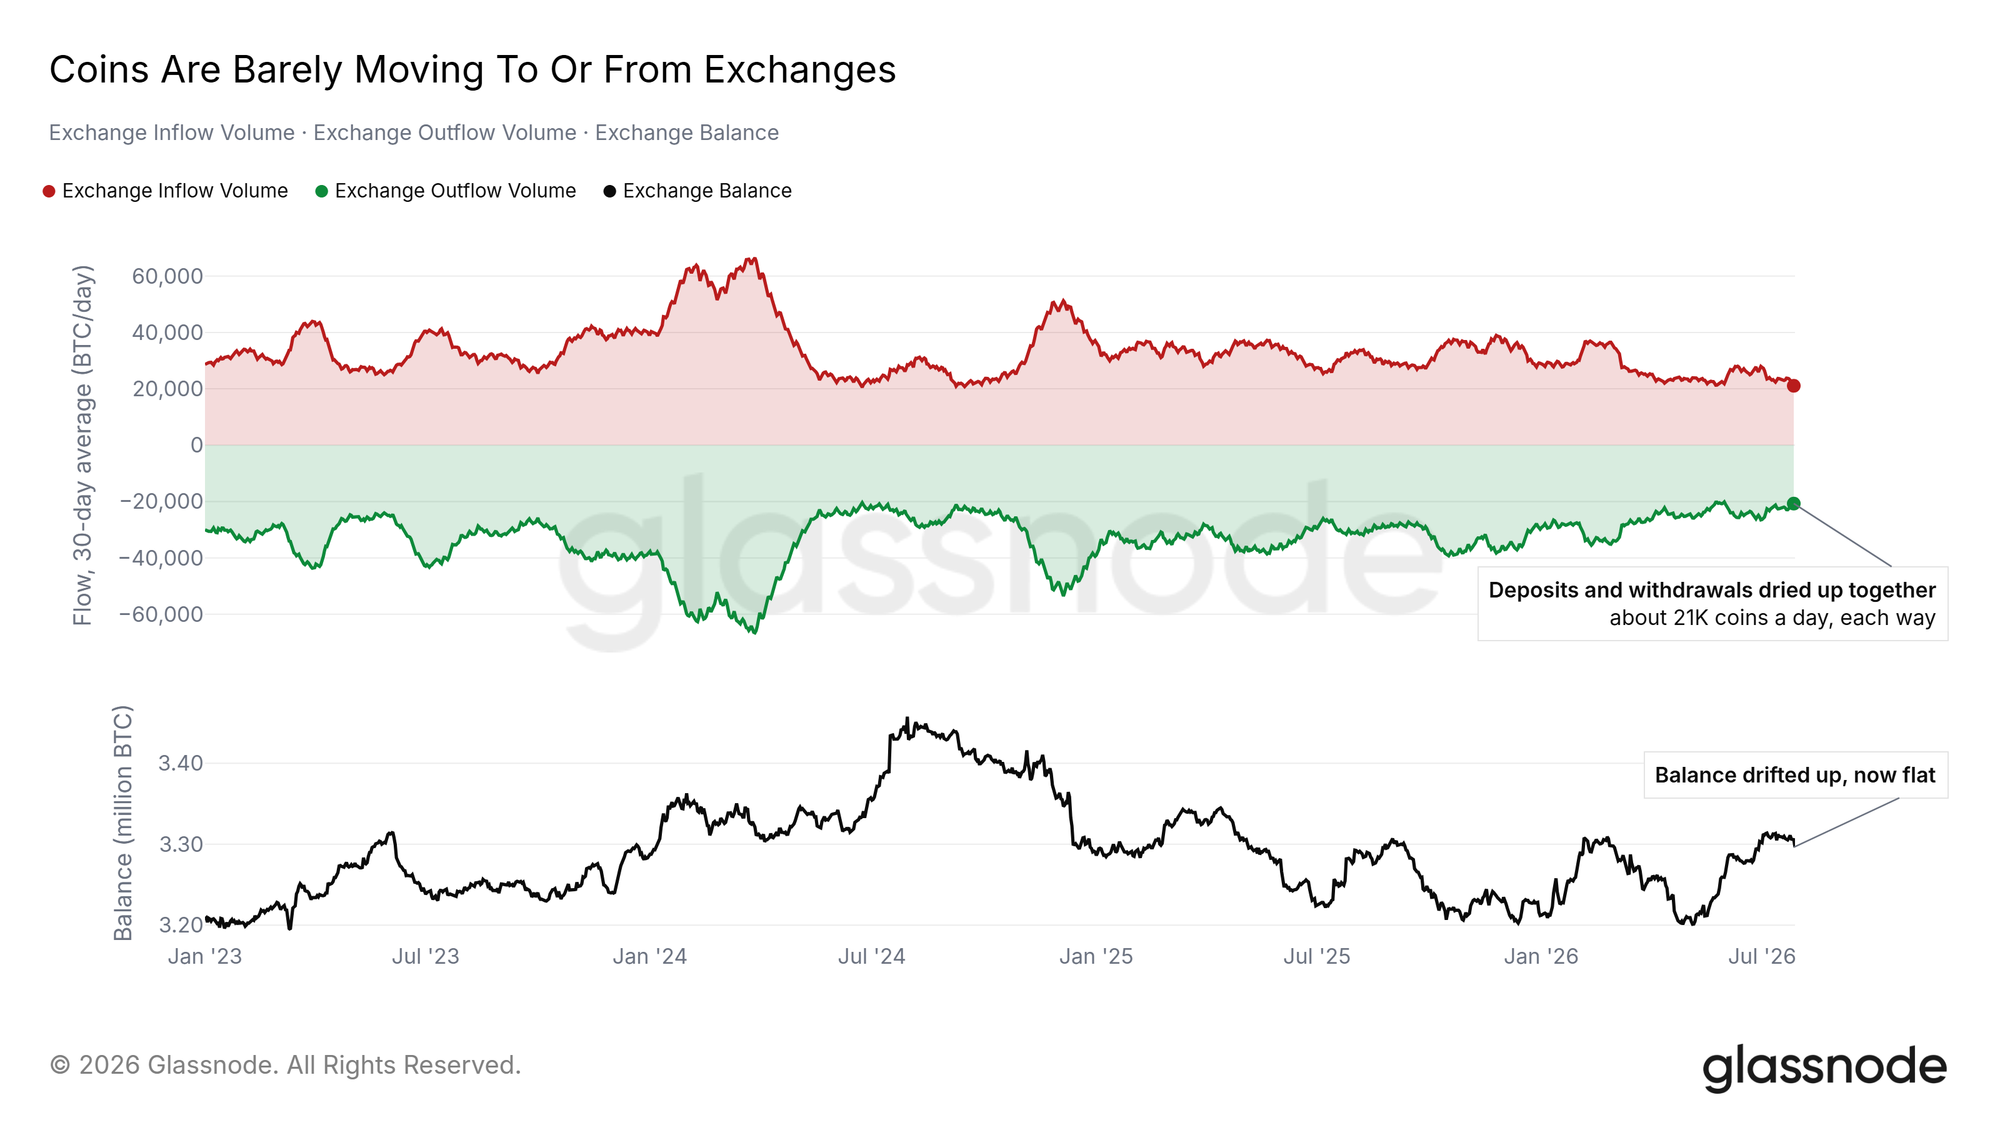
Exchange deposits and withdrawals have thinned out together. Both legs now run at roughly the same modest pace, among the quietest combined flows of the past three years and well below the 2023-2025 norm. Balances say something similar from the other side: they drifted higher off the April trough and have been broadly flat since early July.
That reads less like distribution or accumulation than like disinterest, a pattern that has often marked the quiet middle of a bear market. With so little moving on-chain, there is not much standing supply positioned to absorb a change in demand should one arrive.
Off-chain Insight
The ETF Bid Idles
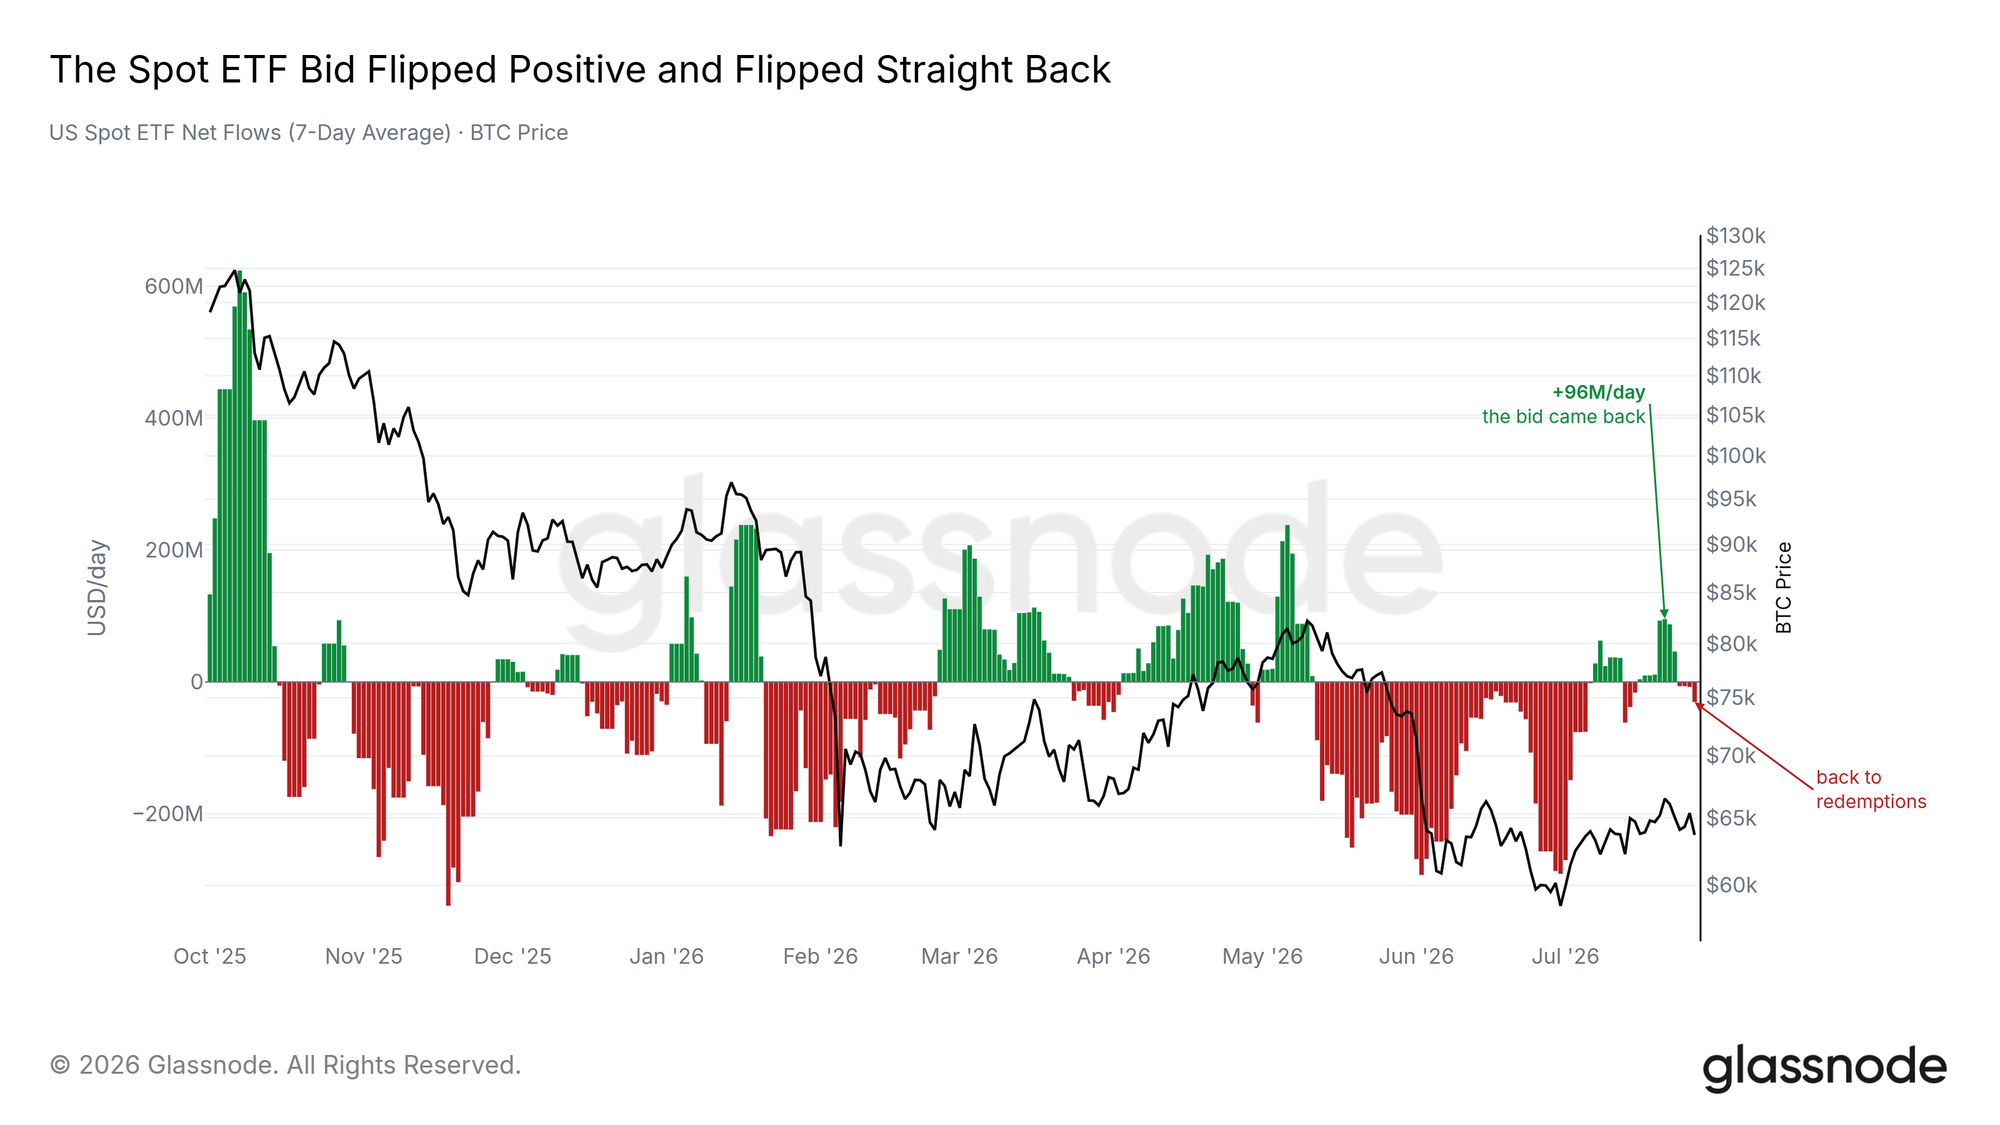
US spot ETF flows turned positive in the middle of July and turned straight back within the week. Net flows are modestly negative again, and set against the redemption waves of June and early July the current outflow barely registers.
The institutional channel is not selling this market down, and it is not buying it up either. Persistence rather than size was the thing to watch after last week's flip, and it did not persist.
Euphoria at the High
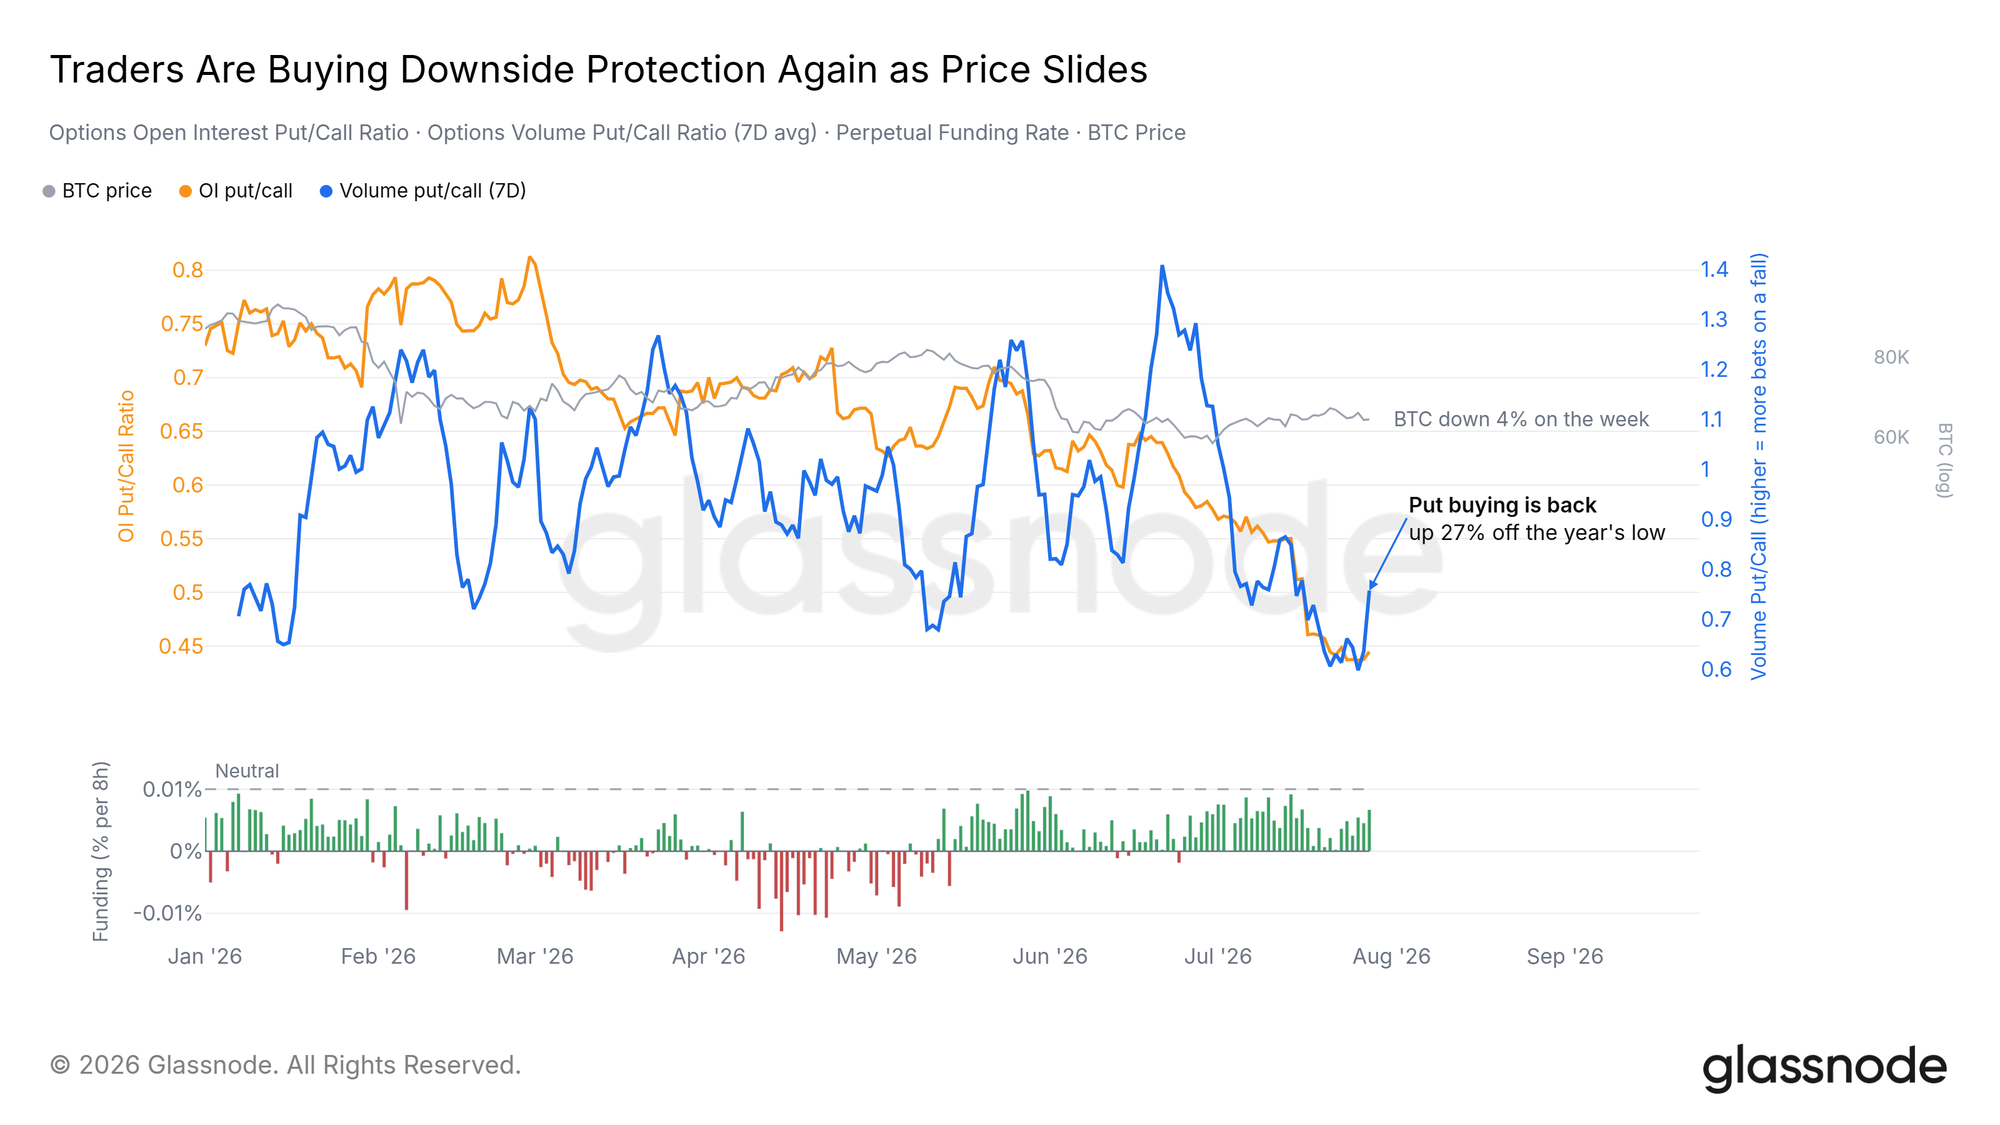
The cost of downside protection collapsed to almost nothing on July 21, the same session Bitcoin printed its local high after a run up off the June low. Hedges were sold into the top, and the deleveraging that came with the rally left the market leaning into the move that followed.
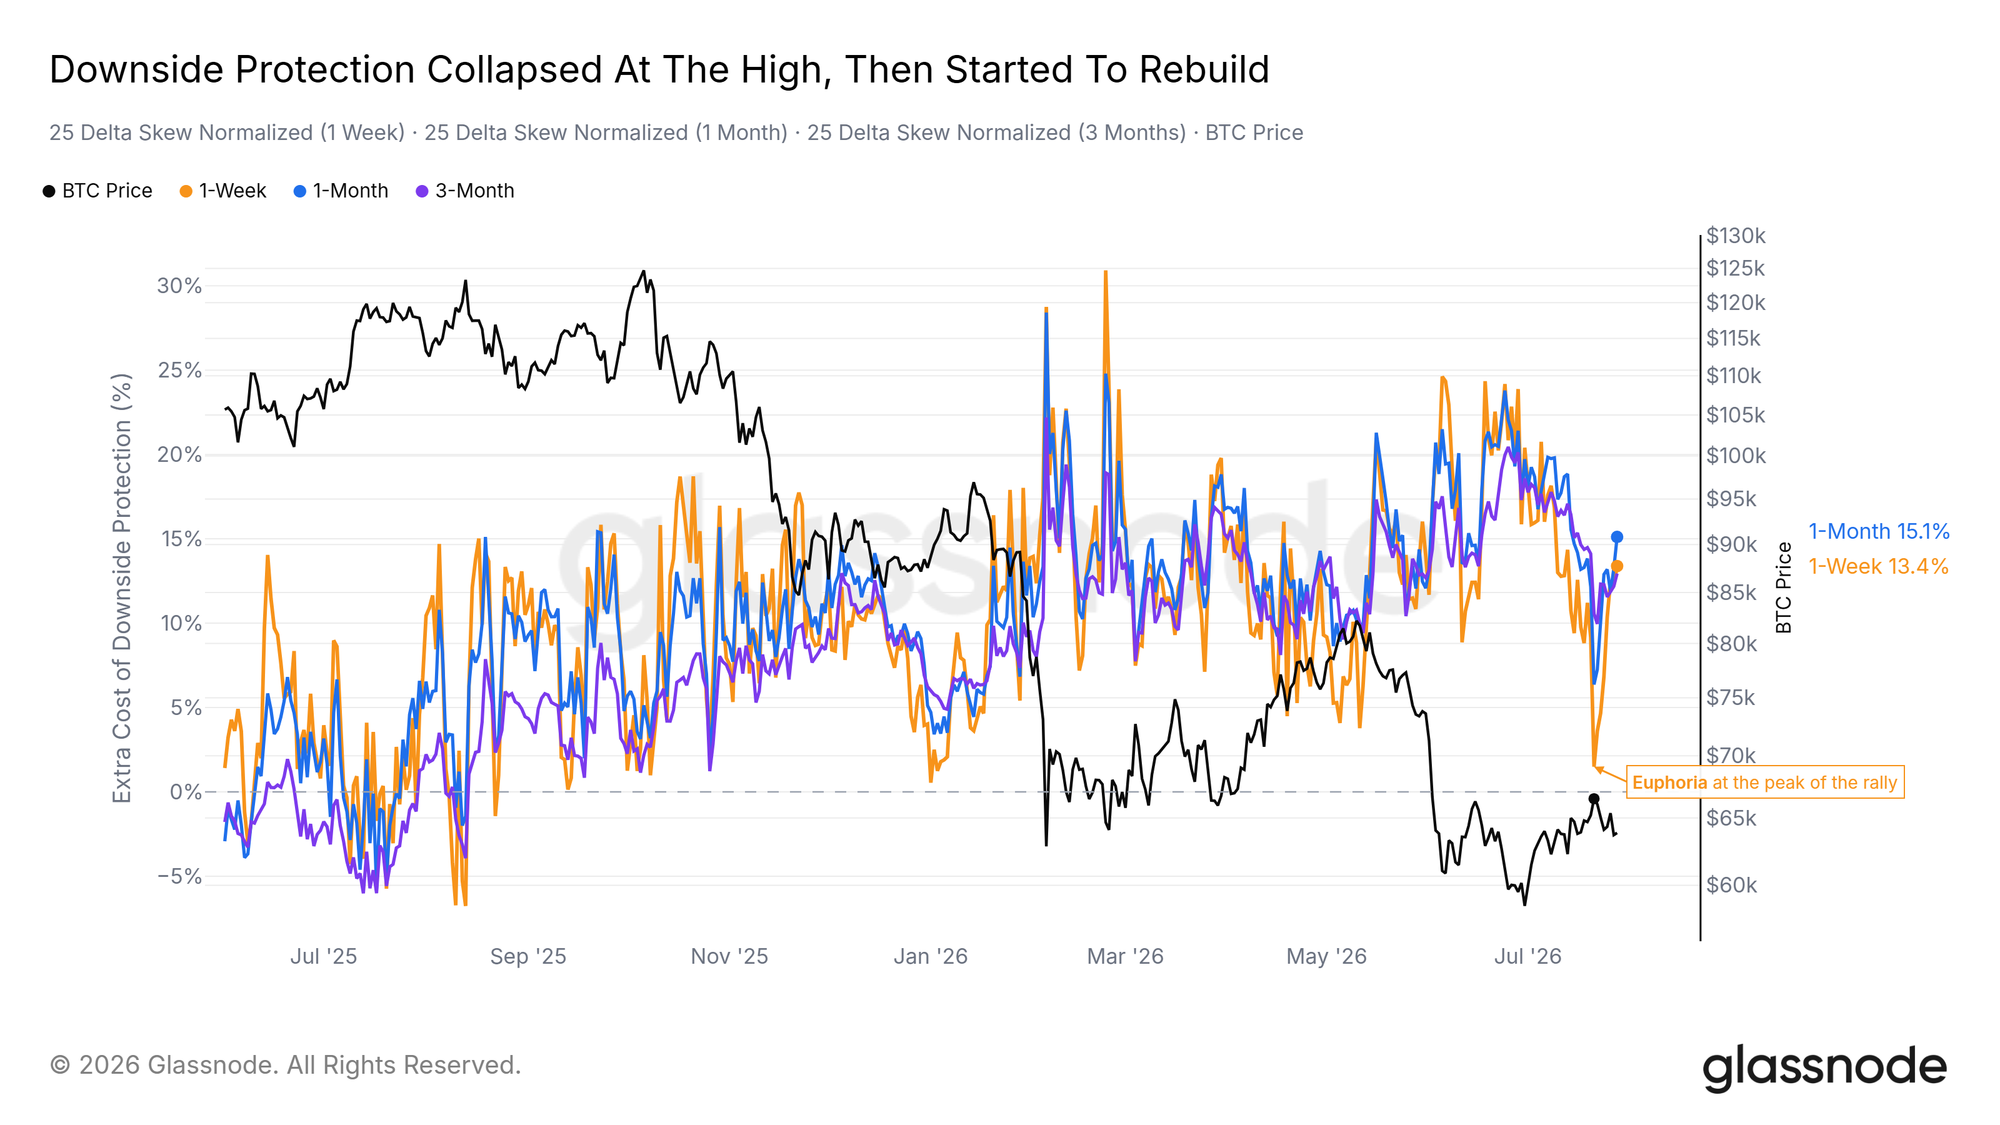
It has been an expensive week for that positioning. Skew has climbed back off that low, and the flow has turned with it: the volume put/call ratio bottomed at its low for the year and has climbed hard as price slid, with perpetual funding pinned below neutral all month.
Open interest is the more cautious read. The put/call ratio on open interest looks to have bottomed at the same moment, but it has barely lifted off that low. Until the carried book follows, this is repositioning rather than a change of stance.
The Budget Swings to Puts
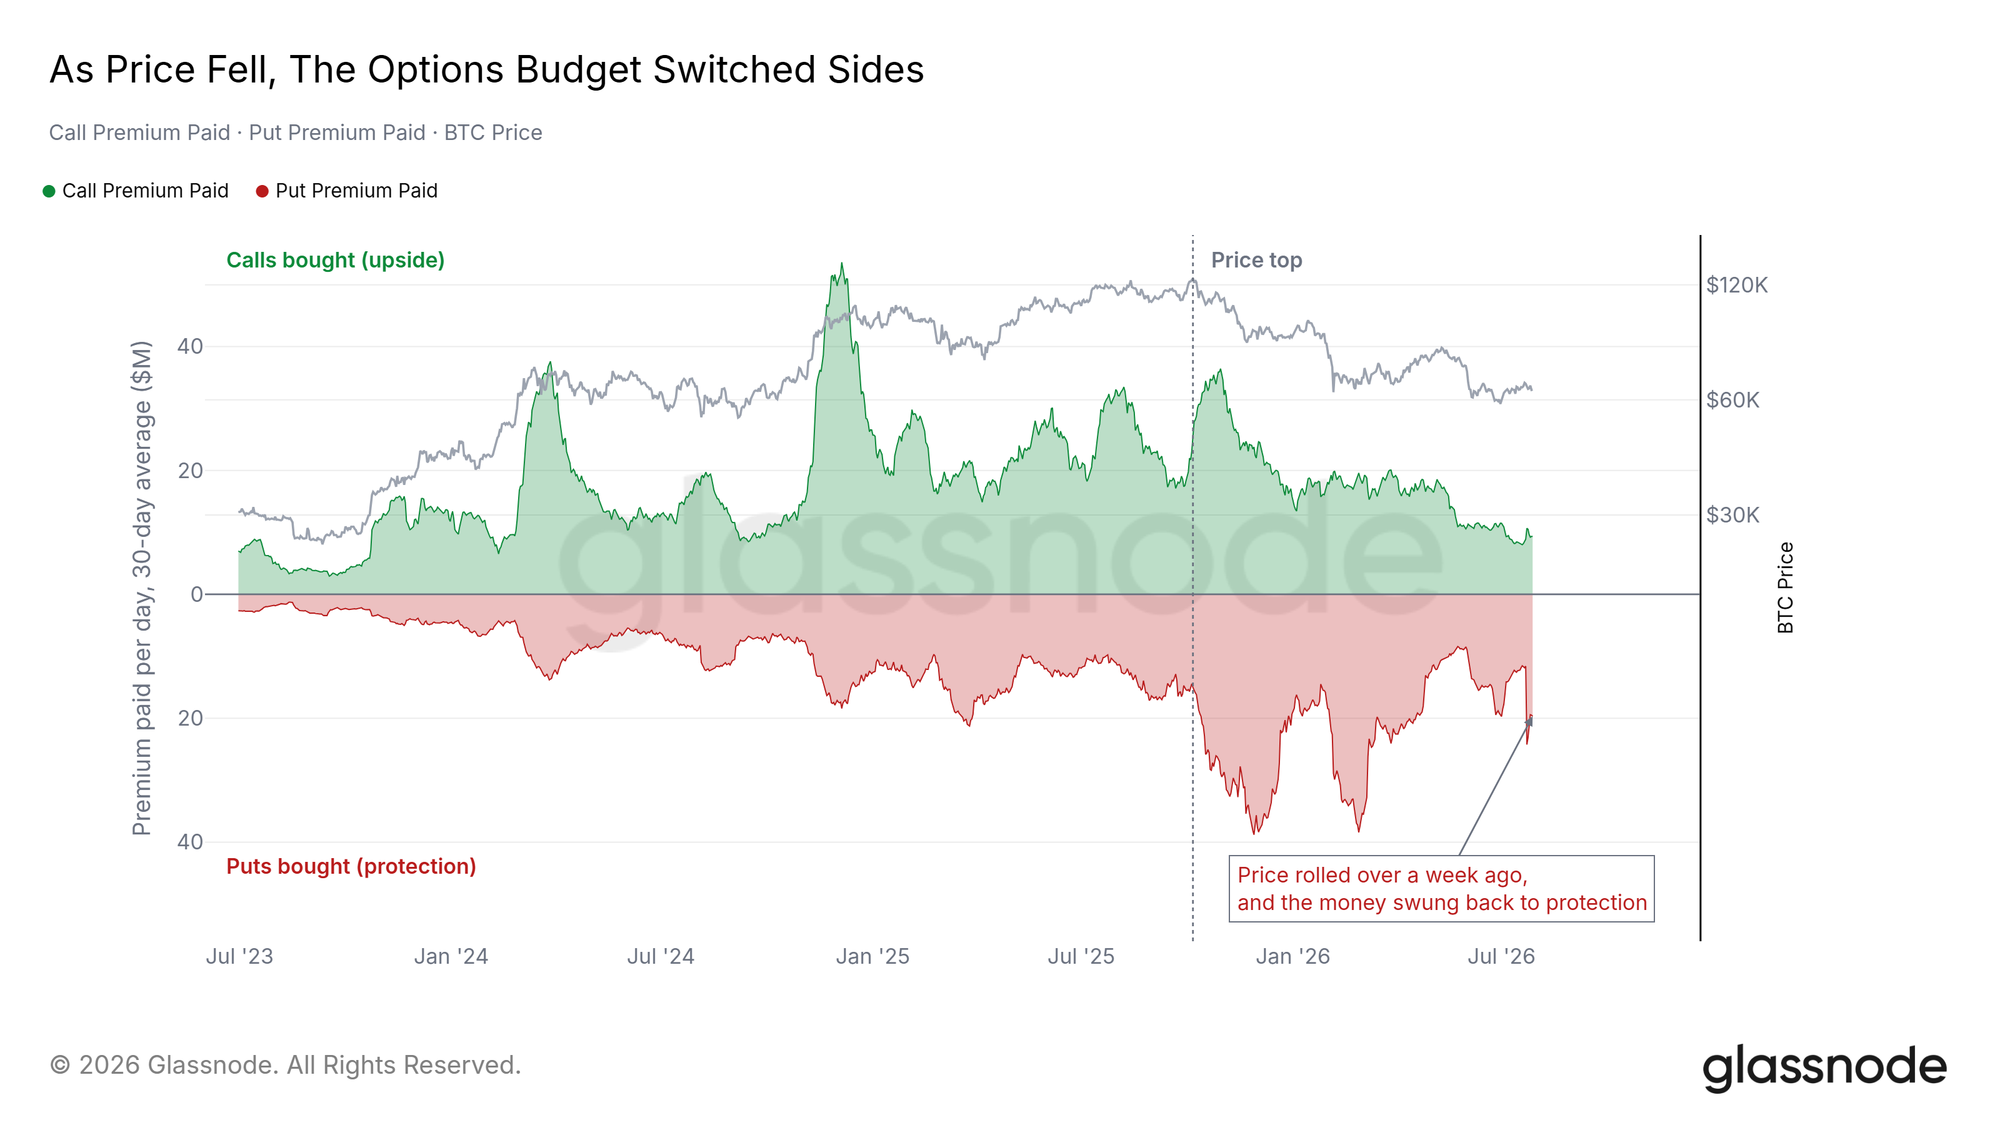
Options buyers spent the rally paying for upside; since price rolled over a week ago, the budget has swung back toward puts, though one outsized put trade dominates the very end of that swing. The shift is on the call side, where spending on upside has fallen sharply against last year's pace. This does not look like panic hedging.
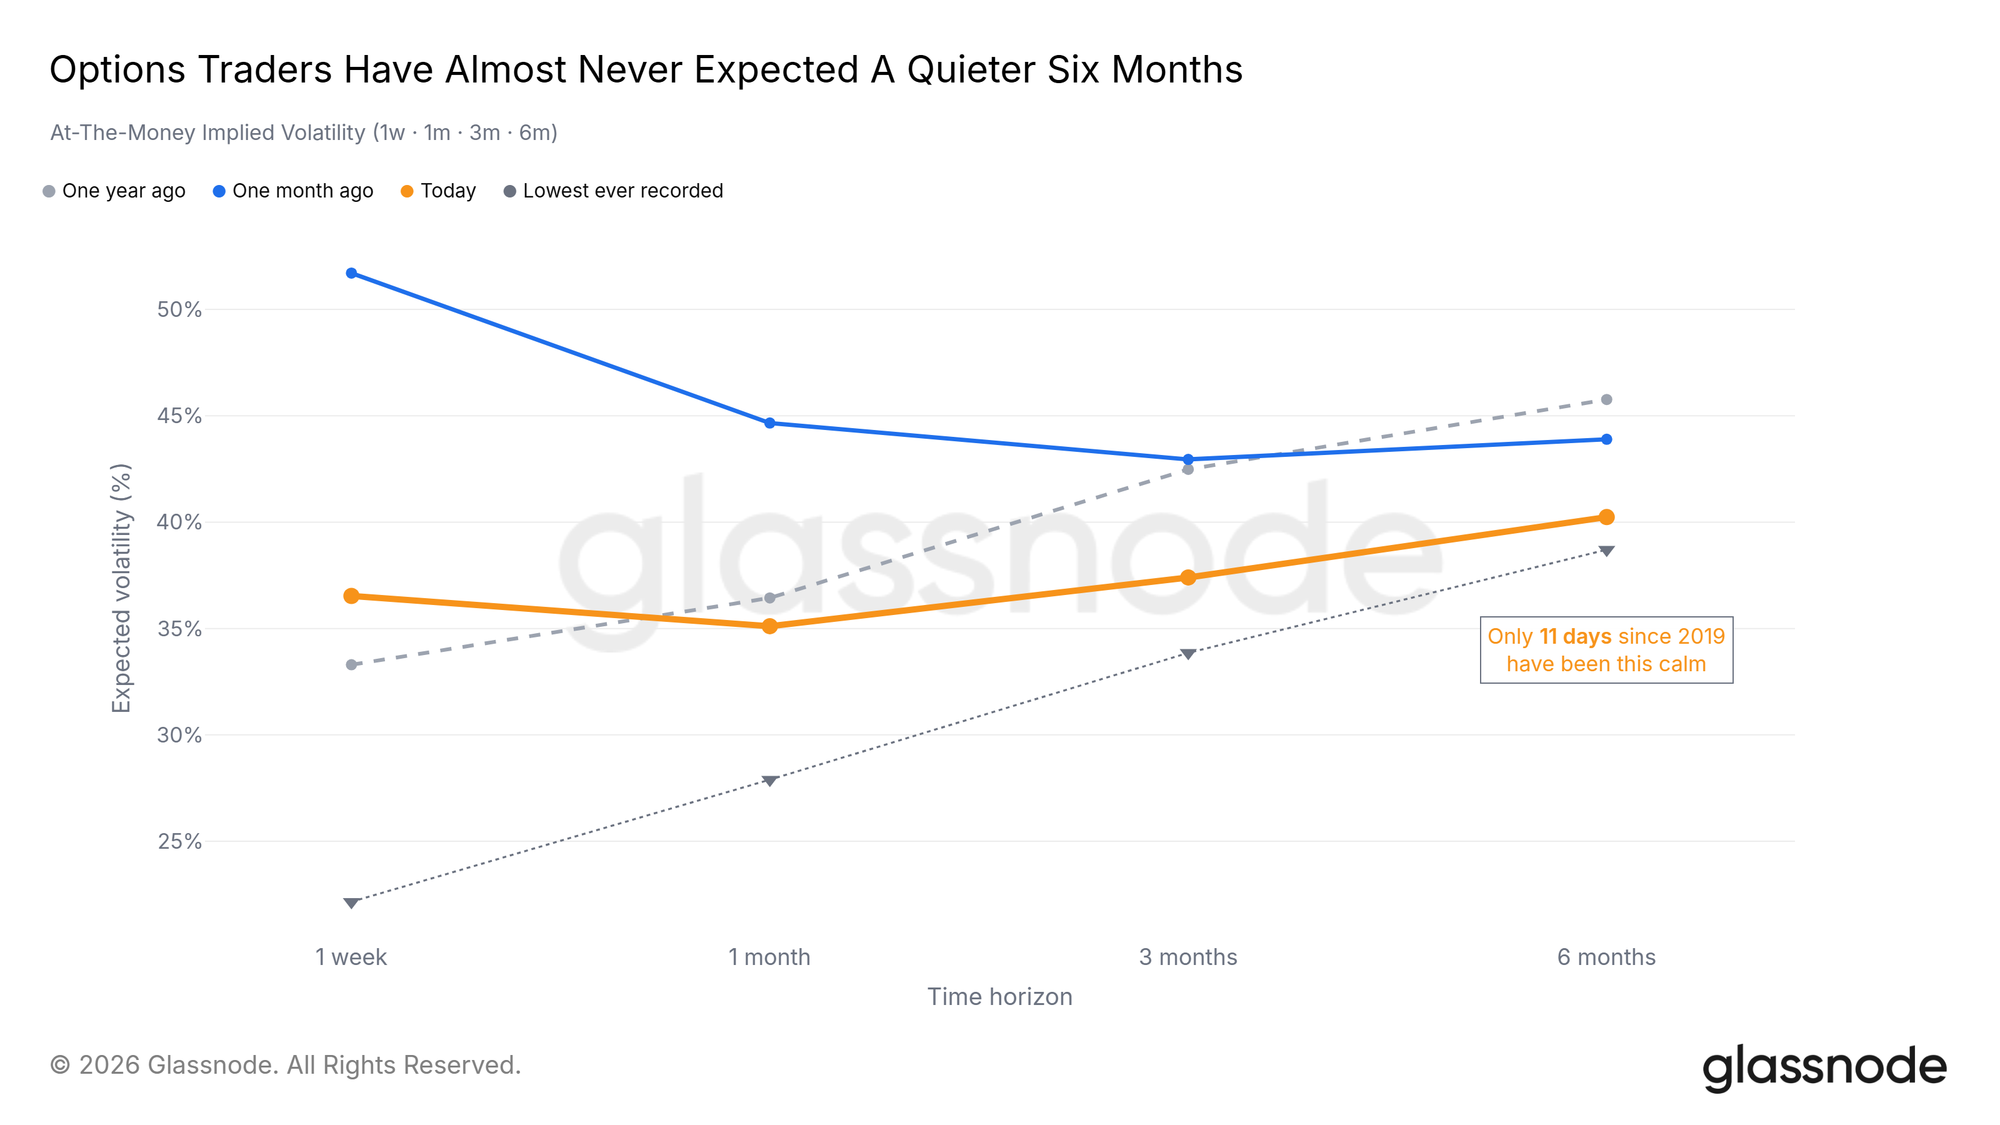
Volatility pricing agrees. The whole implied volatility curve is compressed near the bottom of its range, and the six-month tenor has almost never been lower: options traders have rarely expected a quieter half-year than the one they are pricing now.
The Quietest Tape Since 2019
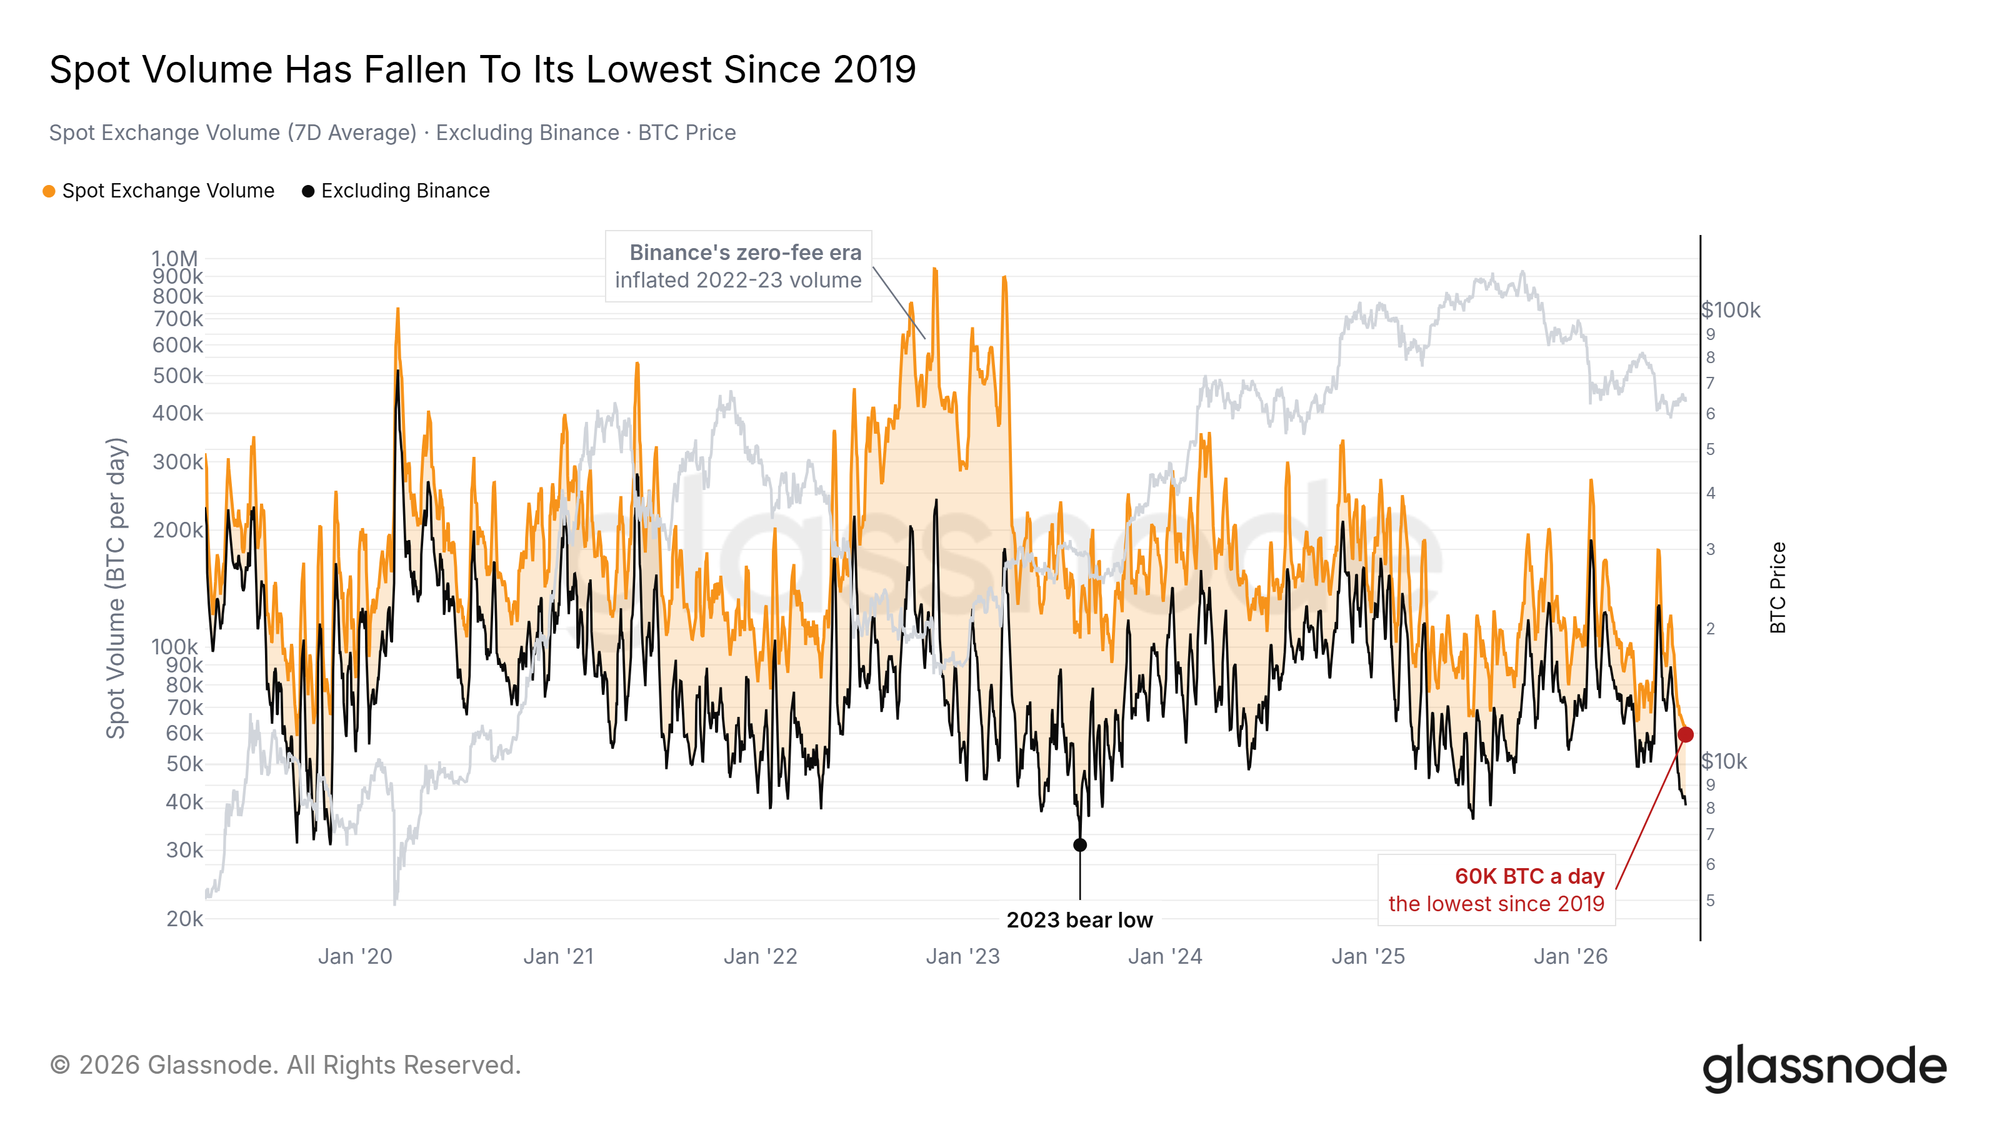
Measured in coins rather than dollars, so the price decline does not flatter it, spot volume has fallen to its lowest since 2019. Stripping out Binance, whose zero-fee promotion inflated tracked volume through 2022 and 2023, gives a similar picture, though on that cut it sits above the depths of the last bear.
Low volume is less a directional signal than a description of who is left. With cash paid to wait, a good deal of it appears to be waiting.
The Bid Waits Below
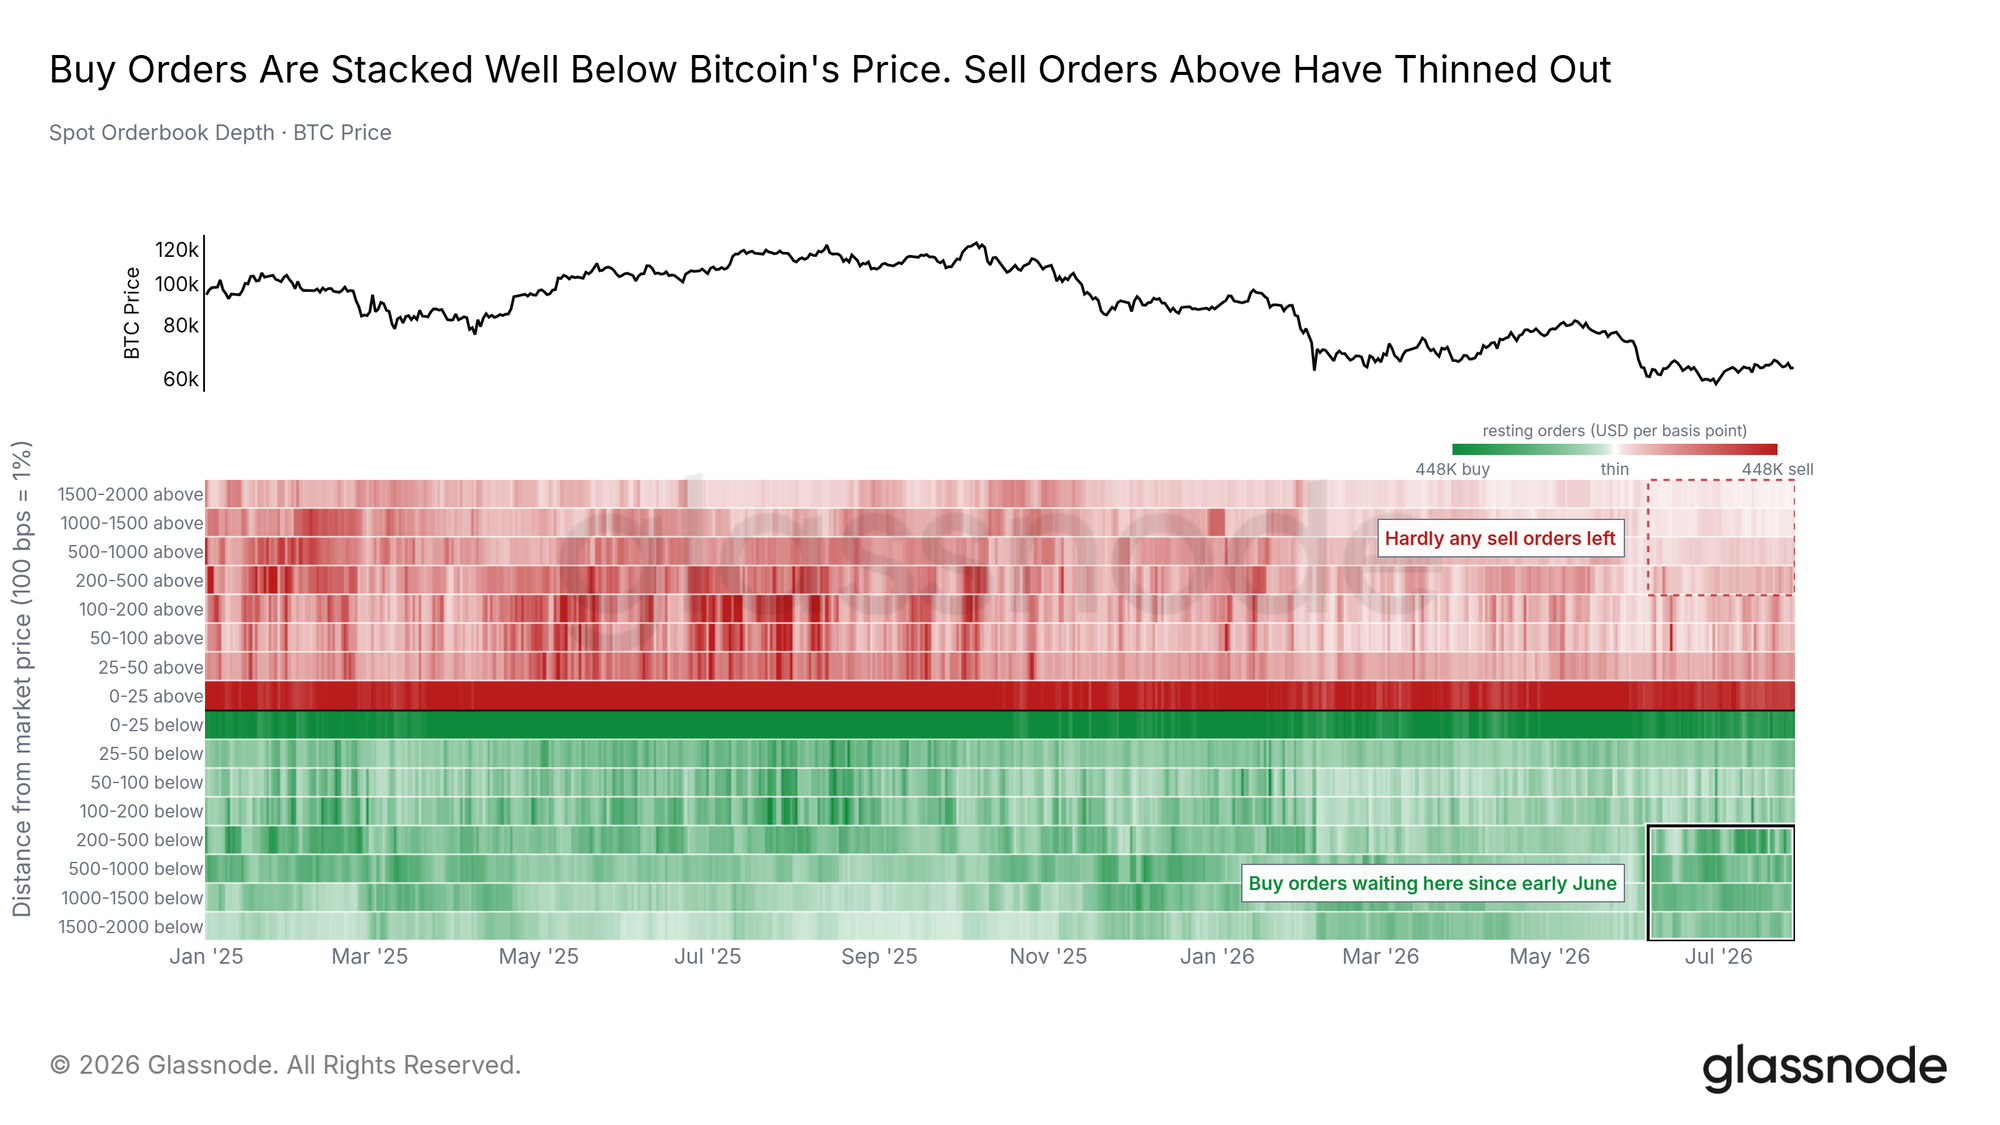
The order book suggests the money has not left so much as stepped back. Since early June a persistent stack of bids has built between 2% and 20% below spot and has stayed there, refreshed day after day. Above the price, the offer side has thinned considerably, with resting sell orders in the same band near their thinnest of the past month.
Buyers look willing, just not at these levels, and there is little supply standing in the way of a move higher. Thin books cut both ways, and they are often how a quiet market becomes a fast one.
The Verdict
The Vector Stayed Out
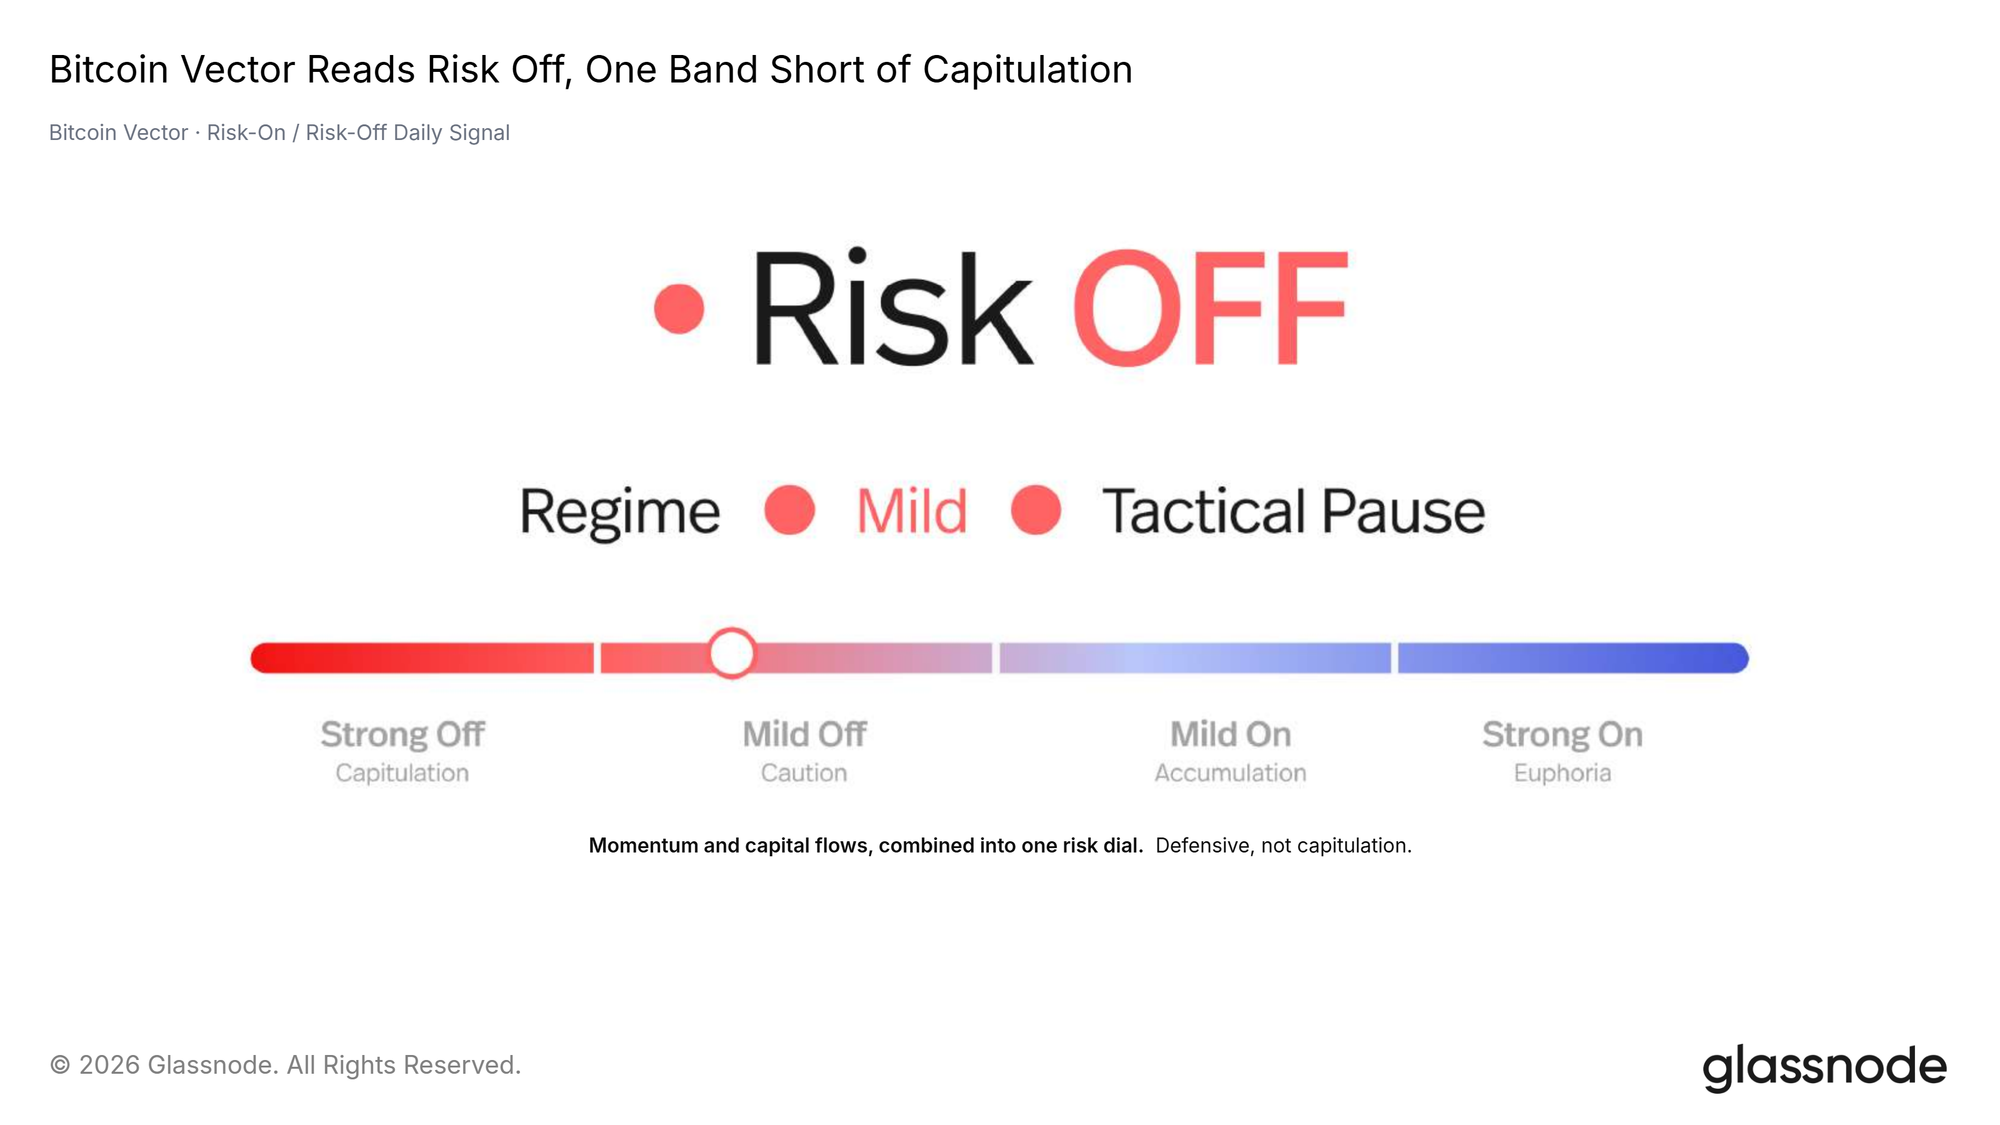
Glassnode's Bitcoin Vector reads Risk Off: mild rather than extreme, one band above capitulation, in what the model calls a tactical pause. A signal sitting defensive rather than capitulating reads as the practical form of everything above.
The macro regime pays capital to wait, the on-chain and off-chain surfaces have gone quiet, and the model scoring them is not asking anyone to step in front of it. A bounce is unlikely to turn that; a change of regime would.
Conclusion
The regime looks unchanged, and its cause sits upstream of crypto. With Treasuries out-yielding the basis trade and the dollar firm, the marginal buyer is paid to stay in cash, and the downstream surfaces read that way: spot volume at multi-year lows, exchange flows becalmed, an offer side that has thinned out. This is the shallowest bear on record so far by depth and, by the clock of past cycles, unfinished. Improvement would start with policy and show up as a reclaim of the $69K Short-Term Holder Cost Basis on returning volume, with the ETF channel buying rather than idling. A loss of the $62K to $68K shelf, with exchange inflows waking up, invalidates it.
