Market Compass: The Dollar Takes It Back
Our Market Compass snapshot: where the market stands across the macro, cycle, capital-flow, derivatives, behaviour, on-chain and rotation lenses, with the full PDF report free to download and the live dashboard updated daily.


The Market Compass reads the whole crypto market in one view: seven lenses, one composite score, updated every day. This article is the latest snapshot.
New to the Market Compass? Learn more here.
The full report for this edition is freely available in PDF format.
The State of the Market
The Composite fell three points to 23/100 (Defensive), two below its level of a week ago and five below a month ago. Macro dropped eight points on the week to 31/100 and crossed back into Restrictive as the dollar index returned to its 200-day average, so three weeks of macro repair were given back in a single session. On-Chain Fundamentals rose to 52, the best of this run, while Capital Flows, Cycle Position and Investor Behaviour all held exactly where they were. One lens moved and it moved the whole board.
Under the headline, two charts carry this edition's story: how broadly the market ran in late August, and who used the bounce to sell.
The Whole Field Ran at Once
In late August the whole field of assets ran up together, the largest burst of cross-asset gains this year, with the Altcoin Season Index back at 75 and mid caps leading the thirty-day table. Broad, simultaneous rallies of this kind have often marked risk zones rather than the start of a durable advance. The burst has already faded: the median seven-day return across assets is back near zero, and the index has touched and lost the altseason line once already.

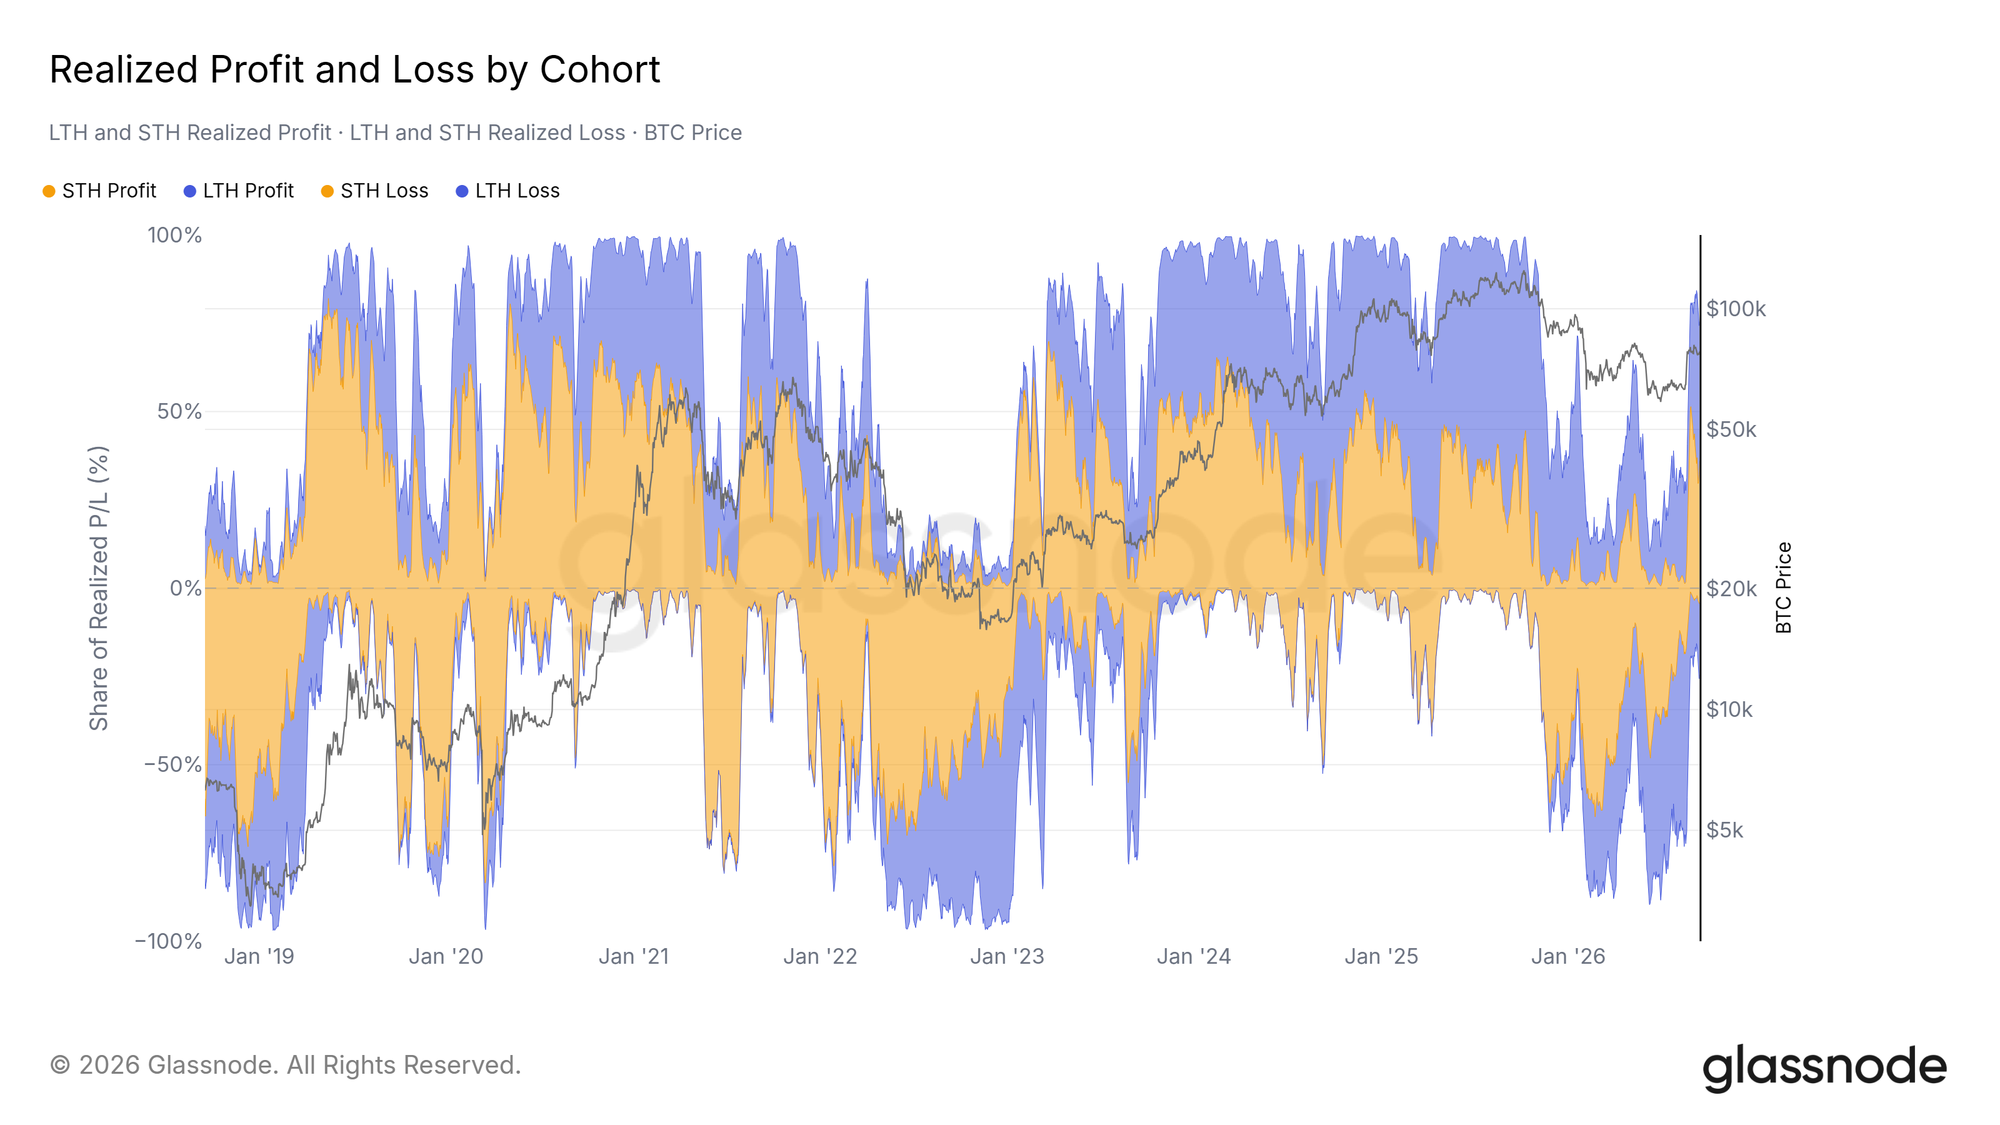
Both Cohorts Took Profit on the Bounce
Bitcoin bounced to trade near a 47% premium to its realized price, and the holders behind it used the bounce to sell. Realized flow flipped from mostly loss to mostly profit over the past three weeks, split about evenly between long- and short-term holders, while the loss side of the chart thinned to a fraction of the flow. The Realized Profit/Loss Ratio set another run high at 2.63. Profit-taking this one-sided is what the chart showed through the 2024 and 2025 advances, and the roll-off the cycle lens expects has not started yet.
What flips it: the dollar closing above its 200-day average would confirm Macro's reversal and take the composite lower, while Investor Behaviour finally turning up would offset it.
This article is a point-in-time snapshot. If you want the live picture and how it shifts day by day, the full dashboard with the daily analyst read is available to Glassnode Advanced and Professional members. Open the Market Compass to see where the market stands right now, or learn more about the Market Compass.
Disclaimer: This report does not provide any investment advice. All data is provided for informational and educational purposes only. No investment decision shall be based on the information provided here, and you are solely responsible for your own investment decisions.
Exchange balances presented are derived from Glassnode’s comprehensive database of address labels, which are amassed through both officially published exchange information and proprietary clustering algorithms. While we strive to ensure the utmost accuracy in representing exchange balances, it is important to note that these figures might not always encapsulate the entirety of an exchange’s reserves, particularly when exchanges refrain from disclosing their official addresses. We urge users to exercise caution and discretion when utilizing these metrics. Glassnode shall not be held responsible for any discrepancies or potential inaccuracies.
