Fasanara Digital + Glassnode: Q4 2026 Institutional Market Perspectives
Our joint report with Fasanara Digital examines how market structure is shifting into the fourth quarter, and what it means for institutional allocators.


The year since our last edition was a bear market in price and in little else. Bitcoin fell from its all-time high last October while equities set records, capital left the network, and volumes and volatility fell to cycle lows. Stablecoin settlement, the number of tokenized-equity holders and perpetual futures on traditional assets kept growing through the same months. Then August turned the market with a short squeeze, and the data since points to more than short covering.
In our latest Digital Asset Report, written with Fasanara Digital, we read that turn layer by layer: the macro backdrop, on-chain capital, spot and order-book liquidity, derivatives, traditional assets moving onto crypto rails, adoption and institutional allocators. Glassnode's on-chain and market data sit behind most of the charts, and Fasanara Digital's own order-book capture and trading-volume data sit behind the liquidity and TradFi pages. The report closes on the levels and signals that would confirm the recovery.
Two of the charts below come from the report's new section, TradFi on Crypto Rails, because that is where trading grew while crypto volumes fell. Perpetual futures on stocks, indices, gold and oil barely traded on crypto exchanges last autumn, and they are now a large part of perpetual trading on the major venues.
The full report is freely available for download in PDF format.
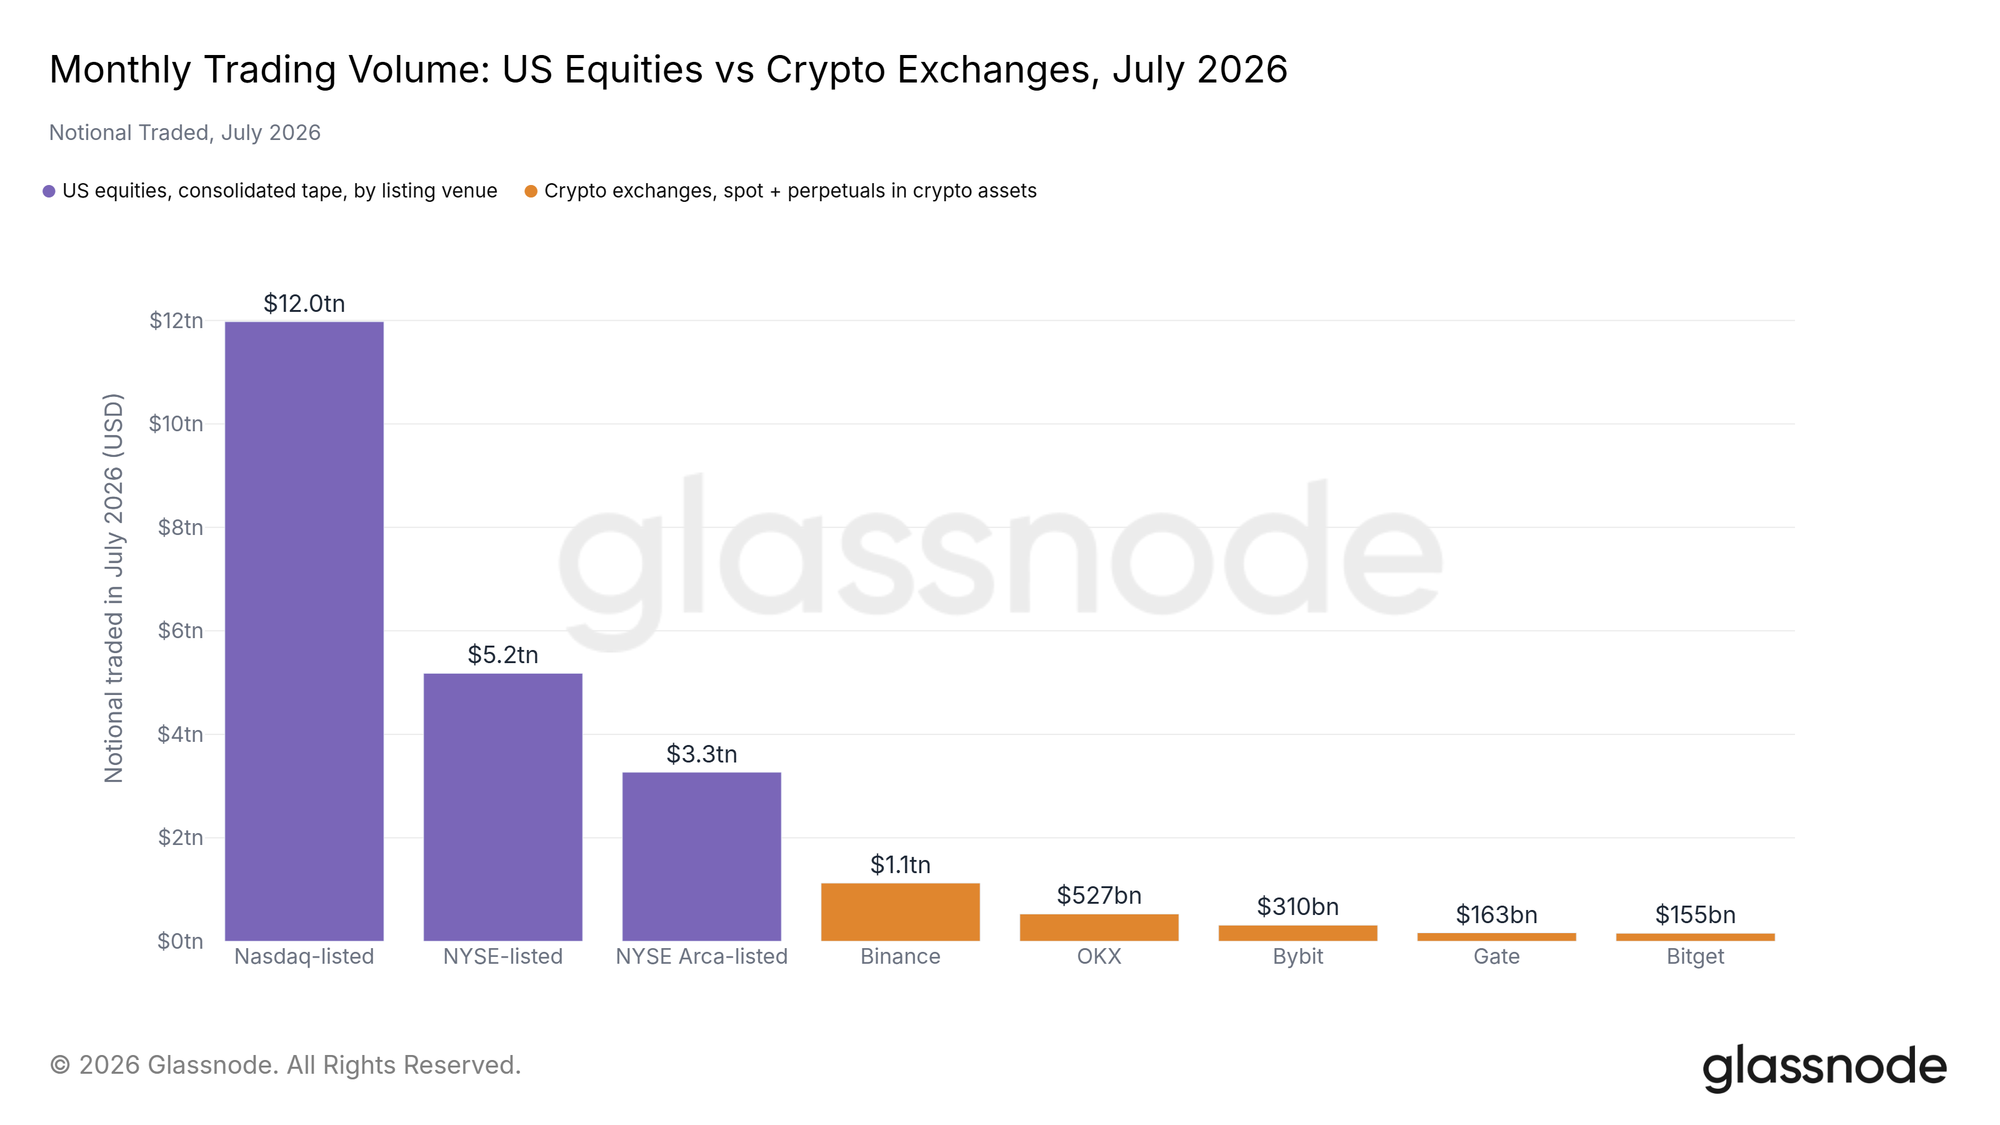
Crypto volume is still a fraction of the US equity tape
The largest crypto exchanges together traded less than the stocks listed on any one of the three large US listing venues. The crypto figure is a floor, because several big venues are not in it.
Perpetuals on traditional assets now rival Bitcoin on Hyperliquid
On Hyperliquid, anyone can launch a perpetual market on any asset with a price feed. Those markets first traded more than the venue's own Bitcoin perpetual in April.

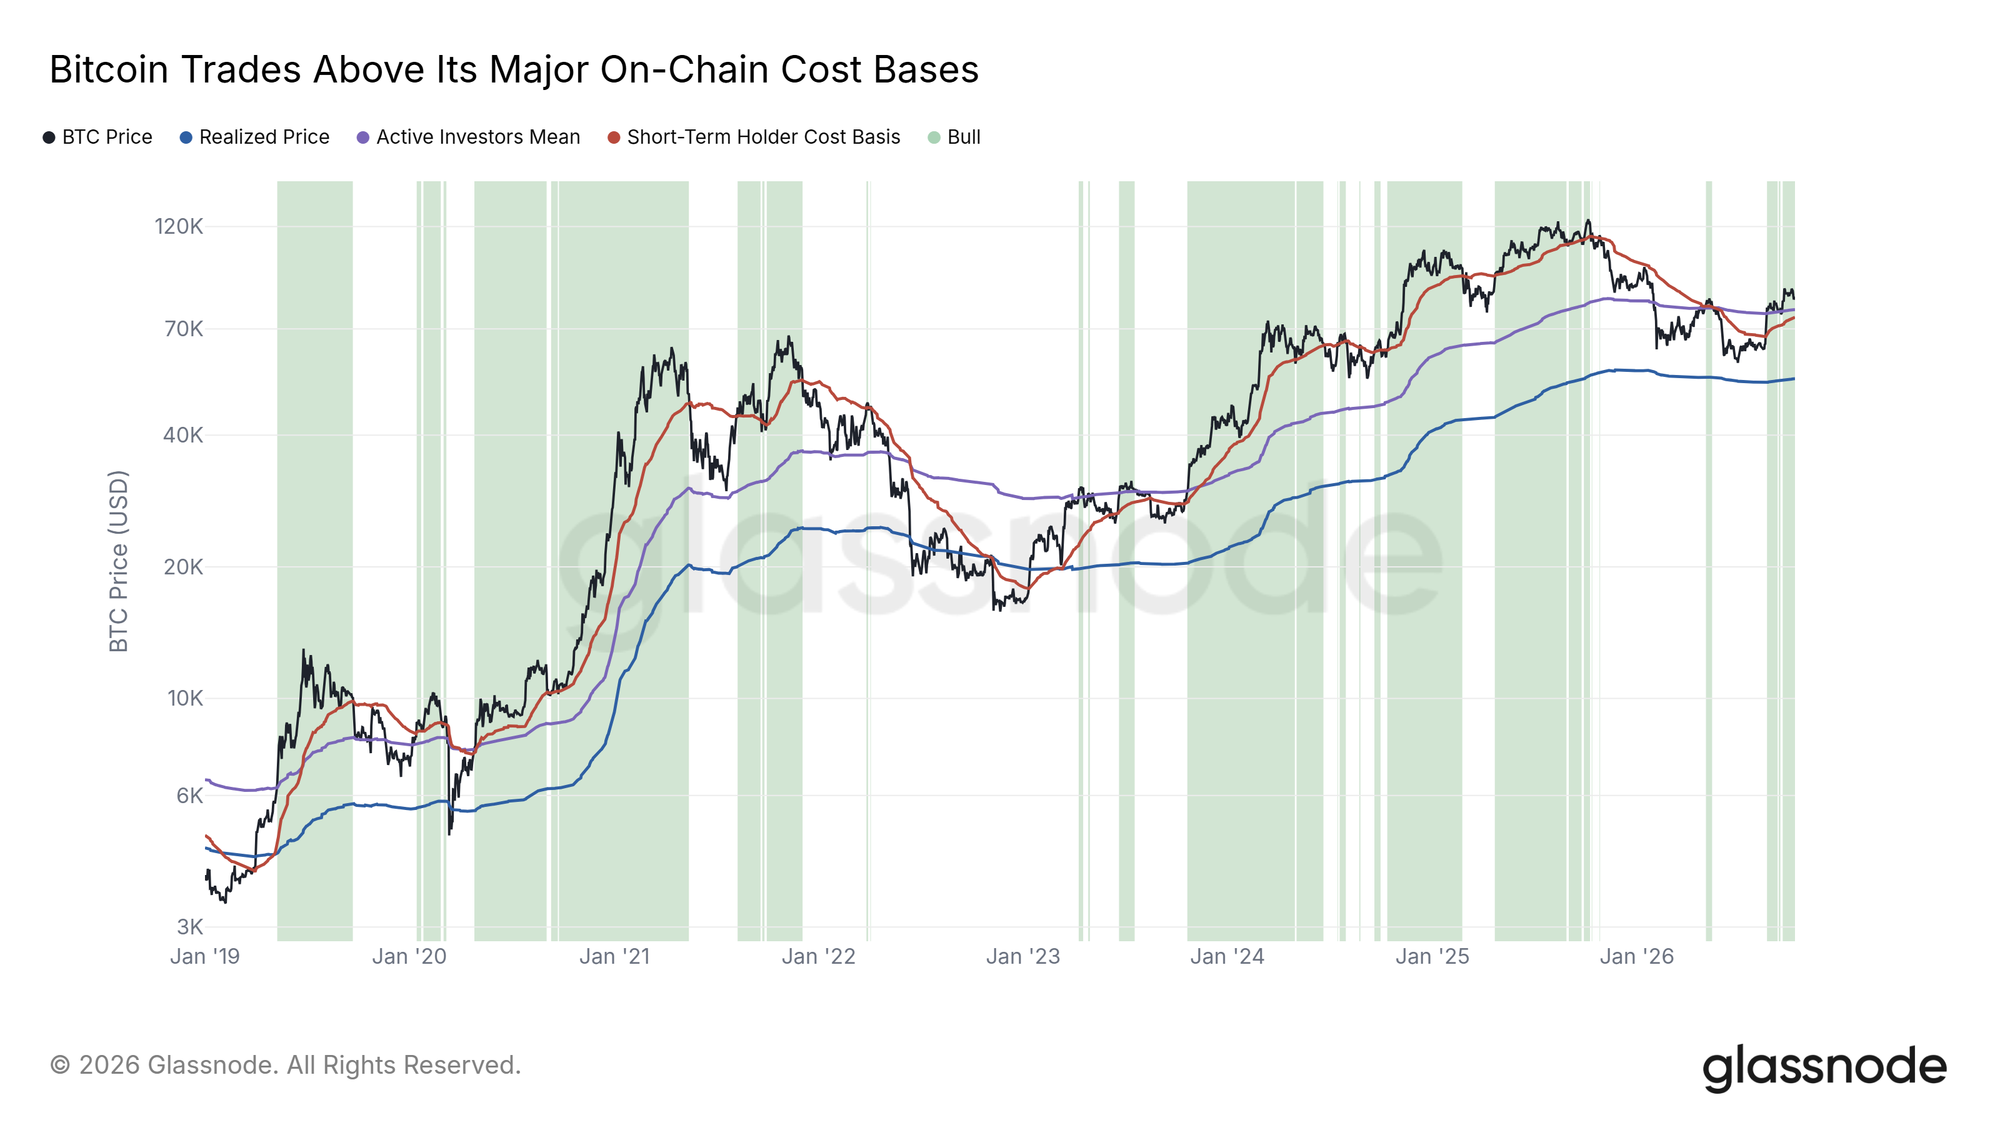
Bitcoin is back above its on-chain cost bases
The squeeze lifted price back above the average cost of every coin, of the coins that still move, and of the newest buyers. Trading above all three marks a healthy bull market, and the report names the level that decides whether it holds.
What else the report covers
- The macro backdrop and the August squeeze: rising US debt costs, the Treasury's buybacks of long-dated bonds, Bitcoin's new link to gold, and the liquidation levels the rally cleared.
- On-chain capital: Realized Cap flows, volatility, the wealth held by new investors and Glassnode's cycle indicators.
- Liquidity and derivatives: order-book depth across venues, futures and options open interest, funding, liquidations and the volatility smile.
- TradFi on crypto rails: perpetual futures on stocks, gold and oil across the major venues, and the race between venues to list traditional assets.
- Adoption and allocators: stablecoin supply and settlement, tokenized equities, ETF flows and digital asset treasuries.
To explore the data and insights, download the full analysis in PDF format.
Disclaimer: This report does not provide any investment advice. All data is provided for information and educational purposes only. No investment decision shall be based on the information provided here and you are solely responsible for your own investment decisions. We urge users to exercise caution and discretion when utilizing these metrics. Glassnode shall not be held responsible for any discrepancies or potential inaccuracies.
- Follow us on X for timely market updates and analysis
- Join our Telegram channel
- For on-chain metrics, dashboards, and alerts, visit Glassnode Studio
