Bybit + Glassnode: The State of Crypto Derivatives
A joint report on how the Bitcoin options market grew, where it took its share from, and how trading behaviour differs across the venues.

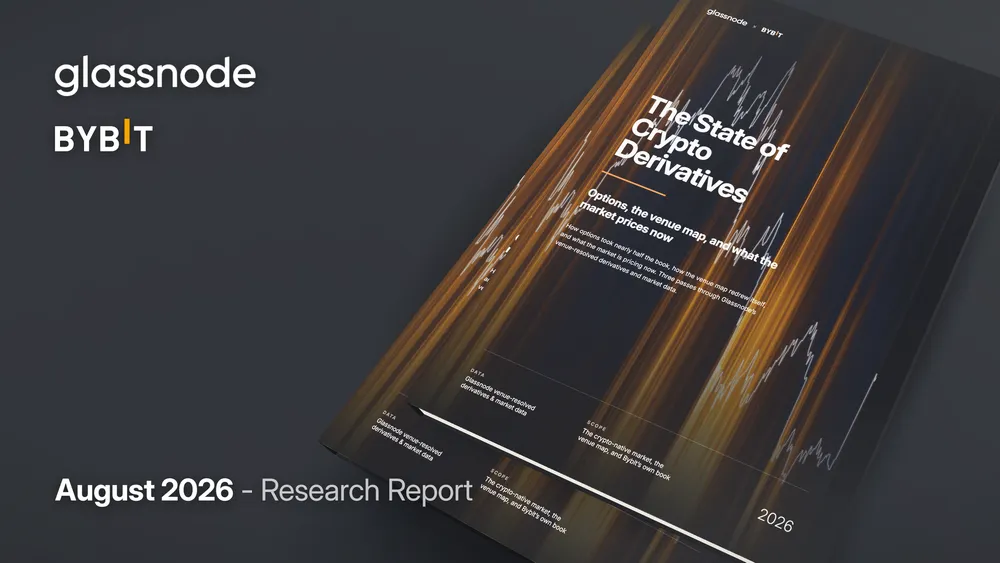
The crypto derivatives landscape has changed shape. On the crypto-native venues, options went from a sideshow to nearly half of notional open interest, and dated futures all but disappeared. In our joint report with Bybit, we analyzed this change in three passes: the whole market, the venues within it, and the conditions the new structure is pricing. Every chart draws on Glassnode's derivatives and market data across the exchanges we track.
The full report is freely available for download in PDF format.
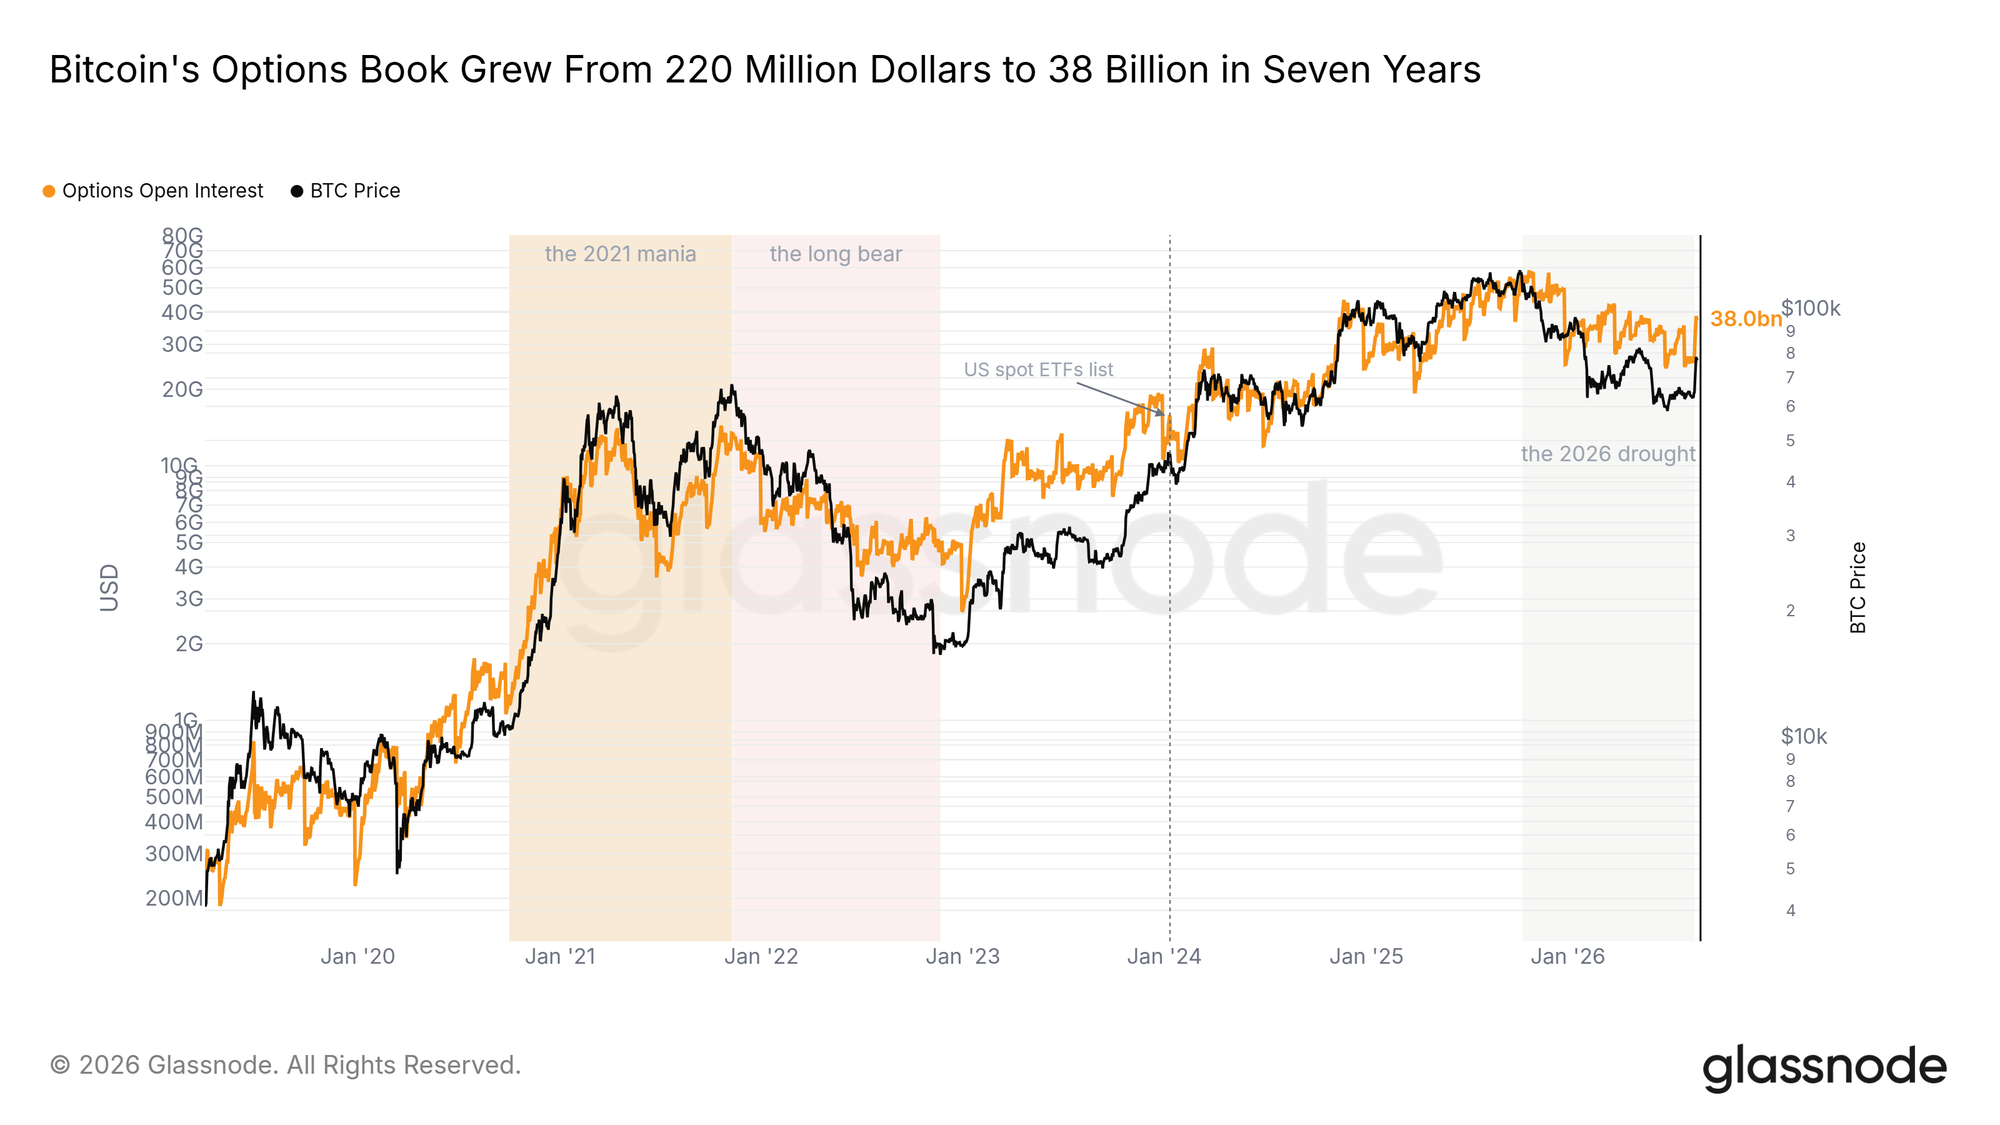
The options book grew through two full cycles
Seven years, two full cycles, and the climb barely paused for the bear market.
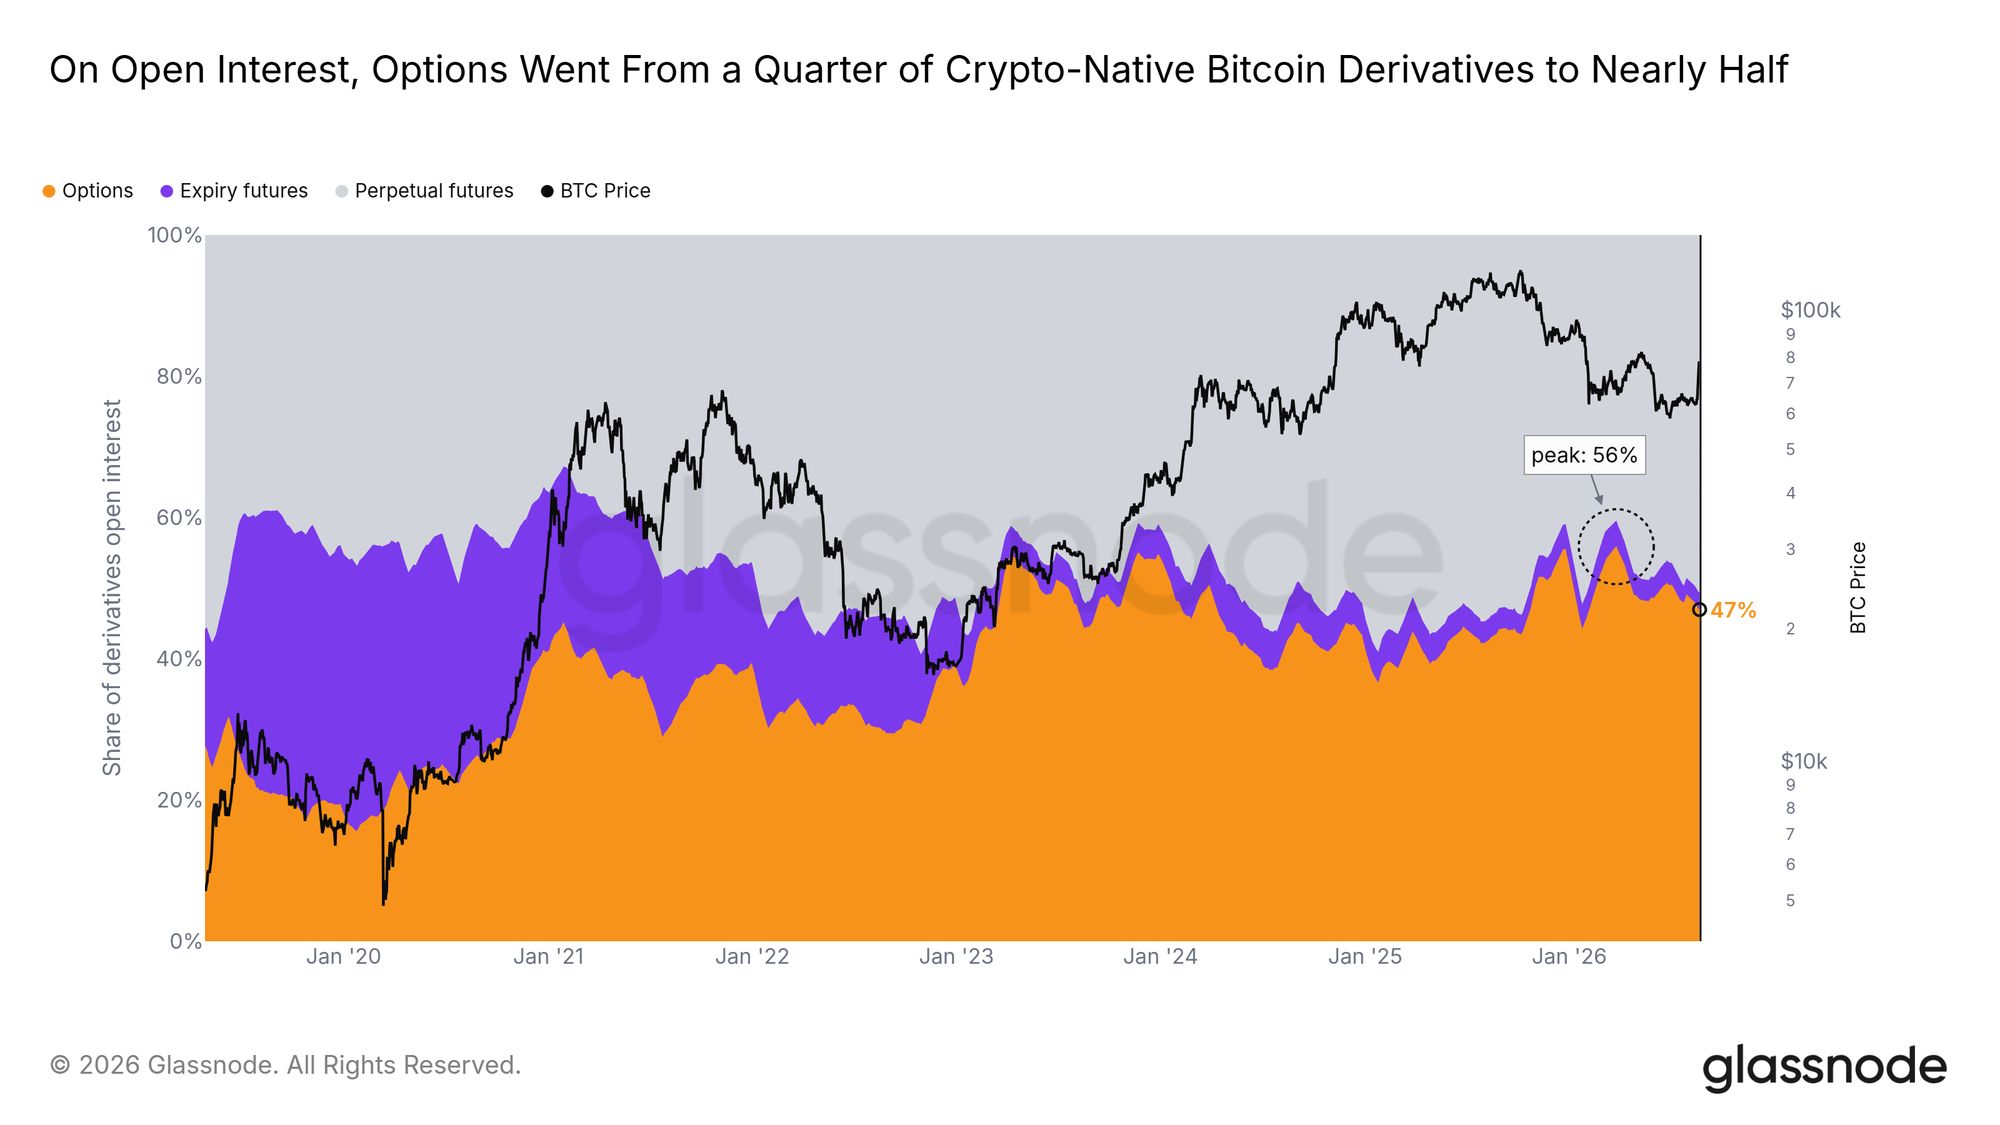
Options took the share that dated futures gave up
Dated futures faded from the crypto-native venues, perpetuals absorbed their leverage, and options took the share they left over.
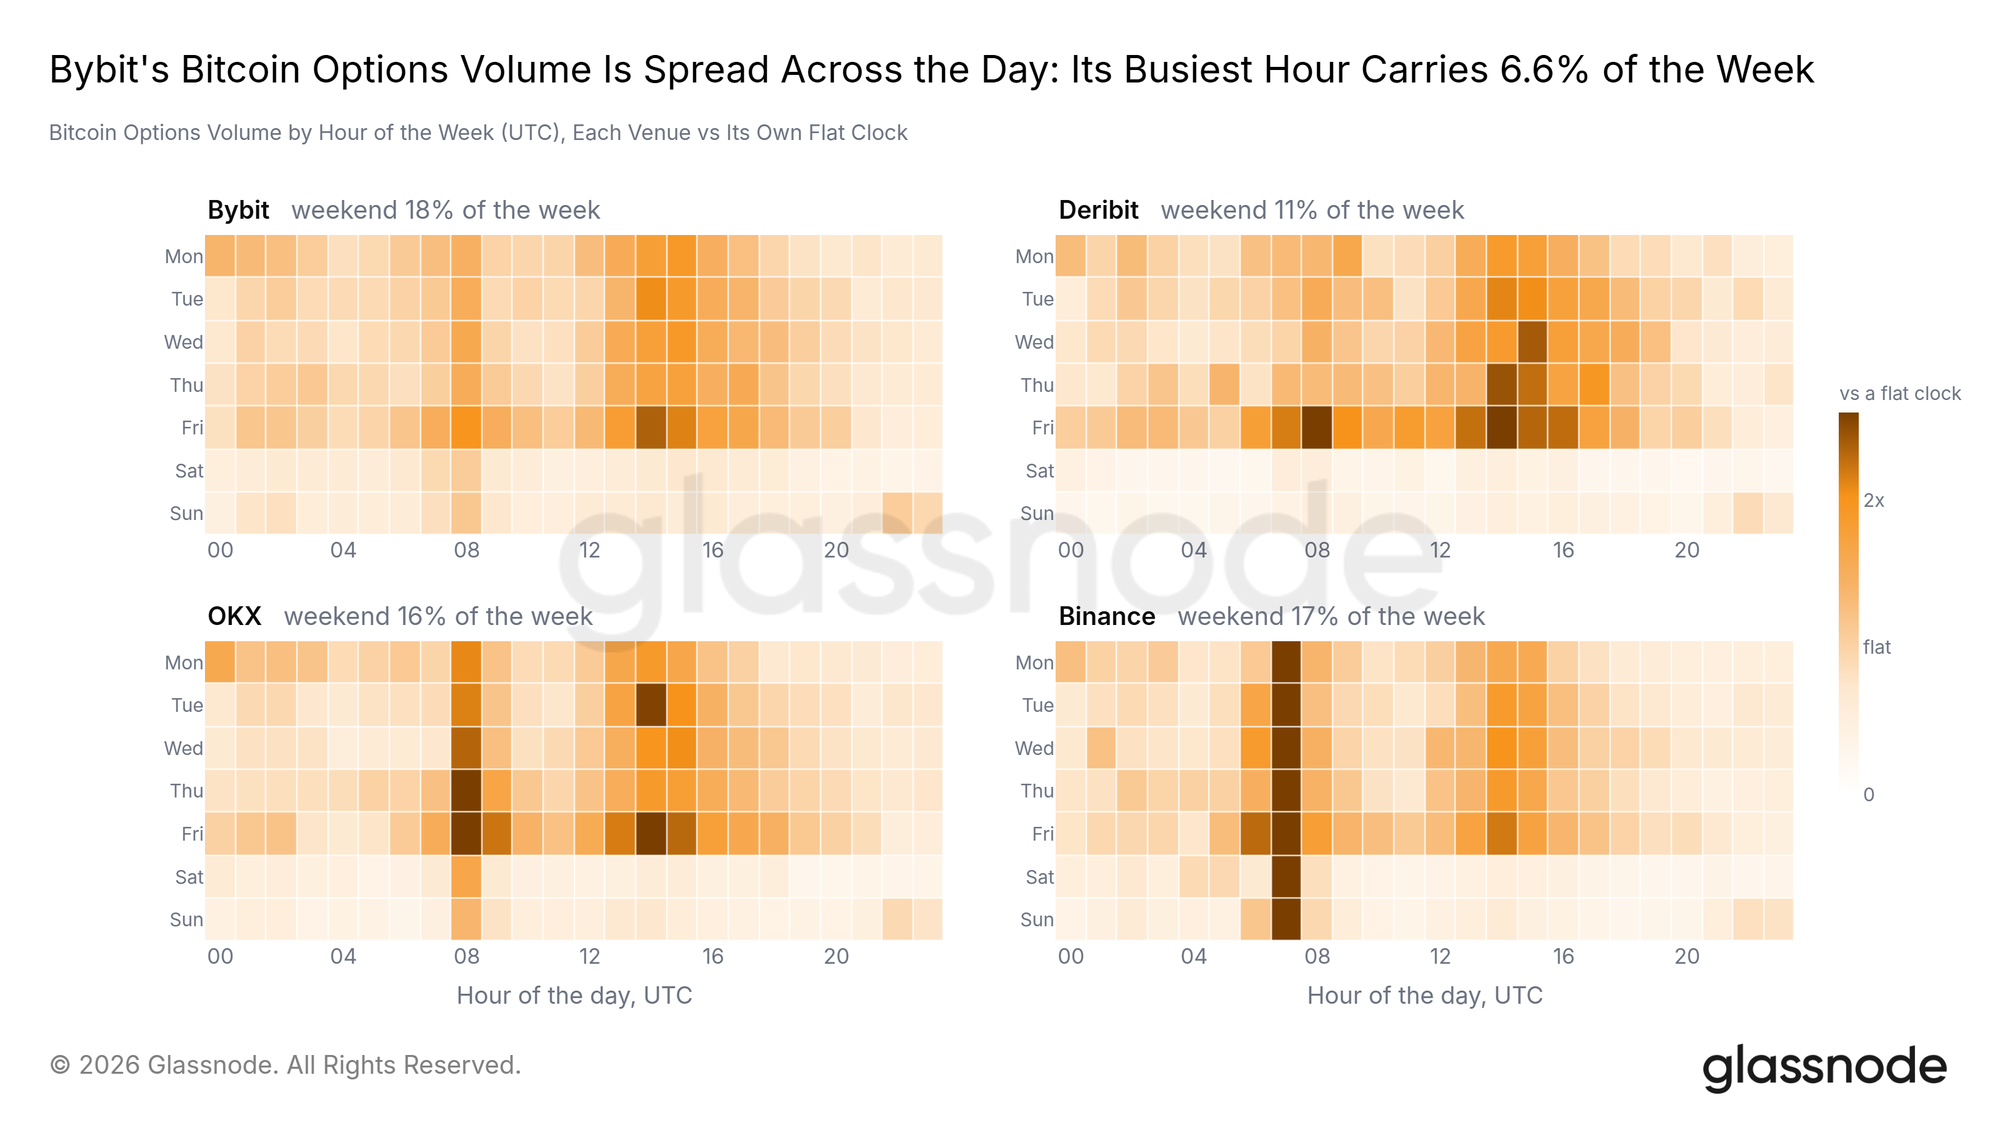
Each venue's traders keep different hours
Hour by hour, the profile shows when the traders on each venue are actually active. Each exchange has a distinct profile.
What else the report covers
- How the market carries leverage: the collateral behind it moved from coin to stable value.
- The venue map for options, perpetuals and tokenised gold, every venue compared the same way.
- Bybit's own book: its options franchise, its Ether and metals complexes, and a trading week that runs around the clock.
- What volatility costs: the implied volatility surface, and options priced against the volatility the market delivered.
- Five days in August: how the sharpest week of the drawdown traded in open interest, skew and the curve.
To explore the data and insights, download the full analysis in PDF format.
Disclaimer: This report does not provide any investment advice. All data is provided for information and educational purposes only. No investment decision shall be based on the information provided here and you are solely responsible for your own investment decisions. We urge users to exercise caution and discretion when utilizing these metrics. Glassnode shall not be held responsible for any discrepancies or potential inaccuracies.
- Follow us on X for timely market updates and analysis
- Join our Telegram channel
- For on-chain metrics, dashboards, and alerts, visit Glassnode Studio
