BTC Market Pulse: Week 47
Bitcoin trades near $64k on Monday after a weekly slide of about 13%. Leverage was flushed and ETF selling continued, while short-term holders sit at a loss and loss-taking is the heaviest since July.


Overview
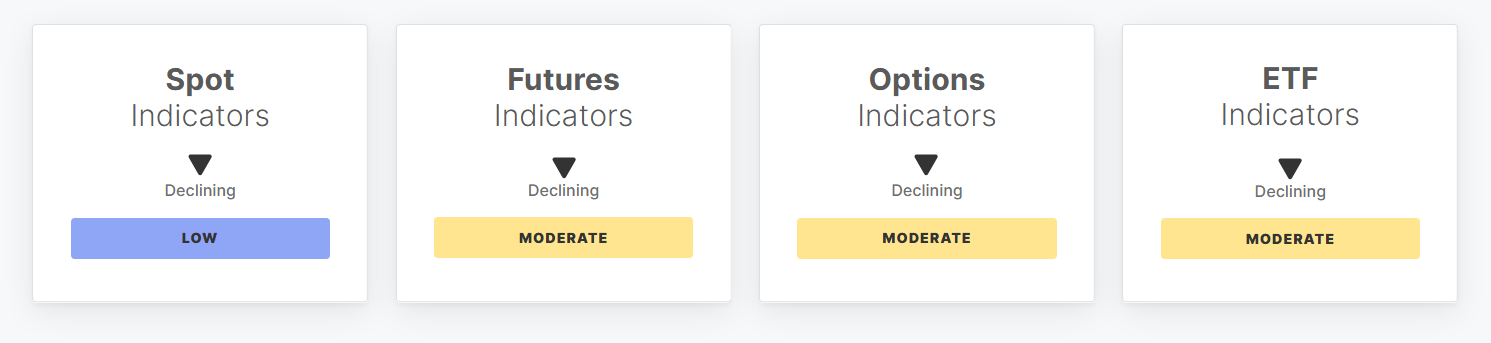
Bitcoin trades near $64k on Monday after closing the week about 13% lower. The slide began on Thursday and gathered pace into the weekend, when the price briefly fell below $63k and Saturday set the lowest close since mid-August. Momentum dropped below its low band, and spot and perpetual takers sold hard on the way down, pushing both CVD readings below their low bands while spot volume climbed above its high band.
The sell-off cleared much of the leverage that had built up. Futures open interest fell to the bottom of its range, and funding payments dropped back inside their range after weeks above the high band. Options traders turned to protection instead: the 25-delta skew sits further above its high band, while the volatility spread narrowed as realized volatility caught up with implied.
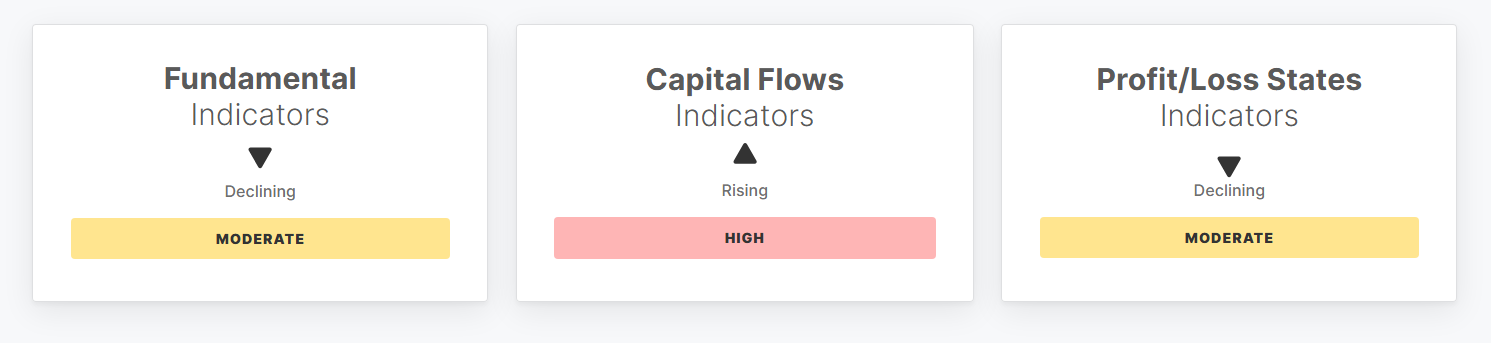
ETF investors kept selling, with outflows on every trading day, and ETF MVRV slid toward 1.0, close to the break-even point of the average fund holder. On-chain activity stays elevated, with active addresses above their high band and transfer volume near it, a sign of coins changing hands rather than a quiet market.
The losses fall on newer holders. Short-term holders now hold coins at a loss on average, and realized losses outweigh profits by the widest margin since July. In short, ETF selling and stressed recent buyers weigh on price, but the leverage flush and deeply oversold momentum leave the market less crowded than a week ago.
Off-Chain Indicators
Read every off-chain indicator
Spot Indicators
Price Momentum. Decreased by 36.1% to 22.8 compared to 35.6 seven days ago. Price Momentum fell below its low band on Wednesday and slid further as the sell-off gathered pace, ending at its weakest reading since June. Momentum is deeply oversold, which shows how one-sided the selling has been, though such readings describe the force of the move rather than its end.
Spot CVD. Decreased by $82.2M to -$133.7M compared to -$51.5M seven days ago. Spot CVD dropped below its low band as cash market takers sold heavily from Thursday through Saturday. Selling faded on Sunday, but spot buyers have yet to absorb the decline, so the reading still points to sellers in control of the cash market and little appetite to buy the drop.
Spot Volume. Increased by 24.5% to $8.2B compared to $6.6B seven days ago. Spot Volume climbed above its high band on Saturday and reached its highest level since late August, as turnover surged during the slide. Heavy trading into a falling price shows sellers meeting active buyers, a sign of broad repositioning in the cash market rather than a quiet drift lower on thin liquidity.
Futures Indicators
Futures Open Interest. Decreased by 7.2% to $34.2B compared to $36.9B seven days ago. Futures Open Interest fell to the bottom of its range and sits near its low band, the lowest level since August. Positions closed in size as price broke lower from Thursday, so a large part of the leverage built in recent weeks has been flushed out, leaving the market less exposed to forced selling.
Long-Side Funding Payment. Decreased by 29.4% to $2.0M compared to $2.8M seven days ago. Long-Side Funding Payment fell back below its high band on Saturday, after weeks above it, as funding rates cooled through the sell-off. Longs now pay a much smaller premium to hold exposure, a sign that crowded bullish positioning in perpetuals has largely cleared and that the long side has lost its appetite.
Perpetual CVD. Decreased by $924.2M to -$1.4B compared to -$493.0M seven days ago. Perpetual CVD fell below its low band on Wednesday and reached its deepest reading on Saturday, as perpetual takers sold aggressively into the breakdown. Selling slowed on Sunday, but leveraged traders still lean heavily to the sell side, which shows conviction behind the move rather than a passing flush of positions.
Options Indicators
Options Open Interest. Decreased by 2.8% to $31.9B compared to $32.8B seven days ago. Options Open Interest slipped just below its low band on Saturday, as contracts were closed during the sell-off and the raw total fell to its lowest point of the week. It rebuilt on Sunday, so the drop reflects risk being trimmed into the decline rather than traders leaving the options market.
Volatility Spread. Decreased by 64.7% to 6.4% compared to 18.3% seven days ago. Volatility Spread narrowed toward the middle of its range as realized volatility rose with the sell-off and caught up with the premium priced into options. Implied volatility jumped on Saturday as well, so options traders still pay for uncertainty, but realized swings now justify most of that price.
Options 25-Delta Skew. Increased by 30.9% to 13.7% compared to 10.5% seven days ago. Options 25-Delta Skew stays above its high band and pushed to its highest level since August, as puts gained a wider premium over calls during the slide. Demand for downside protection is strong, a sign that options traders are hedging against further losses rather than positioning for a rebound.
ETF Indicators
US Spot ETF Netflow (Weekly). Increased by $138.5M to -$995.4M compared to -$1.1B seven days ago. US Spot ETF Netflow (Weekly) moved back inside its range at the bottom, as weekly outflows eased slightly from the week before. The funds still saw net selling on every trading day, so institutional demand stays weak, and the return inside the bands owes more to a wider low band than to new buying.
US Spot ETF Trade Volume (Weekly). Decreased by 11.2% to $11.5B compared to $12.9B seven days ago. US Spot ETF Trade Volume (Weekly) eased into the lower part of its range, as trading in the funds slowed after a busy start to the week. Turnover stayed moderate even as the price fell sharply, which suggests ETF investors reduced exposure steadily rather than in a rush for the exit.
US Spot ETF MVRV. Decreased by 16.9% to 1.06 compared to 1.28 seven days ago. US Spot ETF MVRV stays below its low band and slid toward 1.0, the level where the average ETF holder breaks even. The funds' profit cushion has nearly disappeared in the sell-off, which adds pressure on investors who bought at higher prices and leaves little unrealized gain to protect.
On-Chain Indicators
Read every on-chain indicator
Fundamental Indicators
Total Fee Volume. Decreased by 10.1% to $200.3K compared to $222.7K seven days ago. Total Fee Volume fell into the lower part of its range on Sunday after holding steady through most of the week. Demand for block space did not rise with the sell-off, so on-chain users are not competing for urgent settlement, and network activity stays calm despite the volatility in price.
Entity-Adjusted Transfer Volume. Increased by 3.6% to $5.4B compared to $5.2B seven days ago. Entity-Adjusted Transfer Volume rose into the upper part of its range and sits near its high band, after a brief push above it on Tuesday. Large amounts of capital keep moving between entities during the sell-off, which points to active reallocation as coins change hands at lower prices.
Daily Active Address Count. Decreased by 1.1% to 659.7K compared to 667.0K seven days ago. Daily Active Address Count stays just above its high band, though it eased from midweek as the decline went on. Participation on the network remains elevated, which signals that the sell-off draws in a broad base of users moving coins rather than a few large players acting alone.
Capital Flows Indicators
Realized Cap Change (Monthly). Decreased by 91.0% to 0.04% compared to 0.43% seven days ago. Realized Cap Change (Monthly) slowed almost to zero and sits in the middle of its range, as the inflows of the past month faded with the price. Fresh capital has stopped entering the network on balance, so the realized value of supply has flattened, a sign that demand no longer outpaces coins sold at a loss.
STH to LTH Supply Ratio. Increased by 0.8% to 15.1% compared to 15.0% seven days ago. STH to LTH Supply Ratio stays above its high band and edged up to its highest level since March. Newer holders keep taking a larger share of supply from long-term holders, so more coins sit with price-sensitive buyers, which leaves the market more reactive to sharp swings in price.
Hot Capital Share. Increased by 0.3% to 22.0% compared to 21.9% seven days ago. Hot Capital Share stays well above its high band, at its highest level since March, as coins bought within the last three months make up a growing part of the realized value. This large share of recent, price-sensitive capital raises the sell-side liquidity risk while the price falls.
Profit/Loss States Indicators
Percent Supply in Profit. Decreased by 8.5% to 55.3% compared to 60.4% seven days ago. Percent Supply in Profit fell into the lower part of its range, its lowest level since August, as the sell-off pushed more coins underwater. Only a little more than half of supply now sits in profit, which thins the cushion of unrealized gains and puts more holders under pressure.
Net Unrealized Profit to Loss Ratio. Decreased by 8.3 points to -7.4% compared to 0.9% seven days ago. Net Unrealized Profit to Loss Ratio for short-term holders turned negative and fell into the lower part of its range, its lowest level since July. The average recent buyer now holds coins at a loss, a sign of stress among newer investors, though the reading stays inside its range.
Realized Profit to Loss Ratio. Decreased by 0.53 to -1.28 compared to -0.75 seven days ago. Realized Profit to Loss Ratio fell below its low band on Wednesday and kept falling, to its lowest reading since the start of July. Coins spent at a loss far outweigh those spent in profit, the mark of capitulation by holders who bought higher and a pattern typical of fear-driven conditions.
🔗 Access the full report in PDF

- Follow us and reach out on X
- Join our Telegram channel
- For on-chain metrics, dashboards, and alerts, visit Glassnode Studio
Disclaimer: This report does not provide any investment advice. All data is provided for information and educational purposes only. No investment decision shall be based on the information provided here and you are solely responsible for your own investment decisions.
Exchange balances presented are derived from Glassnode’s comprehensive database of address labels, which are amassed through both officially published exchange information and proprietary clustering algorithms. While we strive to ensure the utmost accuracy in representing exchange balances, it is important to note that these figures might not always encapsulate the entirety of an exchange’s reserves, particularly when exchanges refrain from disclosing their official addresses. We urge users to exercise caution and discretion when utilizing these metrics. Glassnode shall not be held responsible for any discrepancies or potential inaccuracies.
Please read our Transparency Notice when using exchange data.
