BTC Market Pulse: Week 38
Bitcoin slips to $76.8k, down 4.4% on the week, yet holds its range. Spot and perpetual selling and ETF outflows weigh, but capital inflows and elevated profitability show a market absorbing pressure, not breaking down.



Overview
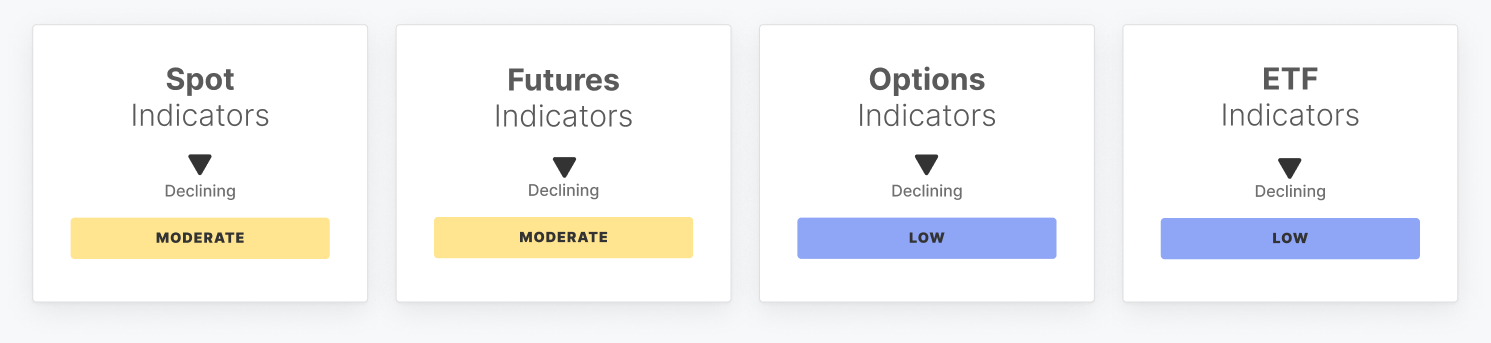
Bitcoin trades near $76,800, down 4.4% on the week, yet the $76,600 area has held on every close since Thursday and the pullback has stayed inside a $76,600 to $80,400 range. Spot conditions have softened. Price momentum fell from 54.6 to 46.5 and stays inside its statistical bands, while spot CVD moved from -$29.7M to -$142.7M, below its low band of -$115.3M, a sign of net selling on centralized exchanges. Spot volume eased from $5.3B to $4.9B and remains within its normal range.
Derivatives show leverage that is elevated but no longer growing. Futures open interest slipped from $37.1B to $36.4B yet still sits above its high band of $36.0B, and long-side funding payments rose from $1.3M to $1.4M within their bands. Perpetual CVD dropped from -$85.6M to -$605.9M, far below its low band of -$233.9M, pointing to aggressive taker selling. In options, open interest holds near $40.0B above its high band, the volatility spread widened to -22.34%, below its low band, and the 25-delta skew rose from -2.05% to 0.94% but remains below its low band of 3.75%.
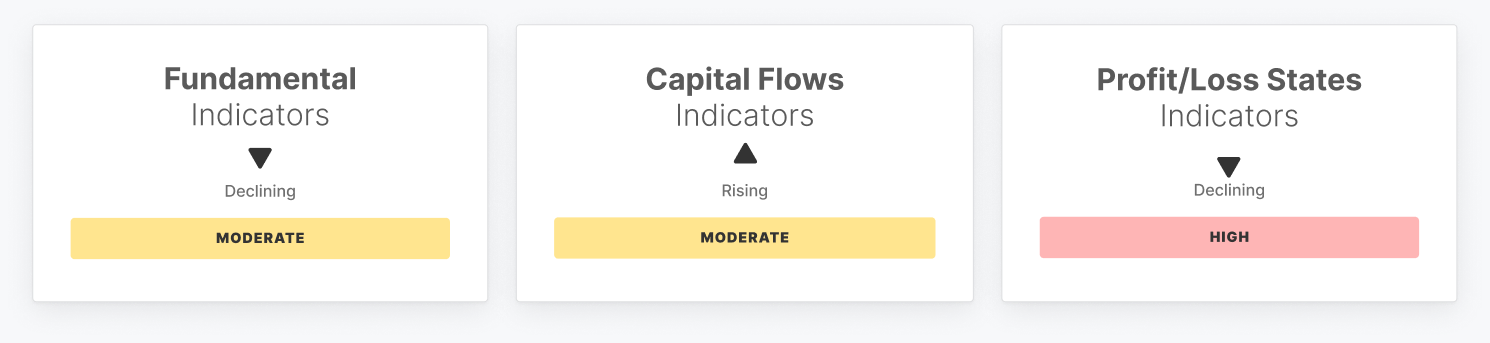
US spot ETF demand reversed. Weekly netflow swung from $753.2M of inflows to $467.5M of outflows and weekly trade volume fell from $12.1B to $8.7B, both below their low bands, while ETF MVRV eased to 1.34 inside its bands. On-chain activity cooled within its normal range: fee volume fell to $202.6K, transfer volume to $4.0B and active addresses to 610.8K.
Capital flows remain constructive: monthly realized cap change rose to 1.0%, above its upper band of 0.2%, while the STH to LTH ratio (13.7%) and hot capital share (17.6%) sit within their bands. Profitability is elevated but easing: 66.2% of supply is in profit and net unrealized profit to loss reads 8.4%, both above their high bands, while the realized profit to loss ratio fell from 1.0 to 0.5, still positive near its high band. In short, spot, derivatives and ETF flows lean to the sell side, but price holds its range, leverage is not unwinding and loss-taking stays contained. So far the market absorbs the selling rather than breaking down, new capital keeps entering and most of the supply remains in profit.
Off-Chain Indicators
On-Chain Indicators
🔗 Access the full report in PDF

- Follow us and reach out on X
- Join our Telegram channel
- For on-chain metrics, dashboards, and alerts, visit Glassnode Studio
Disclaimer: This report does not provide any investment advice. All data is provided for information and educational purposes only. No investment decision shall be based on the information provided here and you are solely responsible for your own investment decisions.
Exchange balances presented are derived from Glassnode’s comprehensive database of address labels, which are amassed through both officially published exchange information and proprietary clustering algorithms. While we strive to ensure the utmost accuracy in representing exchange balances, it is important to note that these figures might not always encapsulate the entirety of an exchange’s reserves, particularly when exchanges refrain from disclosing their official addresses. We urge users to exercise caution and discretion when utilizing these metrics. Glassnode shall not be held responsible for any discrepancies or potential inaccuracies.
Please read our Transparency Notice when using exchange data.
