BTC Market Pulse: Week 35
Bitcoin has surged toward $80k as spot, derivatives and ETF demand accelerate. Rising activity and profitability support the move, though muted macro inflows suggest it remains tactically driven.



Overview
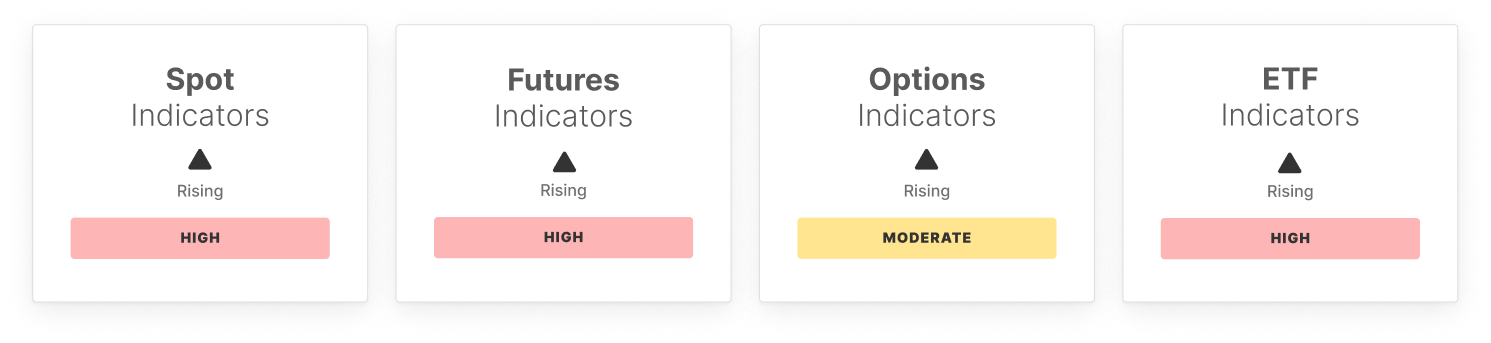
Bitcoin has surged from roughly $63k to nearly $80k over the past week, breaking decisively out of its prior range and holding close to the highs despite brief bouts of consolidation. The move has been supported by aggressive spot buying and a broad expansion in trading activity, with rising turnover and deeper liquidity suggesting meaningful capital deployment rather than thin-market price action.
Derivatives markets reinforce this risk-on shift. Perpetual taker flows have moved sharply in favour of buyers, pushing cumulative volume metrics beyond upper statistical bands, while futures open interest has expanded toward elevated levels. This points to a clear increase in speculative participation and leverage. Institutional demand has strengthened in parallel, with spot ETF trading volumes and weekly net inflows surging well above historical thresholds.
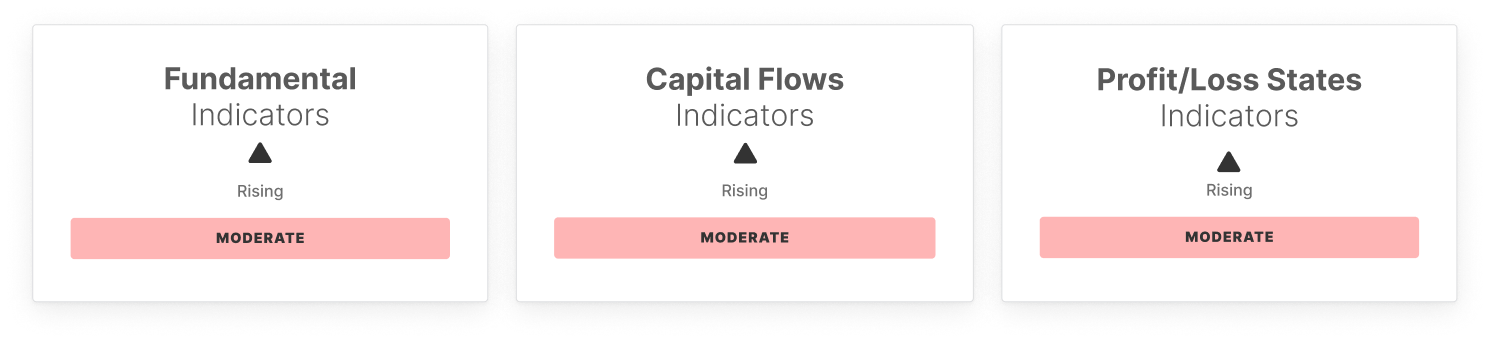
On-chain activity has also accelerated. Daily active addresses have increased alongside a sharp rise in entity-adjusted transfer volume, signalling stronger network engagement and economic throughput. Investor profitability has improved materially, with both unrealised and realised measures moving higher and the share of supply held in profit rising well above historical norms. As profitability expands, spending behaviour is increasingly shifting toward profit-taking rather than loss realisation.
Market structure also reflects a growing presence of price-sensitive capital, with hot capital shares pushing above upper statistical bounds. Broader macro capital inflows, however, remain comparatively muted, suggesting the current expansion is being driven more by active short-term participation and tactical positioning than by sustained long-term capital accumulation.
Off-Chain Indicators
On-Chain Indicators
🔗 Access the full report in PDF

- Follow us and reach out on X
- Join our Telegram channel
- For on-chain metrics, dashboards, and alerts, visit Glassnode Studio
Disclaimer: This report does not provide any investment advice. All data is provided for information and educational purposes only. No investment decision shall be based on the information provided here and you are solely responsible for your own investment decisions.
Exchange balances presented are derived from Glassnode’s comprehensive database of address labels, which are amassed through both officially published exchange information and proprietary clustering algorithms. While we strive to ensure the utmost accuracy in representing exchange balances, it is important to note that these figures might not always encapsulate the entirety of an exchange’s reserves, particularly when exchanges refrain from disclosing their official addresses. We urge users to exercise caution and discretion when utilizing these metrics. Glassnode shall not be held responsible for any discrepancies or potential inaccuracies.
Please read our Transparency Notice when using exchange data.
