Waiting for Buyers
$BTC has broken below $60K as loss realization, ETF outflows, and defensive options positioning continue to weigh on sentiment. Despite growing signs of value and selective accumulation, broad demand remains absent.


Executive Summary
- Bitcoin trades at $62.3k, a 19% discount to the True Market Mean at $77k, with the Short-Term Holder Cost Basis declining to $71.4k, reflecting new buyers accumulating below the cyclical mean for the first time, a constructive early step toward bottom formation.
- The 90-day SMA of Net Realized Profit and Loss sits at -$205M per day, confirming a deeply embedded loss-dominant environment that tilts the market's center of gravity toward the Realized Price at $53.4k rather than the True Market Mean.
- A dense short-term holder supply cluster between $66.8k and $70.7k defines the most immediate overhead resistance, capping near-term upside until this zone is reclaimed and the path toward the Short-Term Holder Cost Basis opens.
- ETF outflows persist: Institutional demand remains weak, with GBTC accounting for the largest share of recent redemptions.
- Coinbase buyers return: US-based investors are showing renewed buy-side activity, while Binance traders remain defensive.
- Spot markets led the sell-off: Selling pressure originated in spot markets, with derivatives largely reacting rather than driving the move.
- Implied volatility has stabilized near recent lows, while realized volatility remains elevated, keeping the volatility risk premium in negative territory.
- Downside protection demand has rebuilt across maturities, with skew rising sharply despite overall volatility pricing remaining relatively contained.
- Recent flow has shifted toward premium selling, while dealer positioning remains dominated by long gamma between 60K and 64K, helping contain volatility around current spot.
Macro Insight
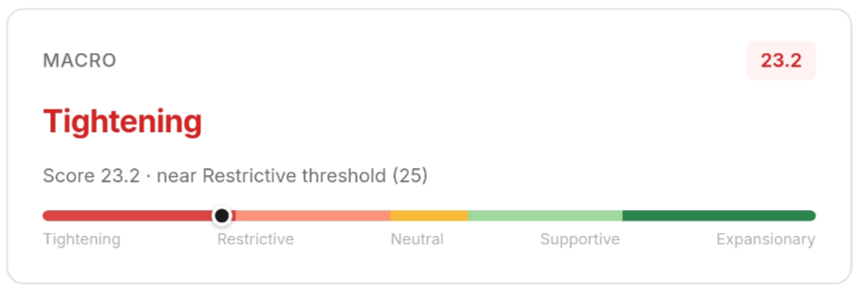
The dollar is back above its 200-day moving average. The DXY printed 101.37 on June 23, up from 99.24 thirty days ago and above the 200D MA at 98.72 for the first time since April's Liberation Day shock. The bullish sequence has not materialised.
The 10-year yield holds at 4.50%, anchored rather than easing. The VIX ticked from 16.2 mid-week to 19.49 by Friday's close. Not a panic read, but the directional move is worth monitoring. Equities have absorbed the spring correction; the S&P 500 at 7,365 sits +14% above its April low and above its own 200-day moving average at 7,007.
Bitcoin is not participating. BTC at $62,651 trades 18% below its 200-day moving average at $76,466. The macro recovery has been an equity story, buffered by US earnings resilience. For Bitcoin, the DXY's reassertion is the dominant signal, and it is not constructive for BTC.
On-chain Insight
Deep in Discount Territory
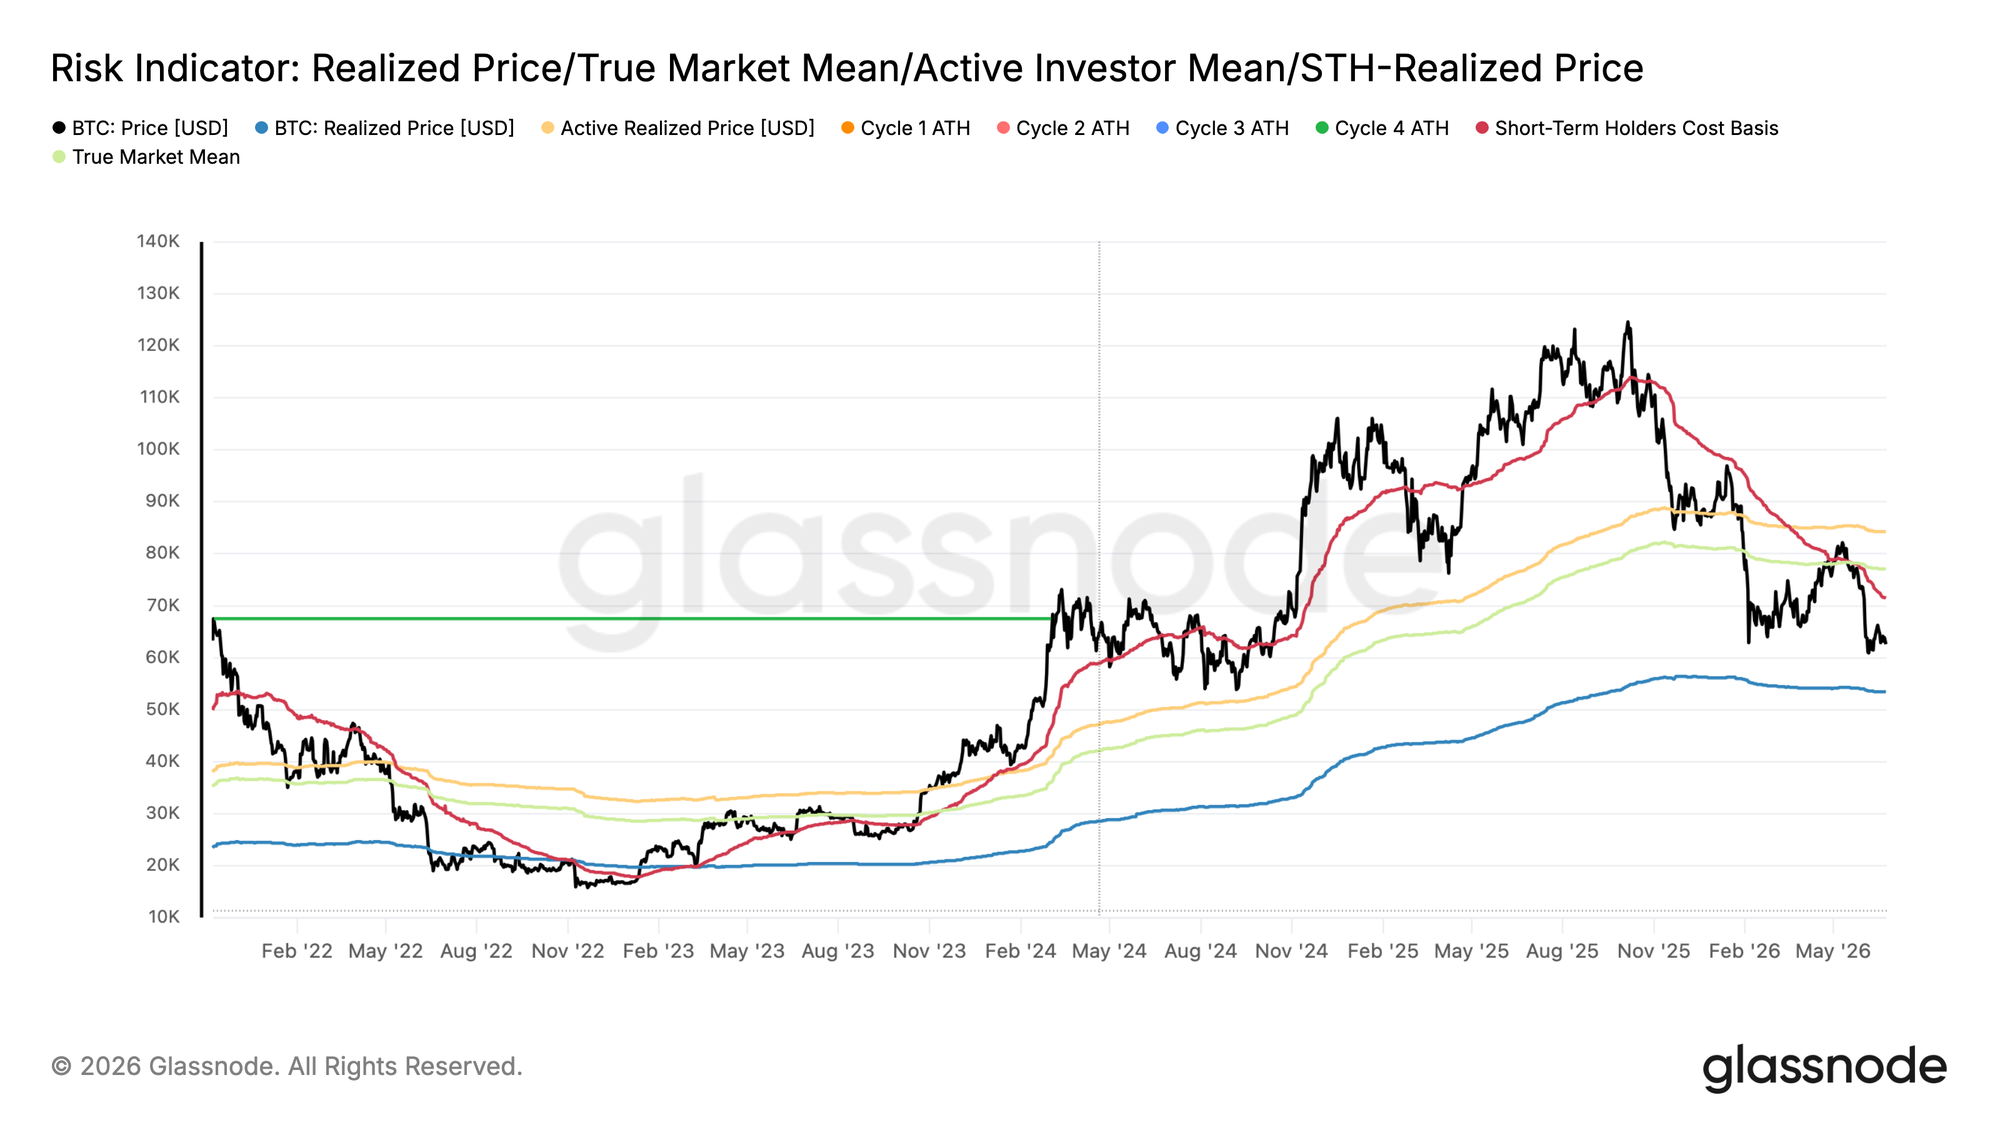
With Bitcoin now trading at $62.3k, the market sits firmly below the True Market Mean at $77k, the average cost basis of non-miner active investors and the key threshold separating bear from bull market regimes. At a 19% discount to this level, price remains deep within structural bear territory.
Notably, the Short-Term Holder Cost Basis has declined to $71.4k, reflecting new buyers accumulating well below the True Market Mean. This is a constructive development from a cyclical perspective, as it marks a key step toward bottom formation where incoming capital is being deployed at prices increasingly disconnected from the recent cycle's overheated levels.
Supply acquired at this stage of the bear market is expected to show greater resilience to further correction, given the comparatively small loss margin relative to the broader cycle overhang supply. Should any macro-driven leg down materialize in coming weeks, the Realized Price at $53.4k represents the most probable lower bound for the bear market range in the short to mid-term.
Gravity Pulling Toward the Lower Band
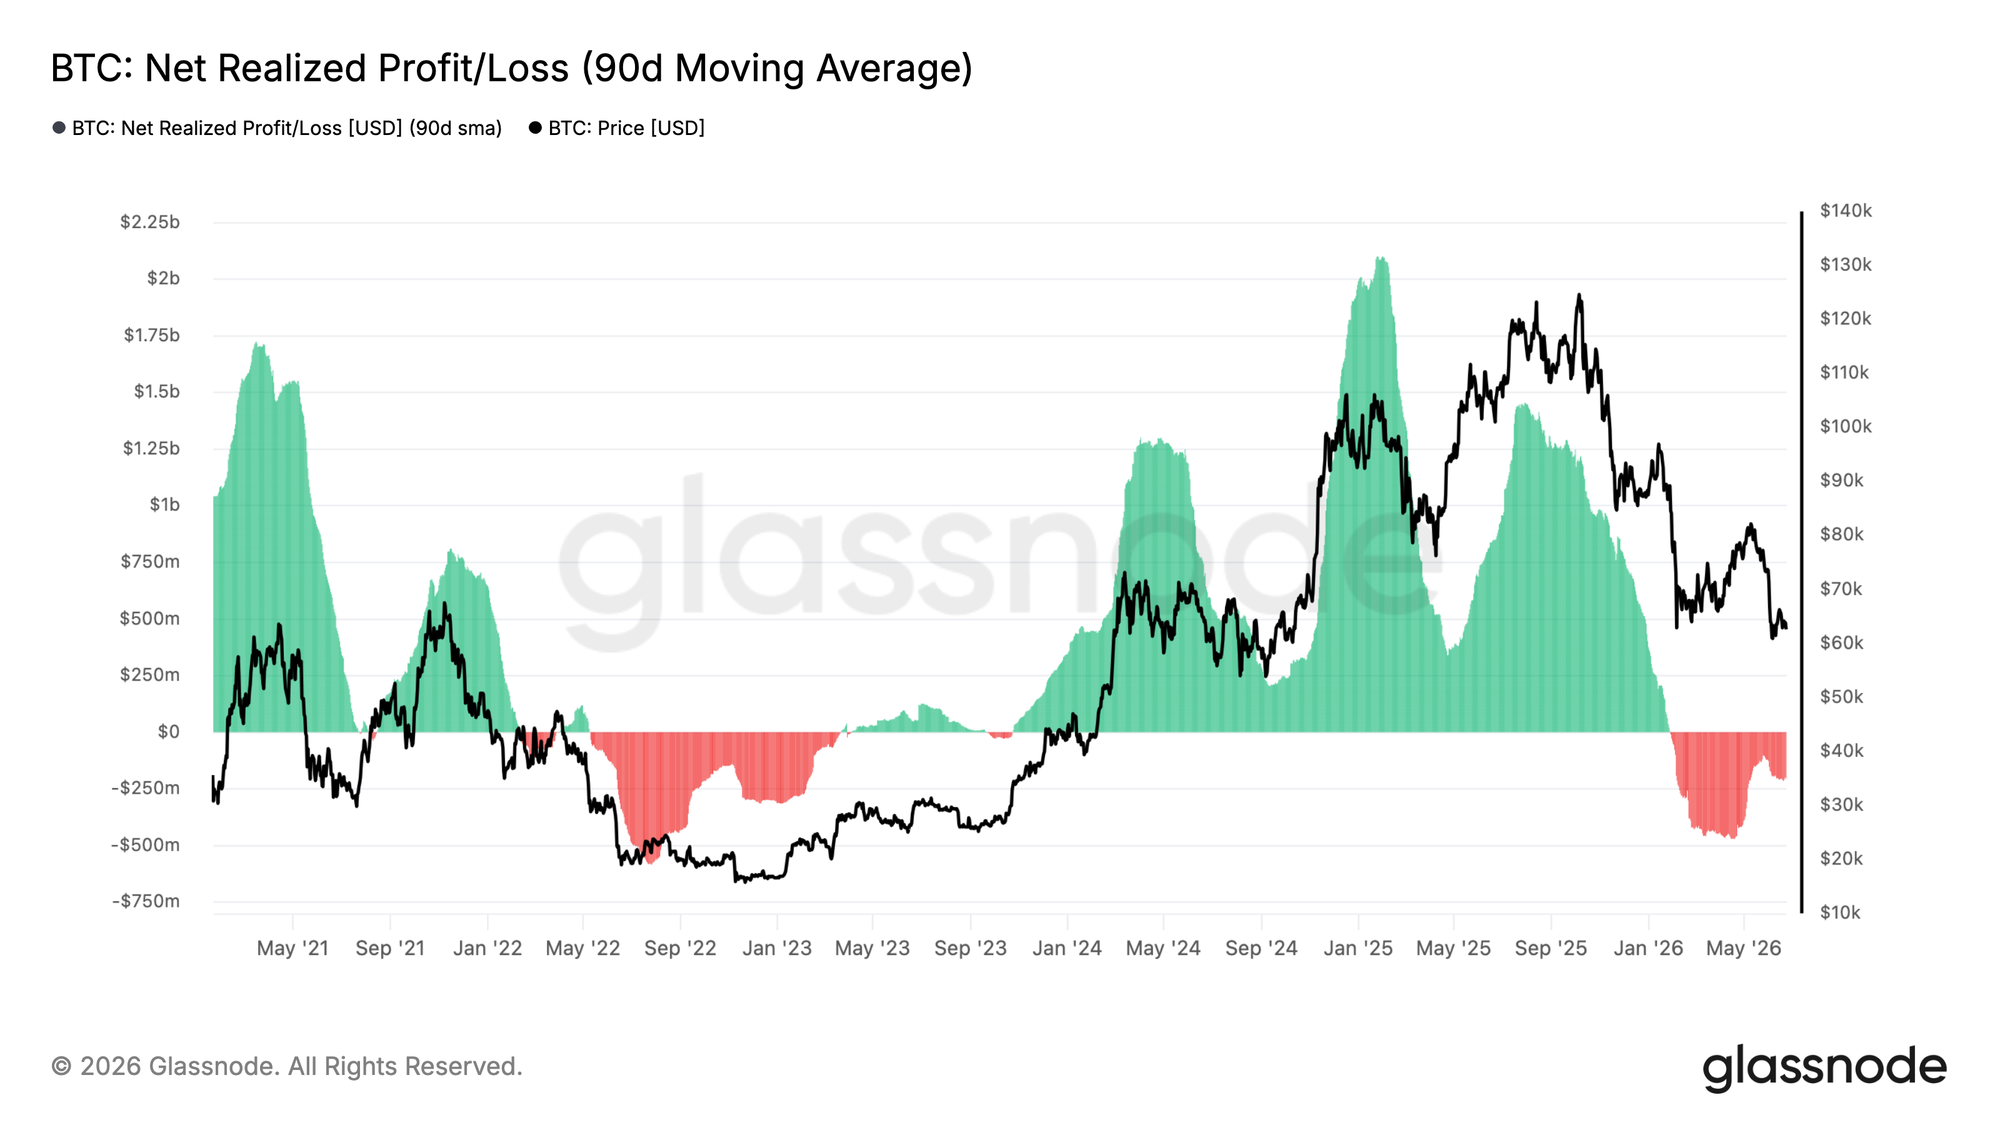
Having established the $53.4k to $77k bear market range, the next question is which end of that range price is more likely to gravitate toward. The Net Realized Profit and Loss measures the net difference between profits and losses being crystallized across the market, denominated in USD, effectively capturing whether the dominant spending behavior is one of profit-taking or capitulation.
The 90-day SMA of this indicator currently reads -$205M per day, confirming that loss realization has been the prevailing force across the broader trend and suggesting the market's center of gravity remains tilted toward the lower band of the current regime near the Realized Price.
Given this is a slow-moving average, the reading reflects a deeply embedded loss-dominant environment rather than a single stress event. A recovery of this metric toward neutral levels near zero would be a strong signal that sell-side exhaustion is taking hold and that the conditions for a pre-bull market transition are beginning to form.
Overhead Supply Caps the Near Term
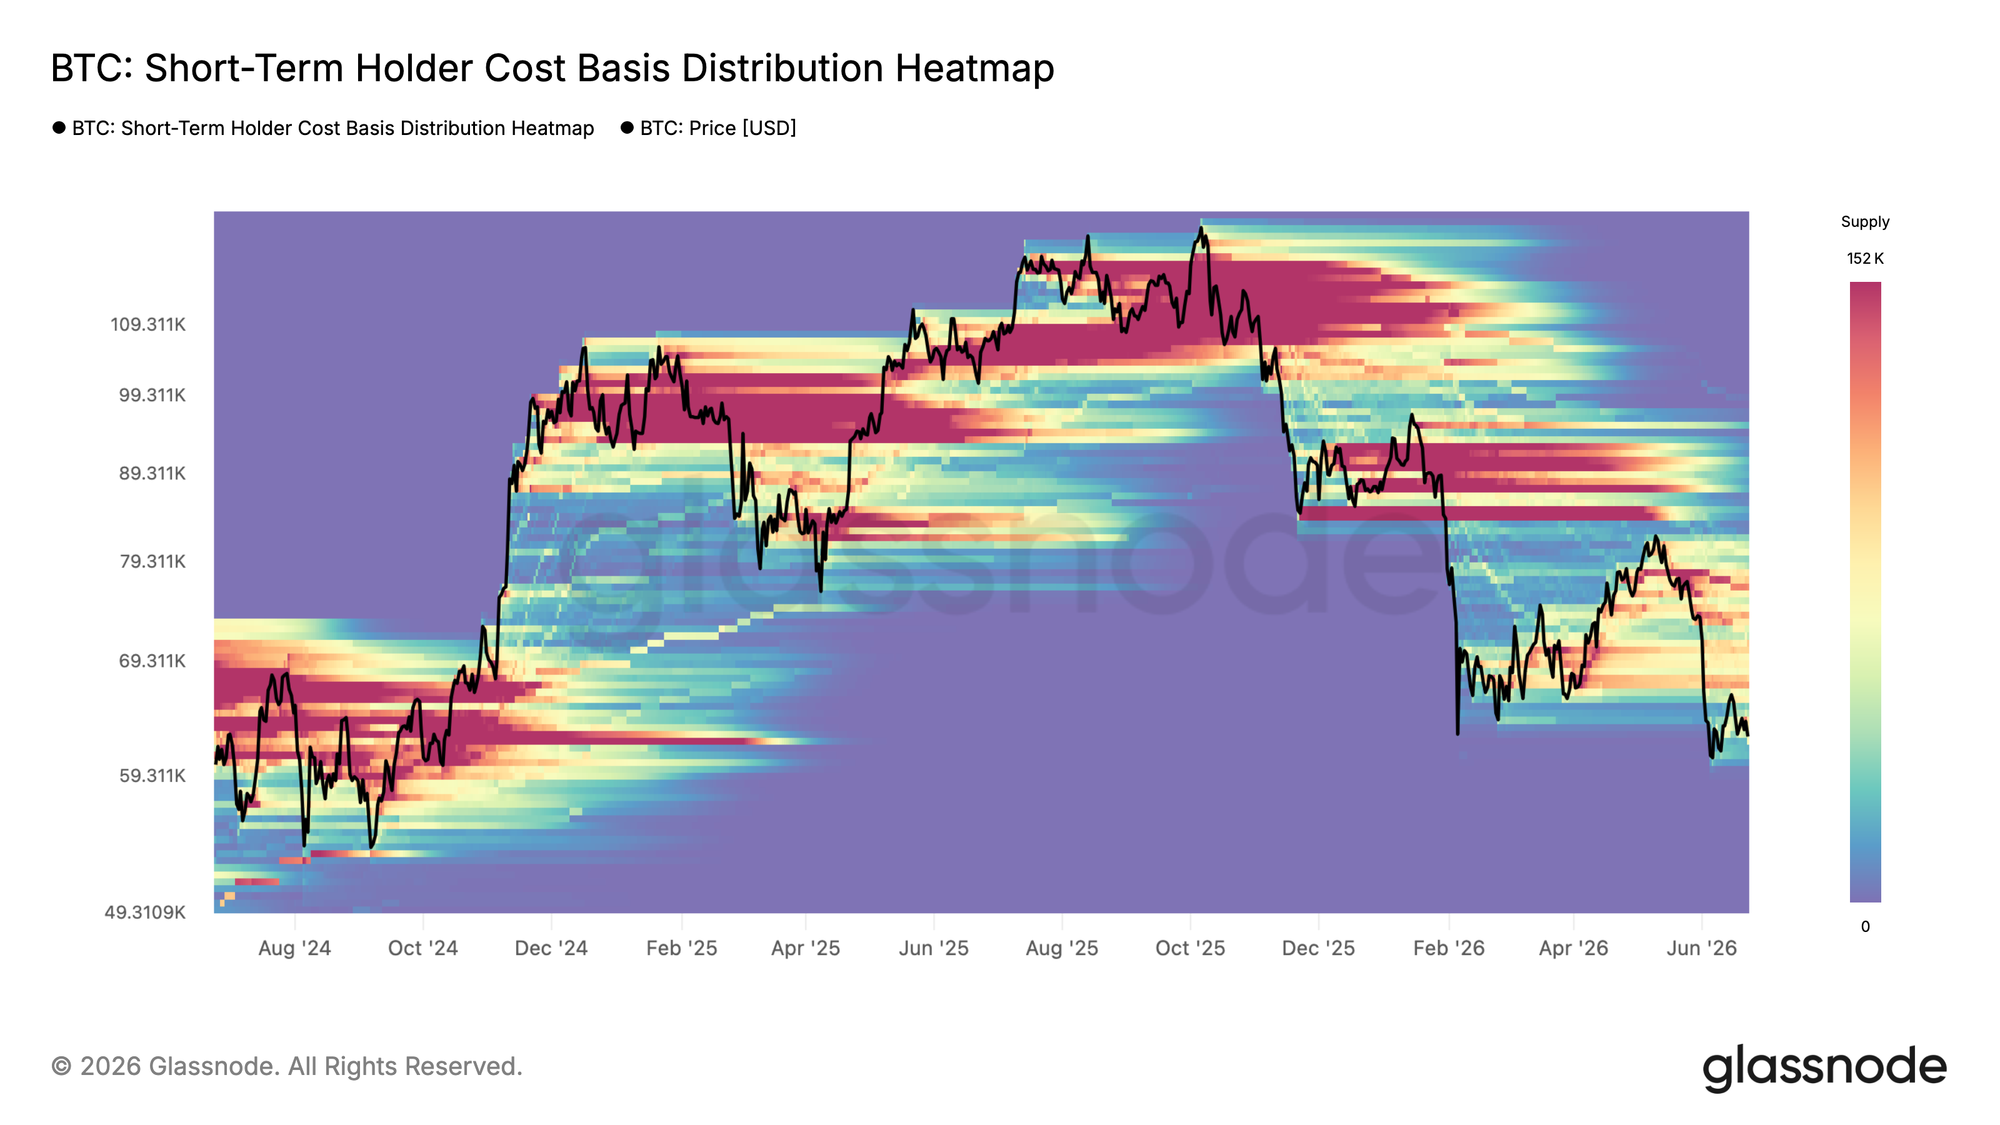
Compounding the broader negative capital flow environment, a more immediate drag on price comes from the local concentration of short-term holder supply sitting above current spot levels. The most notable cluster is clamped within the $66.8k to $70.7k range, representing a dense pocket of recently accumulated coins now held at a loss and likely to generate sell pressure on any attempted recovery.
This zone effectively defines the most probable ceiling for any near-term sideways consolidation or relief bounce, as holders within this range face the behavioral incentive to exit near breakeven as price approaches their acquisition cost. A sustained reclaim above $66.8k would meaningfully reduce this overhead pressure and raise the probability of extending toward the Short-Term Holder Cost Basis at $71.4k in the mid-term. Until then, this local overhang remains an active anchor weighing on upside momentum.
Off-chain Insight
ETF Outflows Continue
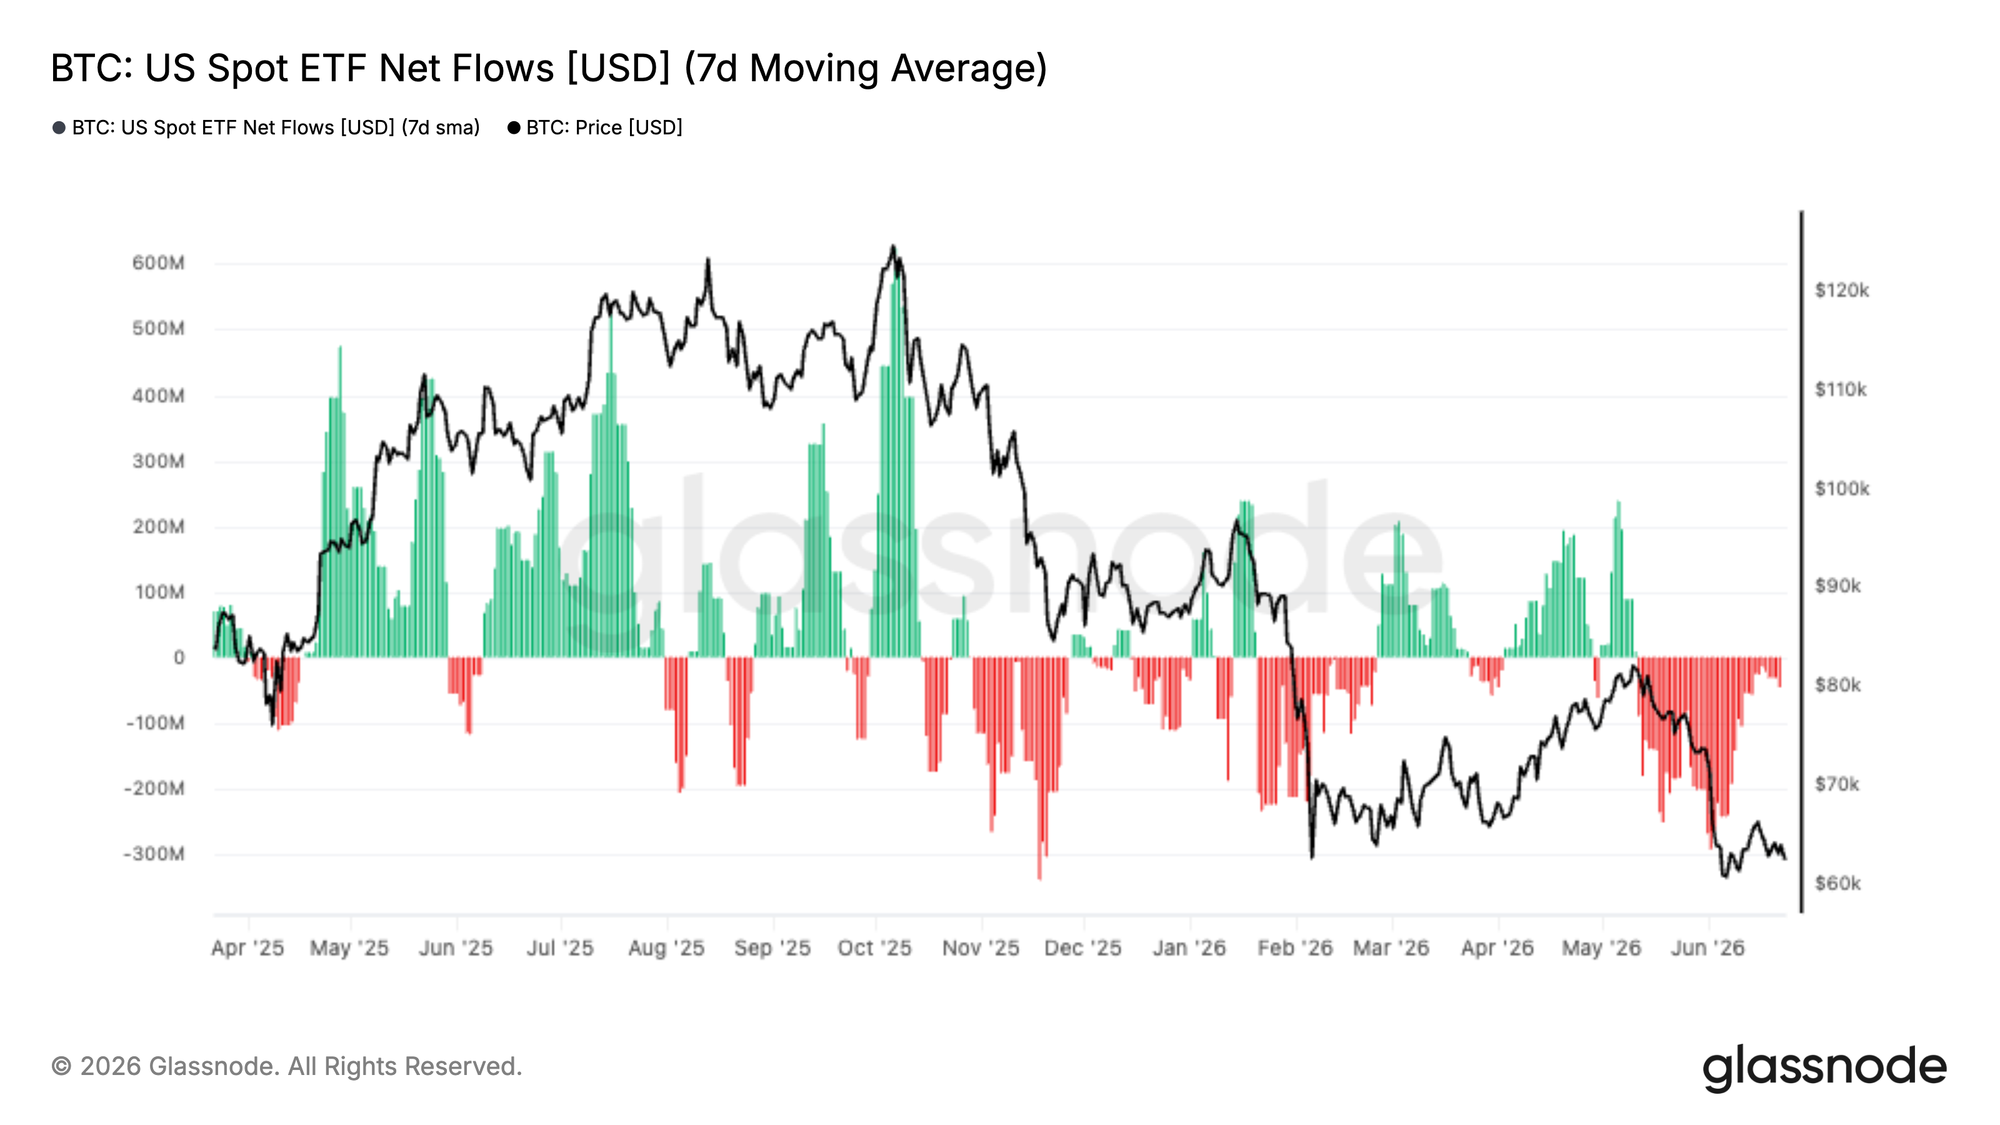
Institutional demand remained under pressure this week, with the 7-day average of US Spot ETF net flows falling to nearly -$300M/day, marking one of the most persistent periods of capital withdrawal since the ETFs launched. The scale and duration of these outflows suggest that traditional investors remain defensive despite Bitcoin trading near the lower end of its recent range around $60K-$65K.
What makes this episode notable is that previous corrections often attracted renewed ETF buying, providing an important source of demand during periods of weakness. This time, however, sustained redemptions indicate that many investors are choosing to reduce exposure rather than accumulate into the drawdown.
While aggregate ETF flows remain negative, the outflows are not evenly distributed across issuers. Grayscale's GBTC continues to account for the largest share of redemptions, with more than 16k BTC exiting the fund over the last 90 days. This suggests the weakness is being driven primarily by legacy holder liquidation and portfolio rebalancing, rather than a uniform retreat across the entire ETF complex.
Spot Buyers Begin to Step Back In
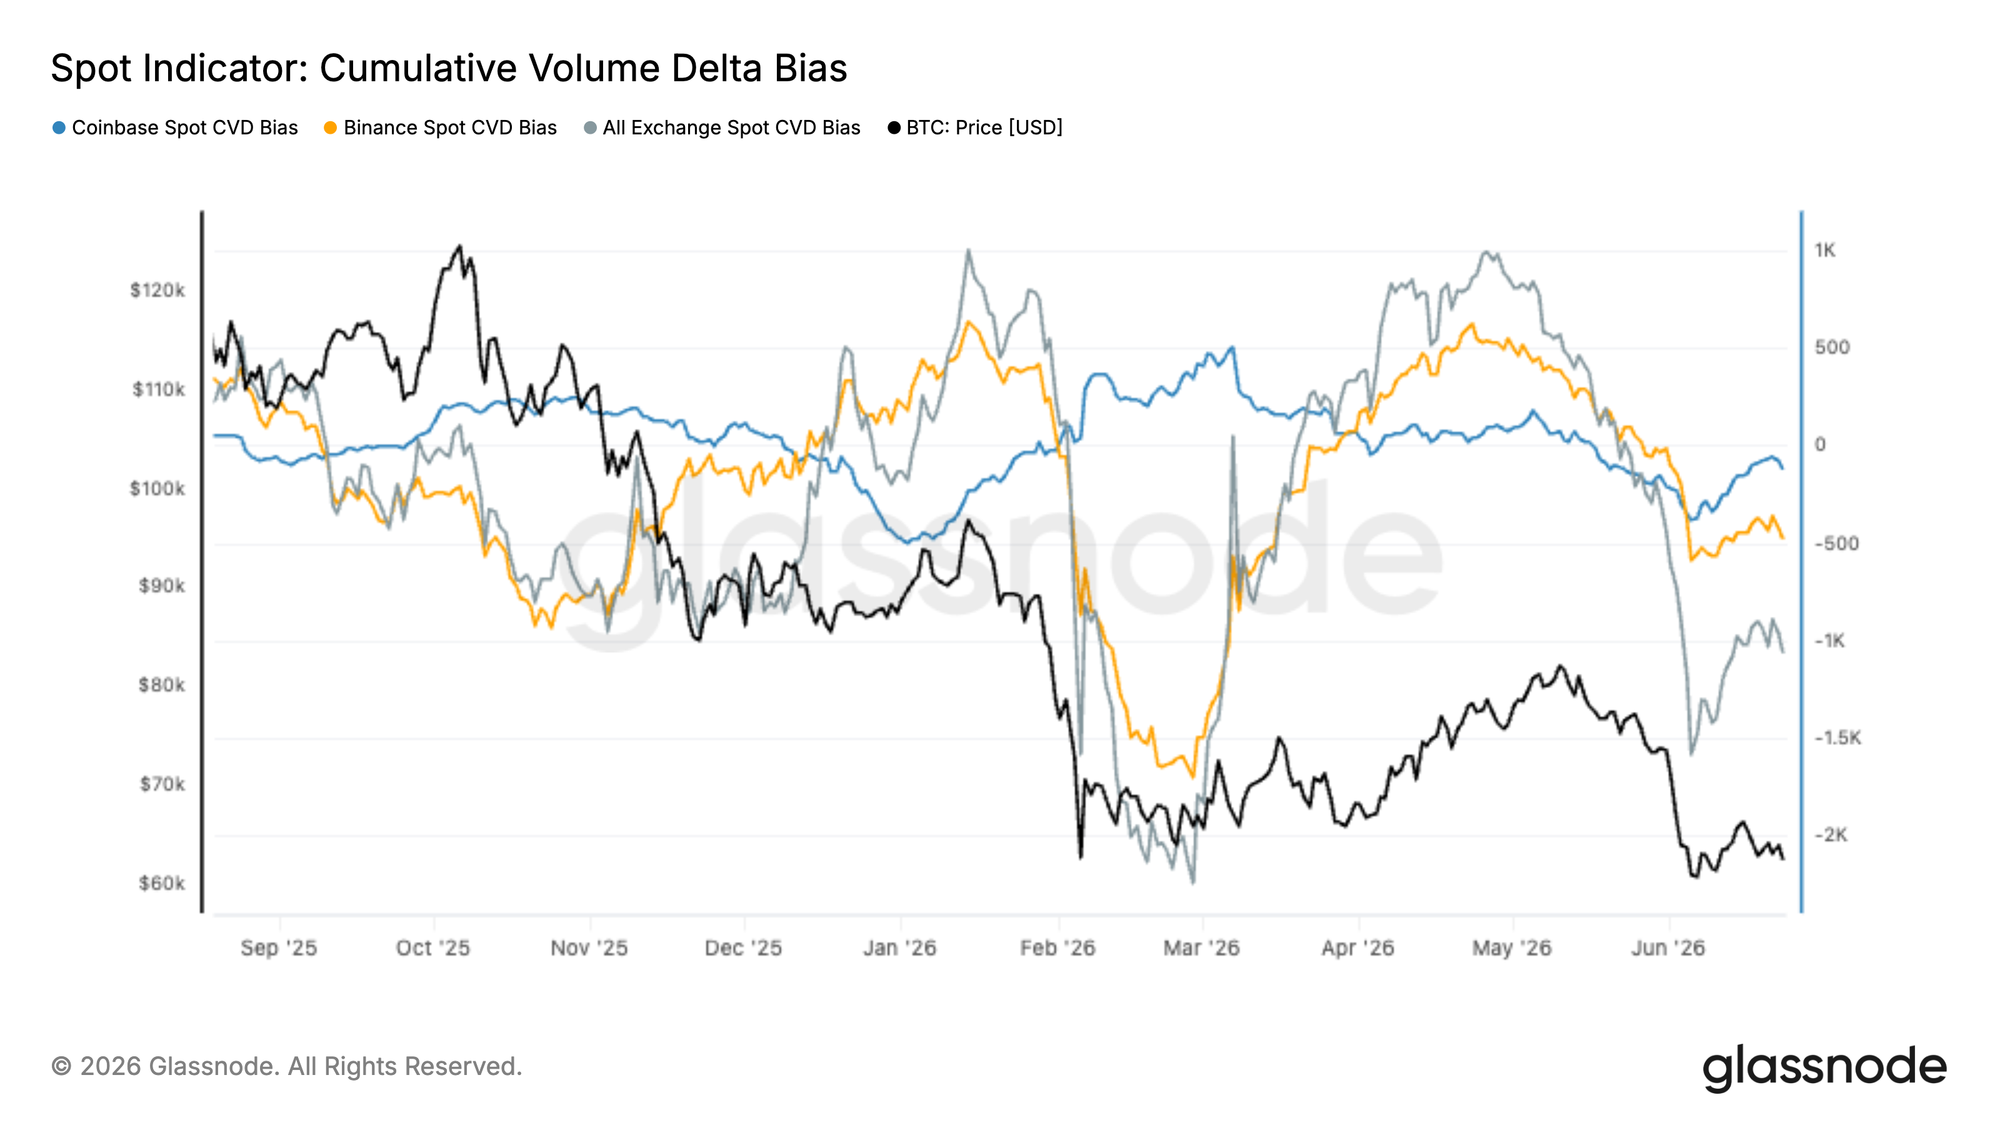
Spot market positioning has started to improve after a prolonged period of aggressive sell-side pressure. While the aggregate Spot CVD Bias remains negative, the recent rebound suggests that net selling intensity is beginning to ease, helping Bitcoin stabilize near the lower end of its trading range.
The most notable development is the divergence between exchanges. Coinbase Spot CVD Bias has recovered sharply and is now back in positive territory, indicating that buy-side activity is returning on a venue typically associated with US institutional participants. Binance, by contrast, remains in negative territory, suggesting offshore traders continue to lean more defensively.
This split in behaviour points to an increasingly uneven market structure. Institutional investors appear to be absorbing supply into weakness, while speculative participants remain cautious. Although the broader spot market has yet to return to sustained accumulation, the improvement in Coinbase demand suggests that some investors are beginning to view current prices as attractive entry levels.

Futures Catch Down to Spot
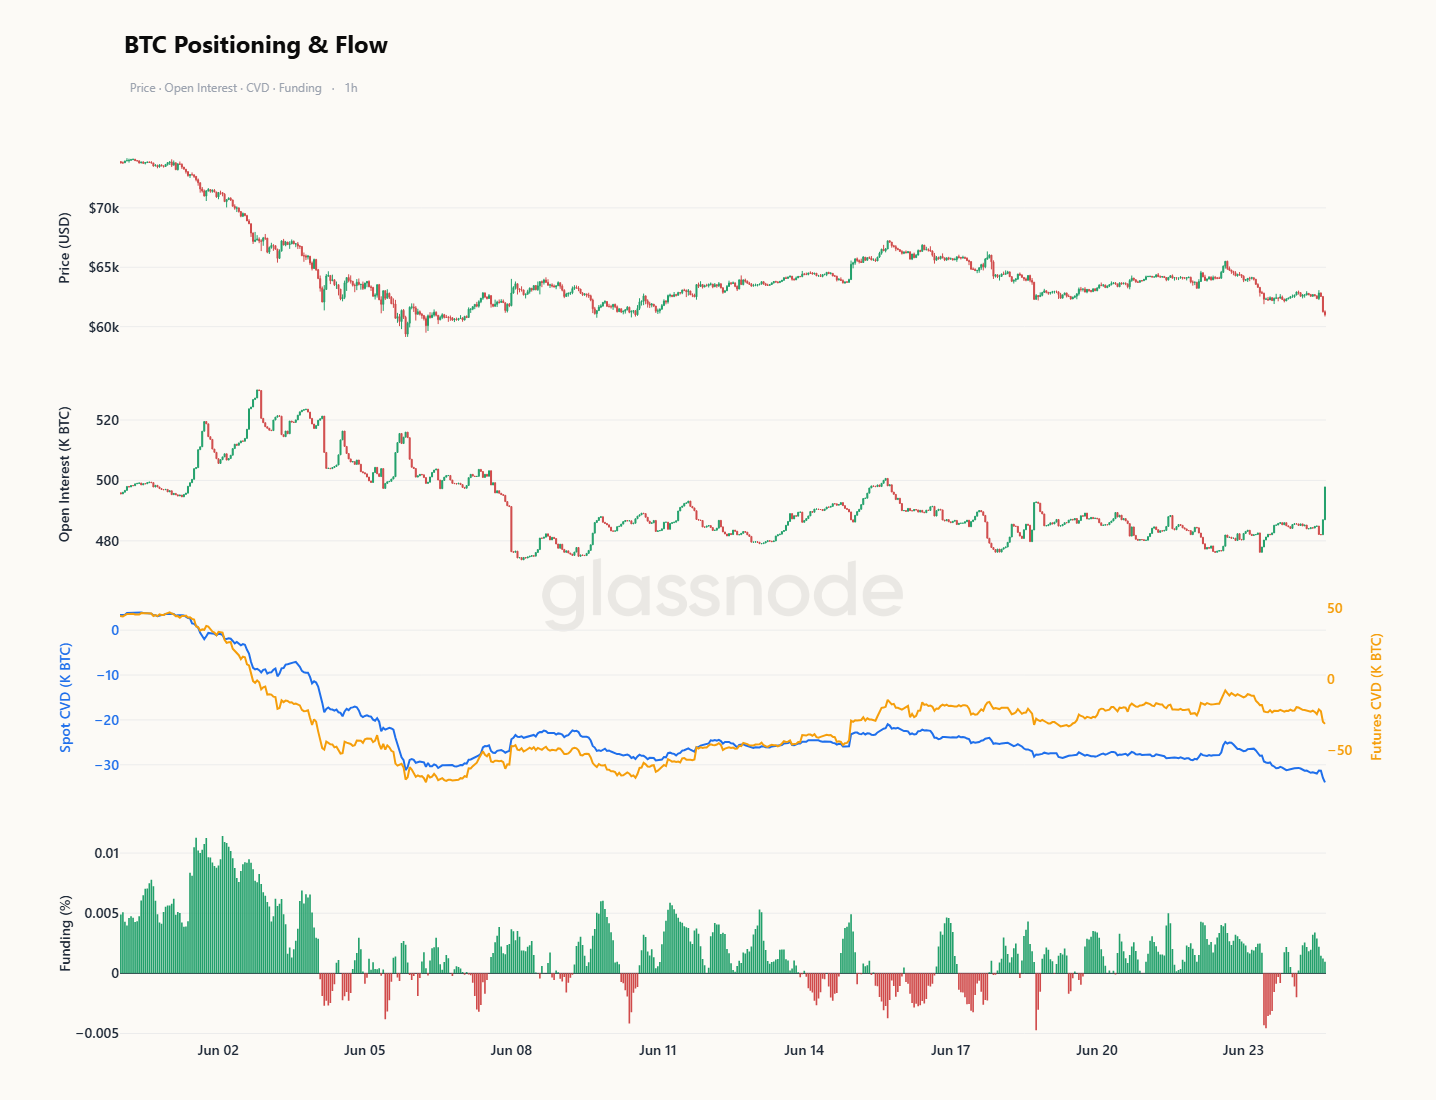
On a shorter time frame, the retest of the low-$60k region has been a spot-led move. Over the past ten days Spot CVD has fallen far faster than Futures CVD, a divergence that points to aggressive sell-side flow on spot venues as the primary driver of the decline rather than a leverage-driven unwind. Open Interest stayed subdued through most of that leg, and funding held stubbornly positive even as price fell, a sign that perpetual longs were slow to capitulate and that the pressure was not originating in the derivatives book.
That has begun to change. Open Interest has spiked sharply as Bitcoin retests its lows, and Futures CVD has now turned down in step with spot, indicating that leveraged participants are finally joining the move rather than fading it. Funding has eased off its elevated levels at the same time, relieving a long bias that had looked increasingly out of place against the price action.
Spot did the heavy lifting on the way down, and derivatives are now catching up rather than leading. A continued build in Open Interest alongside falling Futures CVD and softer funding would confirm leverage is capitulating into lows spot has already sold, the kind of broad participation that tends to mark the more violent, and often more exhaustive, phase of a flush.

Implied Volatility Stabilizes After Recent Repricing
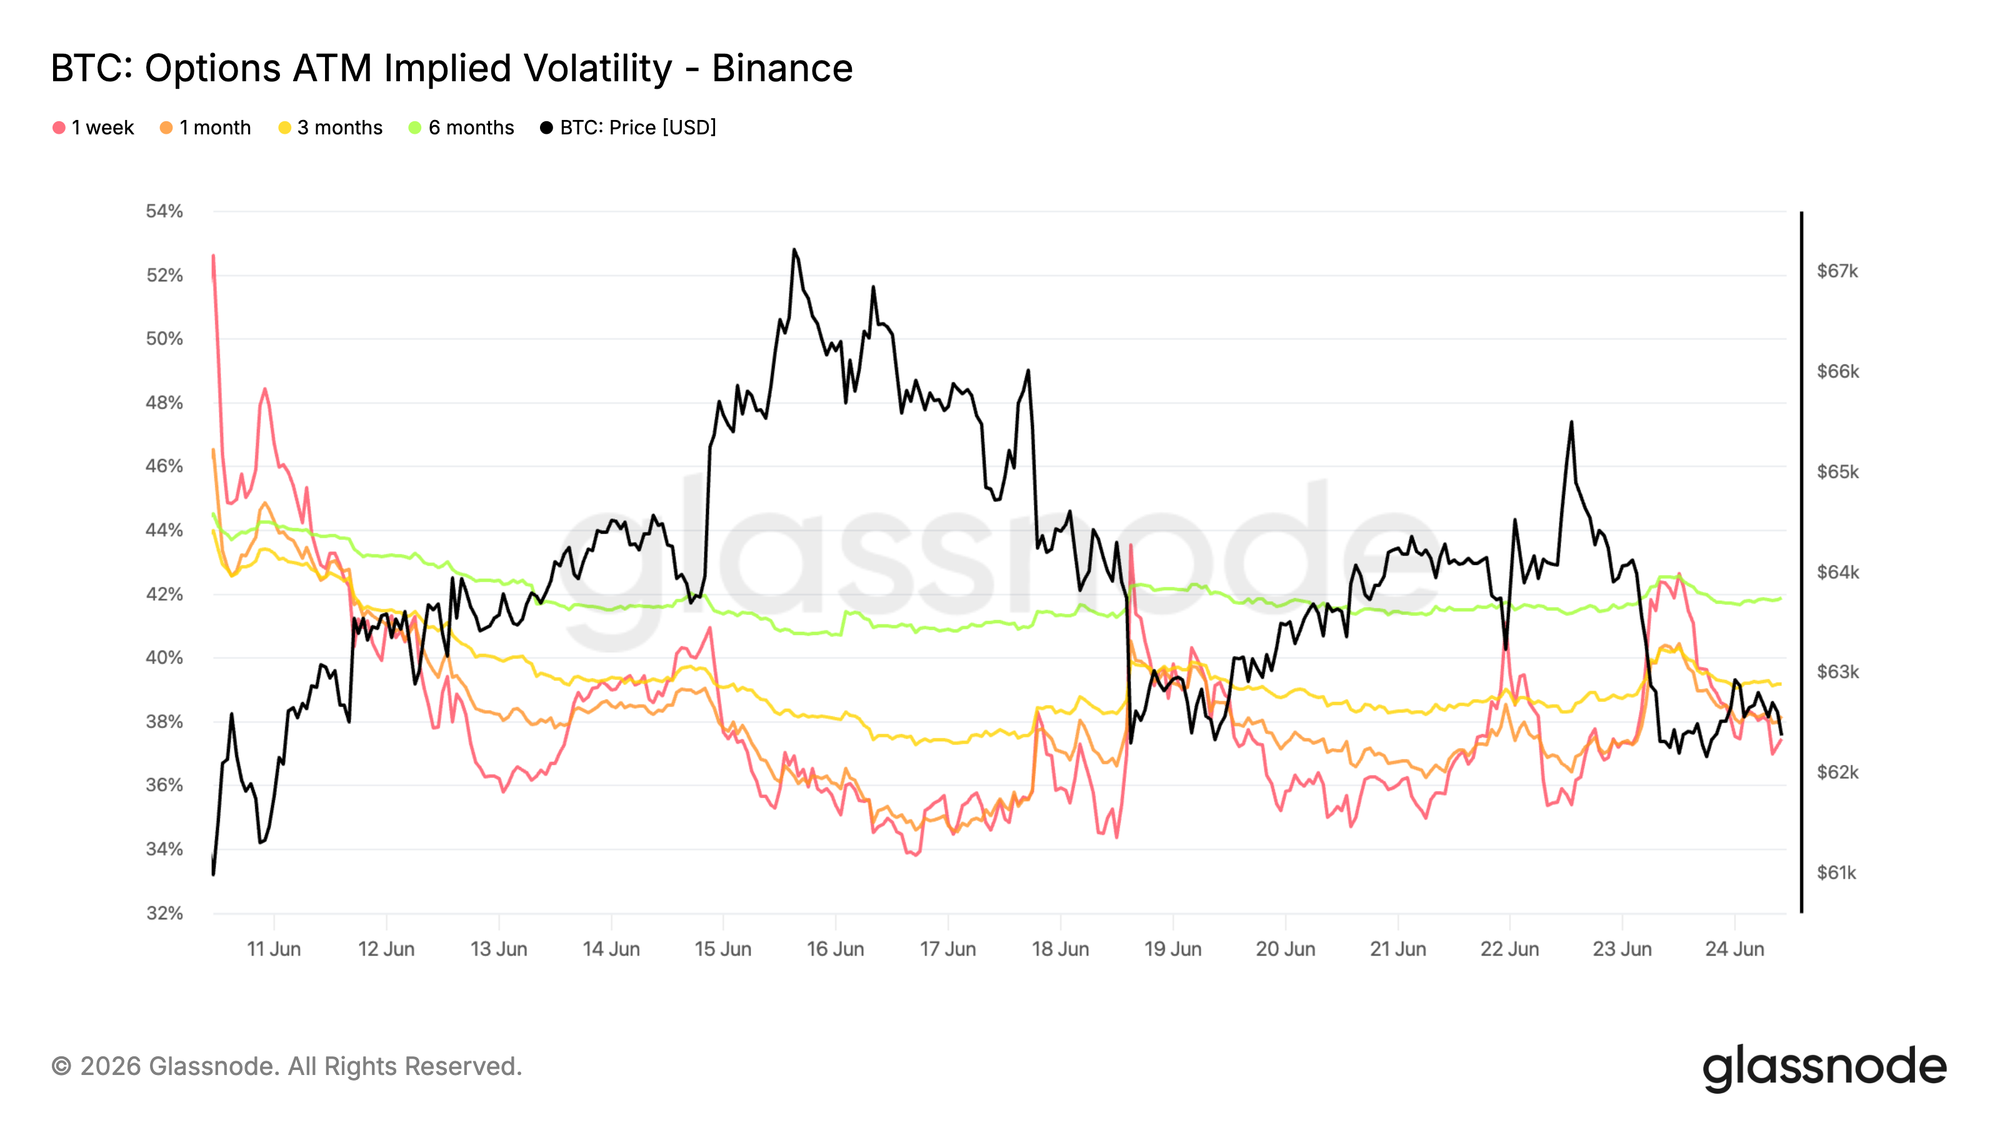
Starting with implied volatility, the options market has settled into a calmer regime following the sharp repricing triggered by Bitcoin’s breakdown toward the June lows.
The front end remains the most reactive part of the curve. One week at the money implied volatility briefly moved above 42% during the latest selloff but has since retreated toward 37%. The 1 month tenor eased from around 40% to 38%, while longer dated maturities remained broadly stable, with 3 month and 6 month implied volatility near 39% and 42%.
This stabilization comes despite Bitcoin continuing to trade near major support around 60K to 63K. The lack of a sustained volatility bid suggests traders are no longer aggressively repricing risk, with much of the protection premium from the recent stress period now removed.
Implied volatility has returned to a stable range, with options markets showing little urgency to price additional short term uncertainty.
Volatility Risk Premium Remains Negative
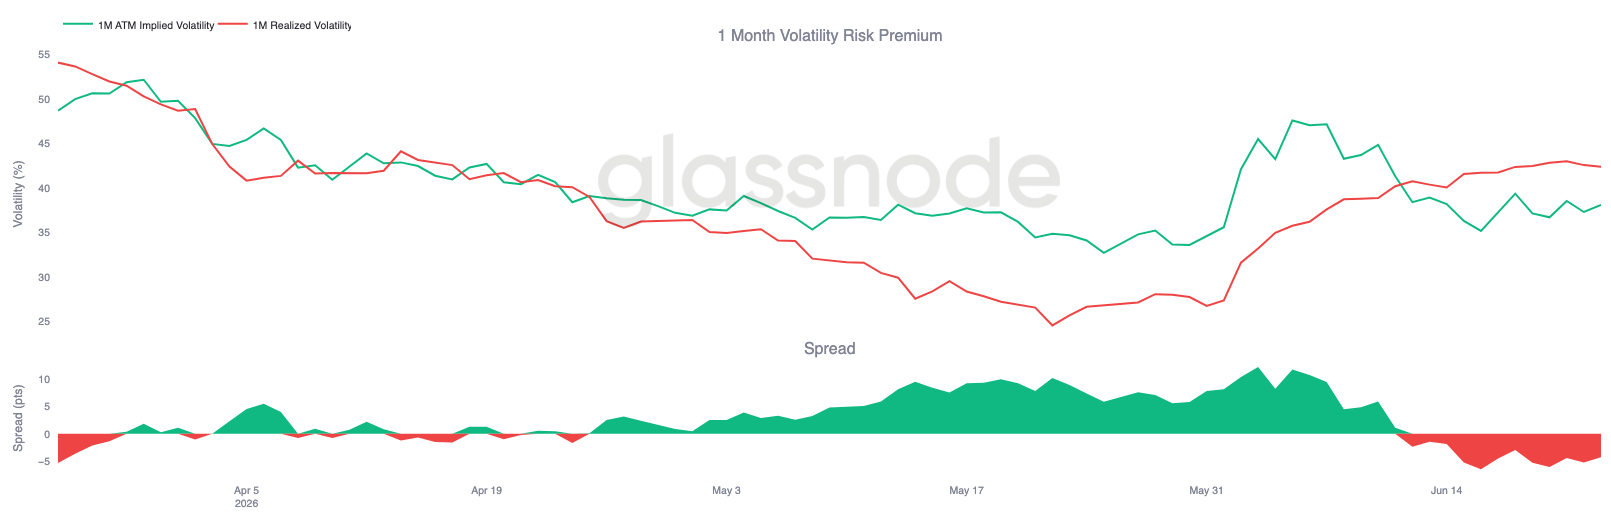
Following the stabilization in implied volatility, the relationship between implied and realized volatility remains inverted, keeping the volatility risk premium in negative territory.
One month implied volatility currently sits around 38%, while realized volatility has continued to climb toward 42%. As a result, the volatility risk premium remains negative by roughly 4 volatility points, extending the reversal that began during the recent market selloff.
The chart shows that realized volatility has remained elevated even as implied volatility has normalized from its early June spike. In other words, the market has continued to deliver larger moves than options are currently pricing. While the gap has narrowed slightly from recent extremes, implied volatility has yet to rebuild enough to move the spread back into positive territory.
With realized volatility still above implied volatility, options markets continue to price a calmer environment than recent price action has delivered.
25 Delta Skew Rebuilds Across Maturities
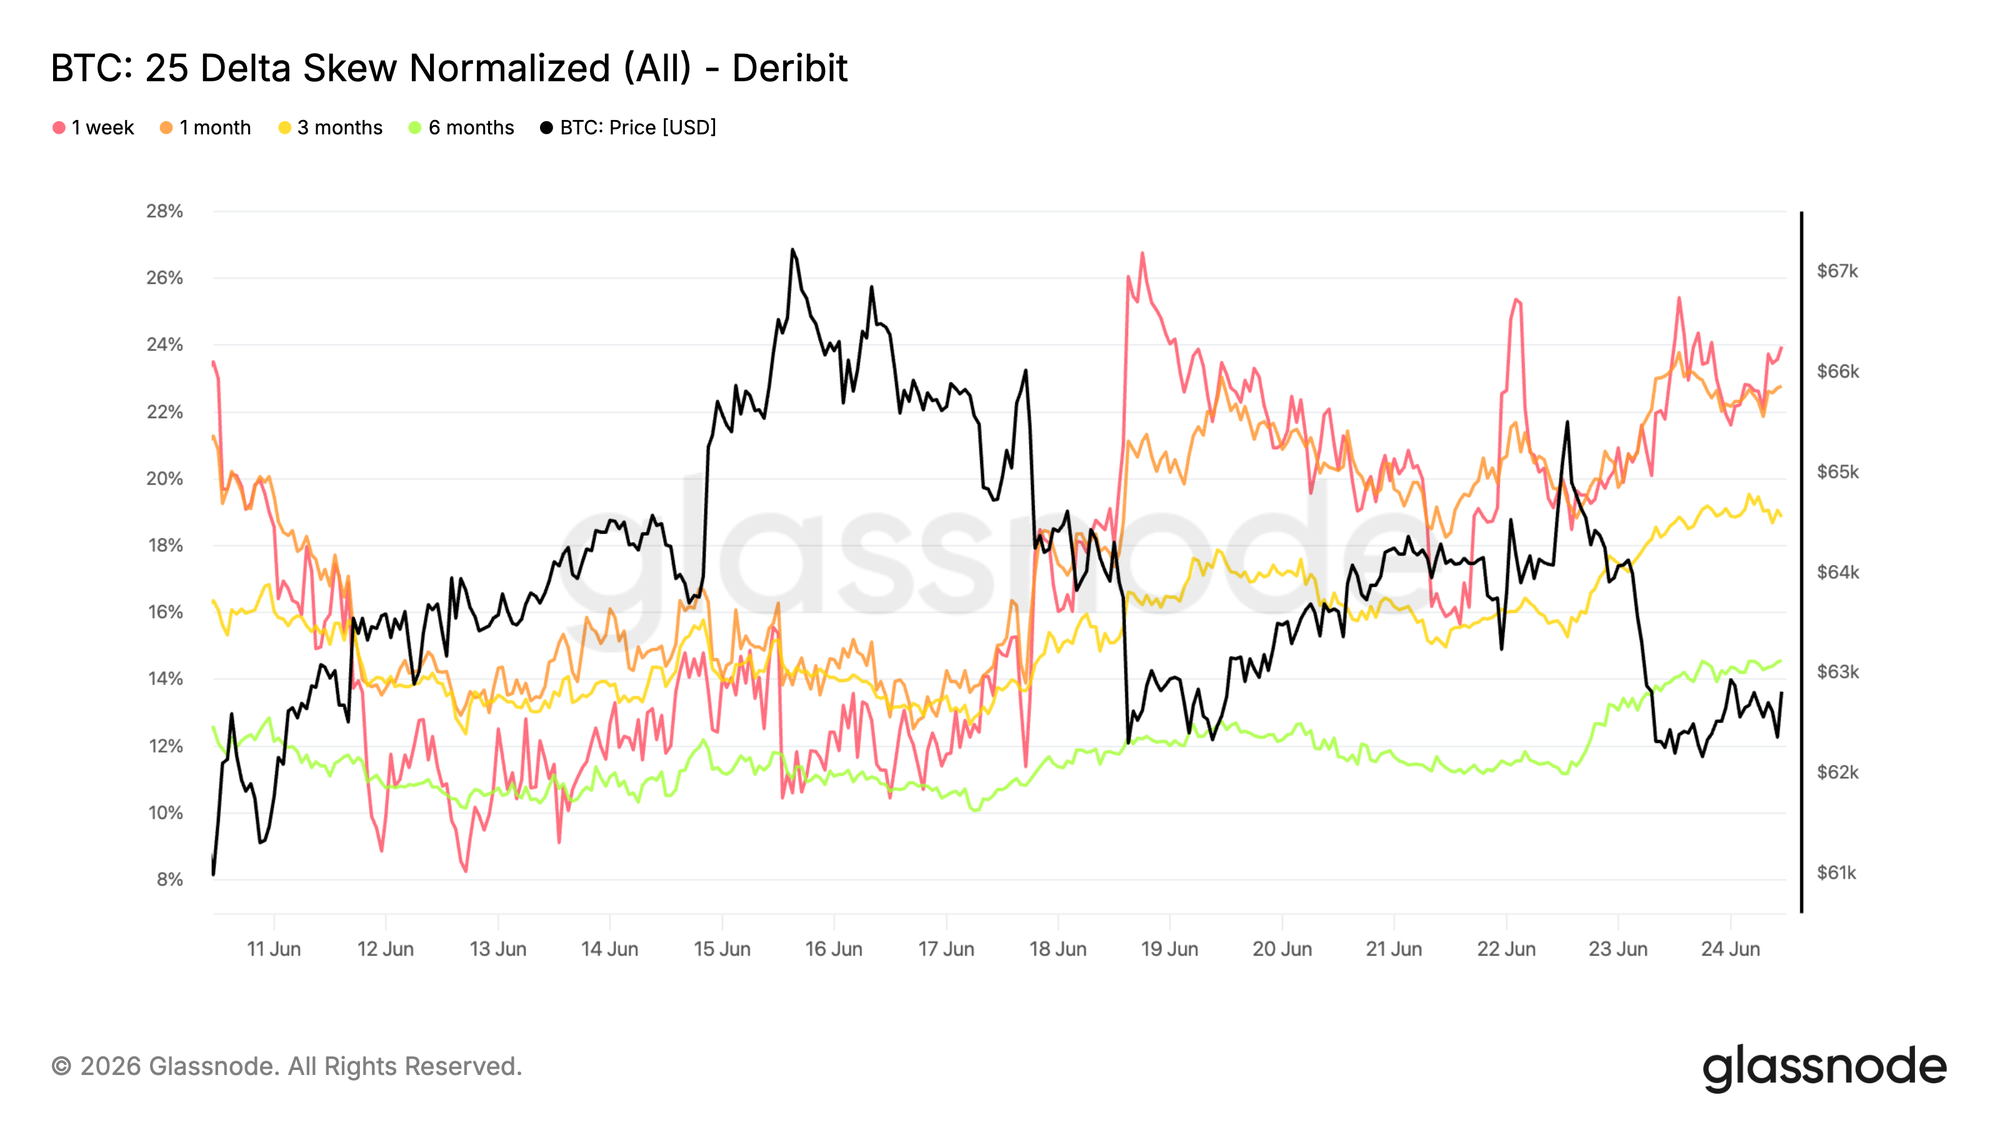
Following the negative volatility risk premium, skew provides insight into how demand for downside protection is evolving as Bitcoin trades near major support.
Since skew is calculated as put volatility minus call volatility, positive readings indicate that puts trade at a premium to equivalent calls. Over the past week, that premium has increased across the curve. The 1 week skew climbed from around 12% to 24%, while the 1 month tenor rose from roughly 14% to 23%. The 3 month and 6 month tenors also moved higher, reaching around 19% and 14%, respectively.
The chart shows a broad repricing of downside protection despite implied volatility remaining relatively stable. Rather than paying more for volatility overall, traders appear increasingly willing to pay for downside hedges.
Protection demand has rebuilt across maturities, signaling a renewed preference for downside hedging despite stable volatility levels.
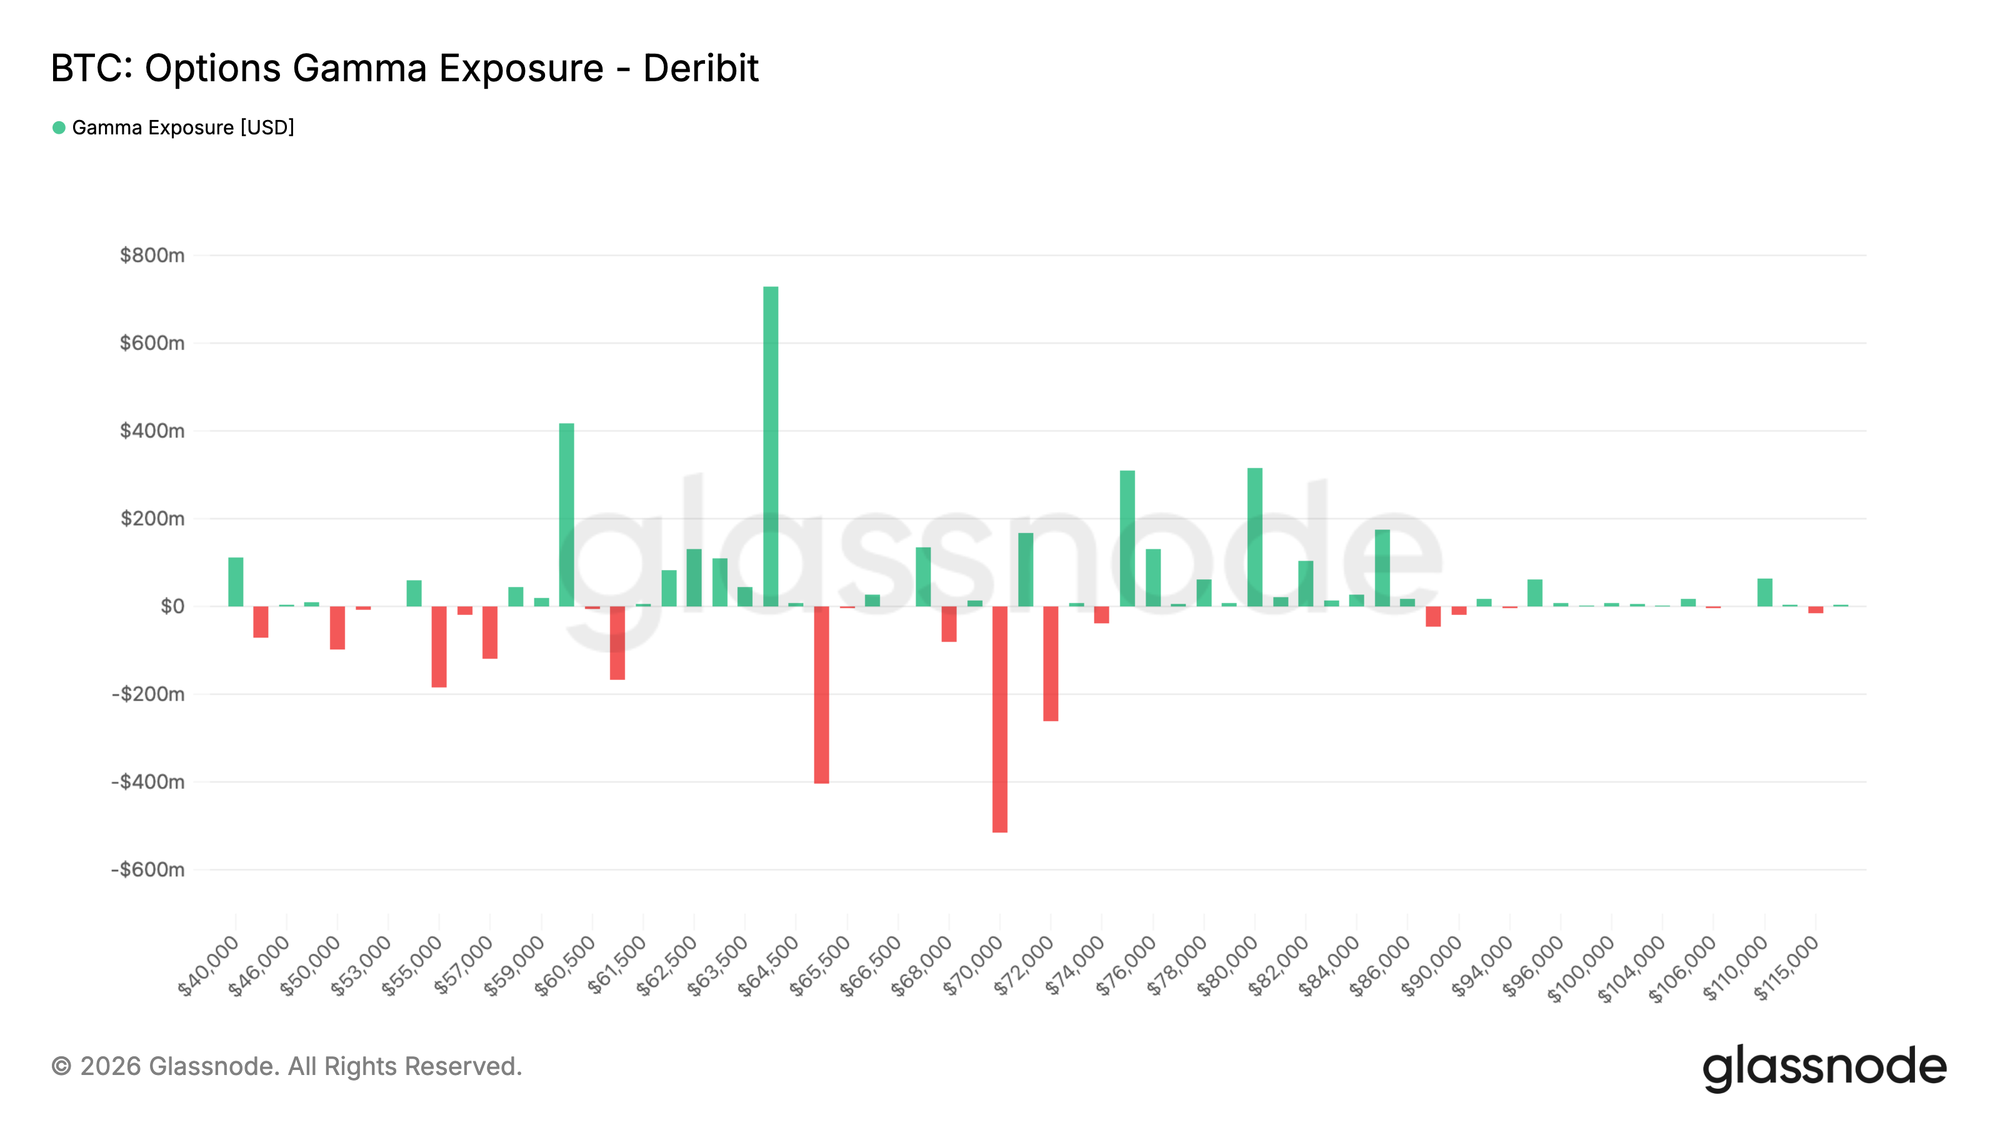
Gamma Exposure Concentrates Around Current Spot
Beyond pricing and sentiment, gamma exposure helps identify the strike levels where dealer hedging may have the greatest impact on market dynamics.
Recent flow suggests traders have become more comfortable selling premium. Over the past seven days, puts sold represented the largest share of premium traded at 31.2%. The trend intensified over the last 24 hours, with put selling accounting for 47.2% of premium traded.
This shift is reflected in the gamma profile. The two largest positive gamma clusters sit at 60K and 64K, with Bitcoin currently trading between them near 62.8K. In positive gamma zones, dealer hedging tends to dampen volatility, helping contain spot within the range. By contrast, the nearest negative gamma exposure sits at 65K and is significantly smaller than the positive gamma cluster at 64K.
Dealer positioning remains dominated by long gamma around current levels, creating conditions that may help contain volatility between 60K and 64K.
Conclusion
Bitcoin continues to trade in a market defined by caution rather than conviction. On-chain metrics suggest the asset is deeply discounted relative to the average investor cost basis, while persistent loss realization indicates that the bear market remains firmly entrenched. At the same time, ETF outflows and defensive positioning in options markets highlight a lack of broad risk appetite across institutional and derivatives participants.
Yet beneath the surface, there are early signs that conditions are beginning to stabilize. Coinbase spot flows have turned constructive, short-term holder cost bases are adjusting lower, and much of the recent weakness has been driven by spot sellers rather than excessive leverage. While these developments do not signal an imminent reversal, they are consistent with the early stages of a bottoming process.
For now, the market remains caught between ongoing distribution and emerging value-driven demand, with the battle between the two likely to define Bitcoin's next major move.