A Market in Repair
Bitcoin fell to nearly $60K as losses mounted and recent buyers came under pressure. Yet improving liquidity, stronger passive bids, and patient ETF holders suggest the market may be building a floor.


Executive Summary
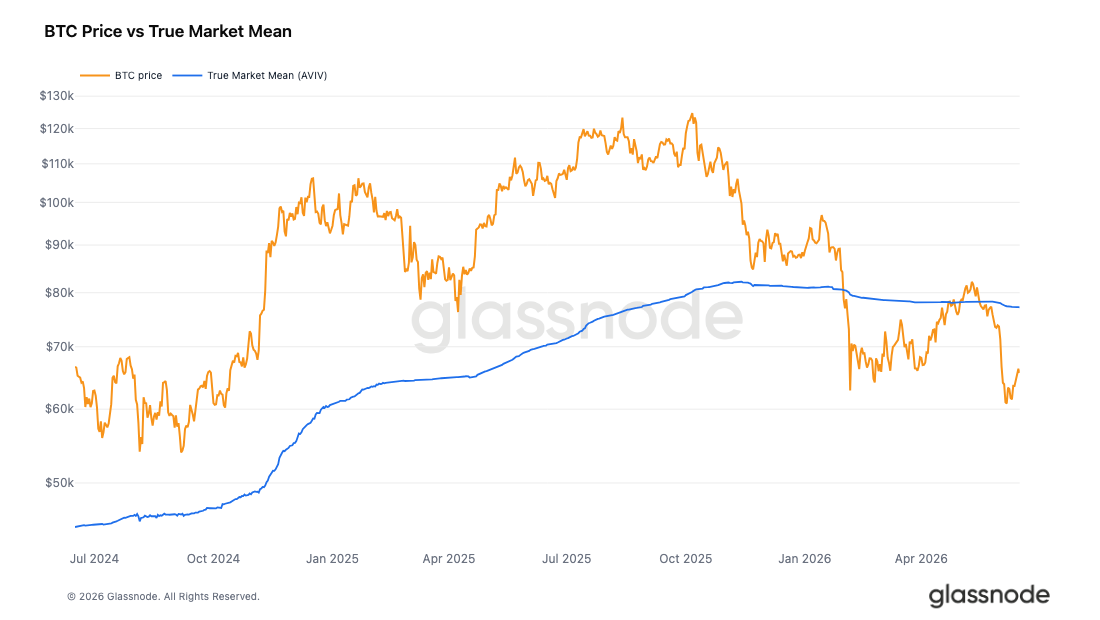
- Bitcoin trades at a 15% discount to the True Market Mean at $77.2k, confirming the on-chain regime remains firmly in bear territory despite the post-ceasefire bounce and unwinding of the geopolitical risk premium.
- Short-Term Holder MVRV has recovered from 0.81 to 0.90 but remains below the 1.0 breakeven threshold, with the 30-day SMA of the Realized Profit/Loss Ratio at 0.53 confirming loss realization continues to dominate capital flow.
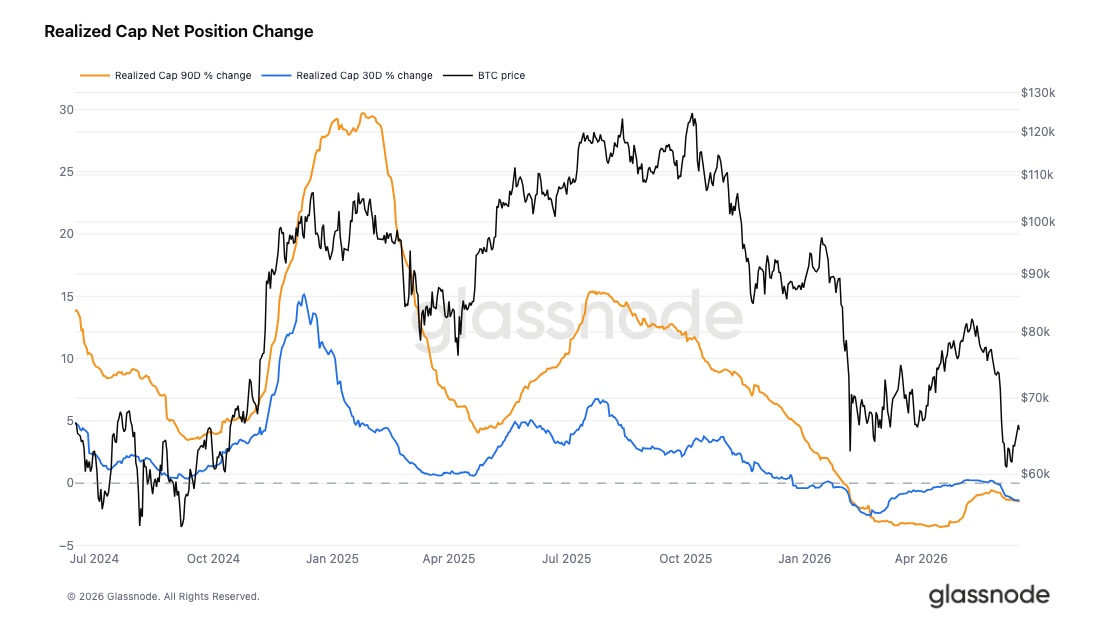
- Realized Cap has contracted 1.45% over 90 days to $1.07T, though the 7-day change has nearly stalled at -0.18%, with a return to positive 90-day growth alongside a reclaim of the True Market Mean as the key conditions for a credible pre-bull transition.
- Spot liquidity conditions improved as passive bid depth returned following Bitcoin's decline toward $60K, reducing reliance on aggressive buyers and suggesting sell-side pressure is being absorbed more efficiently.
- Open interest remains subdued, but large passive bids continue to absorb supply while aggressive selling fades, pointing to a more patient buyer base beginning to support the market near current levels.
- Implied volatility has normalized sharply, while realized volatility continued to rise, pushing the volatility risk premium into negative territory.
- Skew has retraced from its recent extremes, showing that downside protection demand has eased materially.
- Options flow has become more balanced, though dealer positioning remains concentrated around the 68K negative gamma zone.
Macro Insight
Bitcoin's May-June drawdown was a war-premium event. Over the first three weeks BTC fell roughly 22%, from $77,486 to a $60,861 low, while WTI crude held above $90 and gold caught a safe-haven bid. Classic geopolitical-stagflation tape.
The US-Iran peace deal announced June 14 broke the regime in a single 48-hour window. Crude collapsed from $86 to $76. Gold's safe-haven premium drained. BTC consolidated its bounce back into the $65-66k corridor it had lost on the way down.
The crude move dwarfs the others in percentage terms and that is the read. The energy and geopolitics premium that compressed risk assets for three weeks has been removed. Gold is the only one of the three sitting near where it started. BTC and oil both sit at the underside of their pre-shock ranges, but for opposite reasons: oil is repricing a genuine demand outlook, BTC is repricing the absence of a headwind.
With geopolitical risk premium unwinding, the conditions that drove capital toward safe havens and away from risk assets are easing. Historically, that rotation has been supportive for BTC.
On-chain Insight
Below the Market Mean
With geopolitical risk premium now unwinding following the US-Iran peace deal and crude collapsing from $86 to $76, the macro headwinds that compressed risk assets over recent weeks are easing. This backdrop provides an opportunity to revisit where Bitcoin sits within its own cyclical rhythm, assuming the structural pattern of prior cycles remains intact. The cleanest separation of a structural bull from a structural bear is to measure spot against the cost basis of the active investor base. The True Market Mean tracks the average acquisition price of actively transacted coins, and historically serves as the threshold between bear and bull market regimes.
Currently at $77.2k, it sits roughly 15% above spot near $65.6k, placing the market firmly in discount territory. At the mid-May peak, price had briefly approached this level before the subsequent correction widened the gap significantly. Despite the recent bounce, the on-chain regime has remained firmly on the bear side, and any abrupt reclaim of the True Market Mean would be the trigger for revising the broader outlook from bear toward a potential pre-bull transition.
Recent Buyers Still Underwater
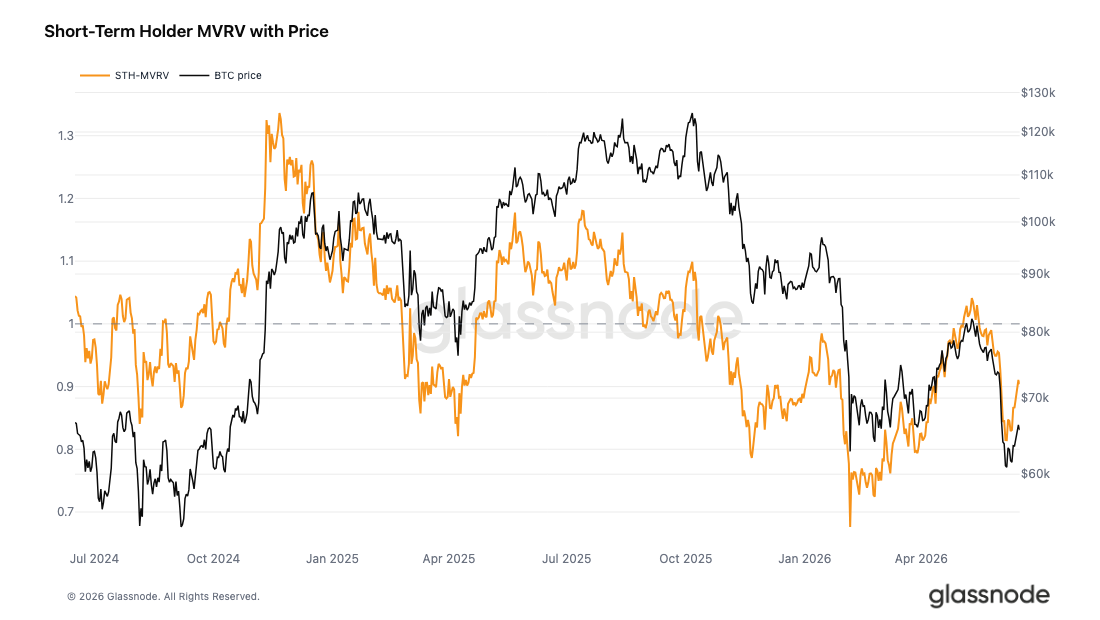
With the broader regime confirmed as bearish by the persistent discount to the True Market Mean, the next question is how the recent bounce off the early June low looks from the perspective of new market participants. The Short-Term Holder MVRV measures the aggregate unrealized profit or loss of coins moved within the last 155 days, with 1.0 marking the cohort's collective breakeven.
Last week’s report flagged the metric at 0.83, with the newest buyers deeply in the red. It has since recovered to 0.90 as price lifted from the low, yet remains below the critical 1.0 threshold. The implied cohort cost basis sits near $72.6k, leaving recent buyers roughly 10% underwater on average.
The recent rally, while offering some relief, has not been sufficient to bring this cohort back into net profit, a precondition for any sustainable move away from bear market conditions. The improvement from 0.81 to 0.90 eases stress among recent buyers without resolving it, and until STH MVRV reclaims 1.0, this cohort remains a standing source of overhead supply on any attempted recovery.
Losses Still Dominate Flow
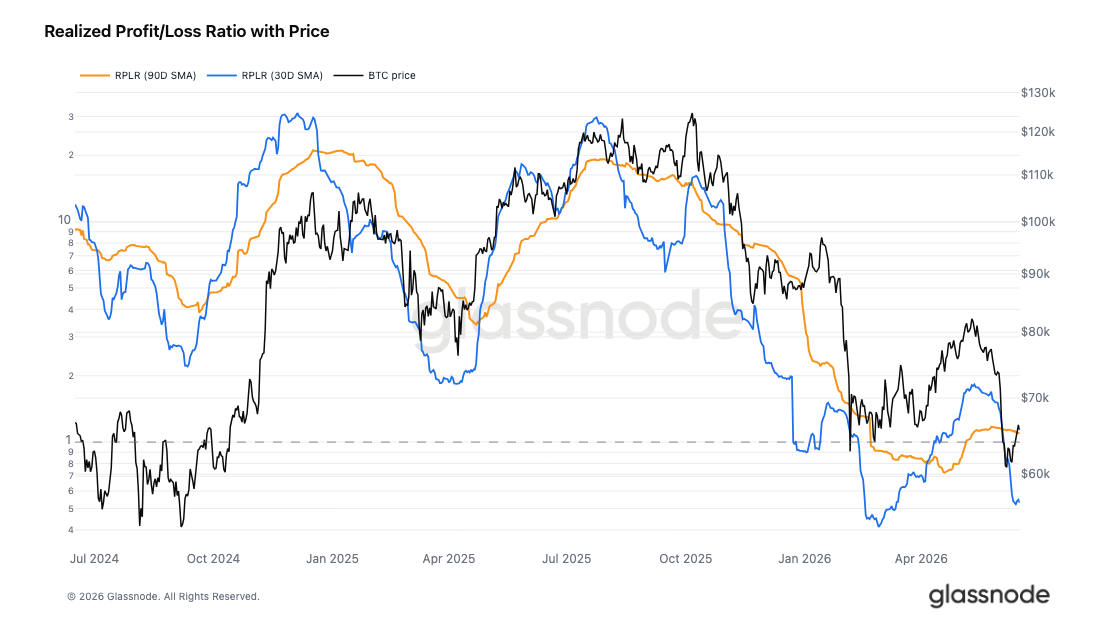
Adding further evidence to the bearish regime framing and the recent rally's failure to push STH MVRV back above breakeven, the overall bias in market profitability reinforces the same conclusion. The Realized Profit/Loss Ratio compares the dollar value of coins moving in profit against those moving at a loss, with readings above 1 indicating profit-taking dominance and below 1 reflecting loss realization as the prevailing force.
The 90-day SMA of this ratio sits at 1.10, far beneath its four-year average and only marginally above the neutral 1.0 line, suggesting the broader market has been hovering near indecisiveness on a quarterly smoothed basis. The 30-day SMA tells a more decisive story at 0.53, confirming that loss realization has firmly outpaced profit-taking across most of the past month.
A 90-day SMA holding near 1.0 while the 30-day SMA prints 0.53 is a capital flow configuration that firmly confirms bear conditions. A sustained recovery of both SMA traces toward the bull market range above 2 would be the first meaningful signal that the underlying bias is turning.
Capital Quietly Leaving
Sizing up the market's profitability bias through the Realized Profit/Loss Ratio is only half the flow picture; magnitude completes it. The Realized Cap measures the aggregate cost basis of all coins in circulation, rising when capital enters the network and falling when it leaves. I Realized Cap now stands at $1.07T and has contracted 1.45% over the past 90 days, with the 30-day change at -1.39%, reflecting a steady drain of capital at the cycle scale rather than a single acute shock. The one tentative positive from the recent rally is the 7-day change at -0.18%, where the outflow has nearly stalled. Realized Cap contracting at the cycle scale confirms the bear read established through the valuation and flow layers above, placing the market in what can be characterized as a deep bear where both valuation discount and capital flow trajectory are in agreement.
The conditions required before a credible transition to a pre-bull phase can be considered are specific and measurable: a reclaim of the True Market Mean near $77.2k, Short-Term Holder MVRV back above 1.0, and Realized Cap turning positive on the 90-day horizon.
Off-chain Insight
Spot Liquidity Turns Supportive
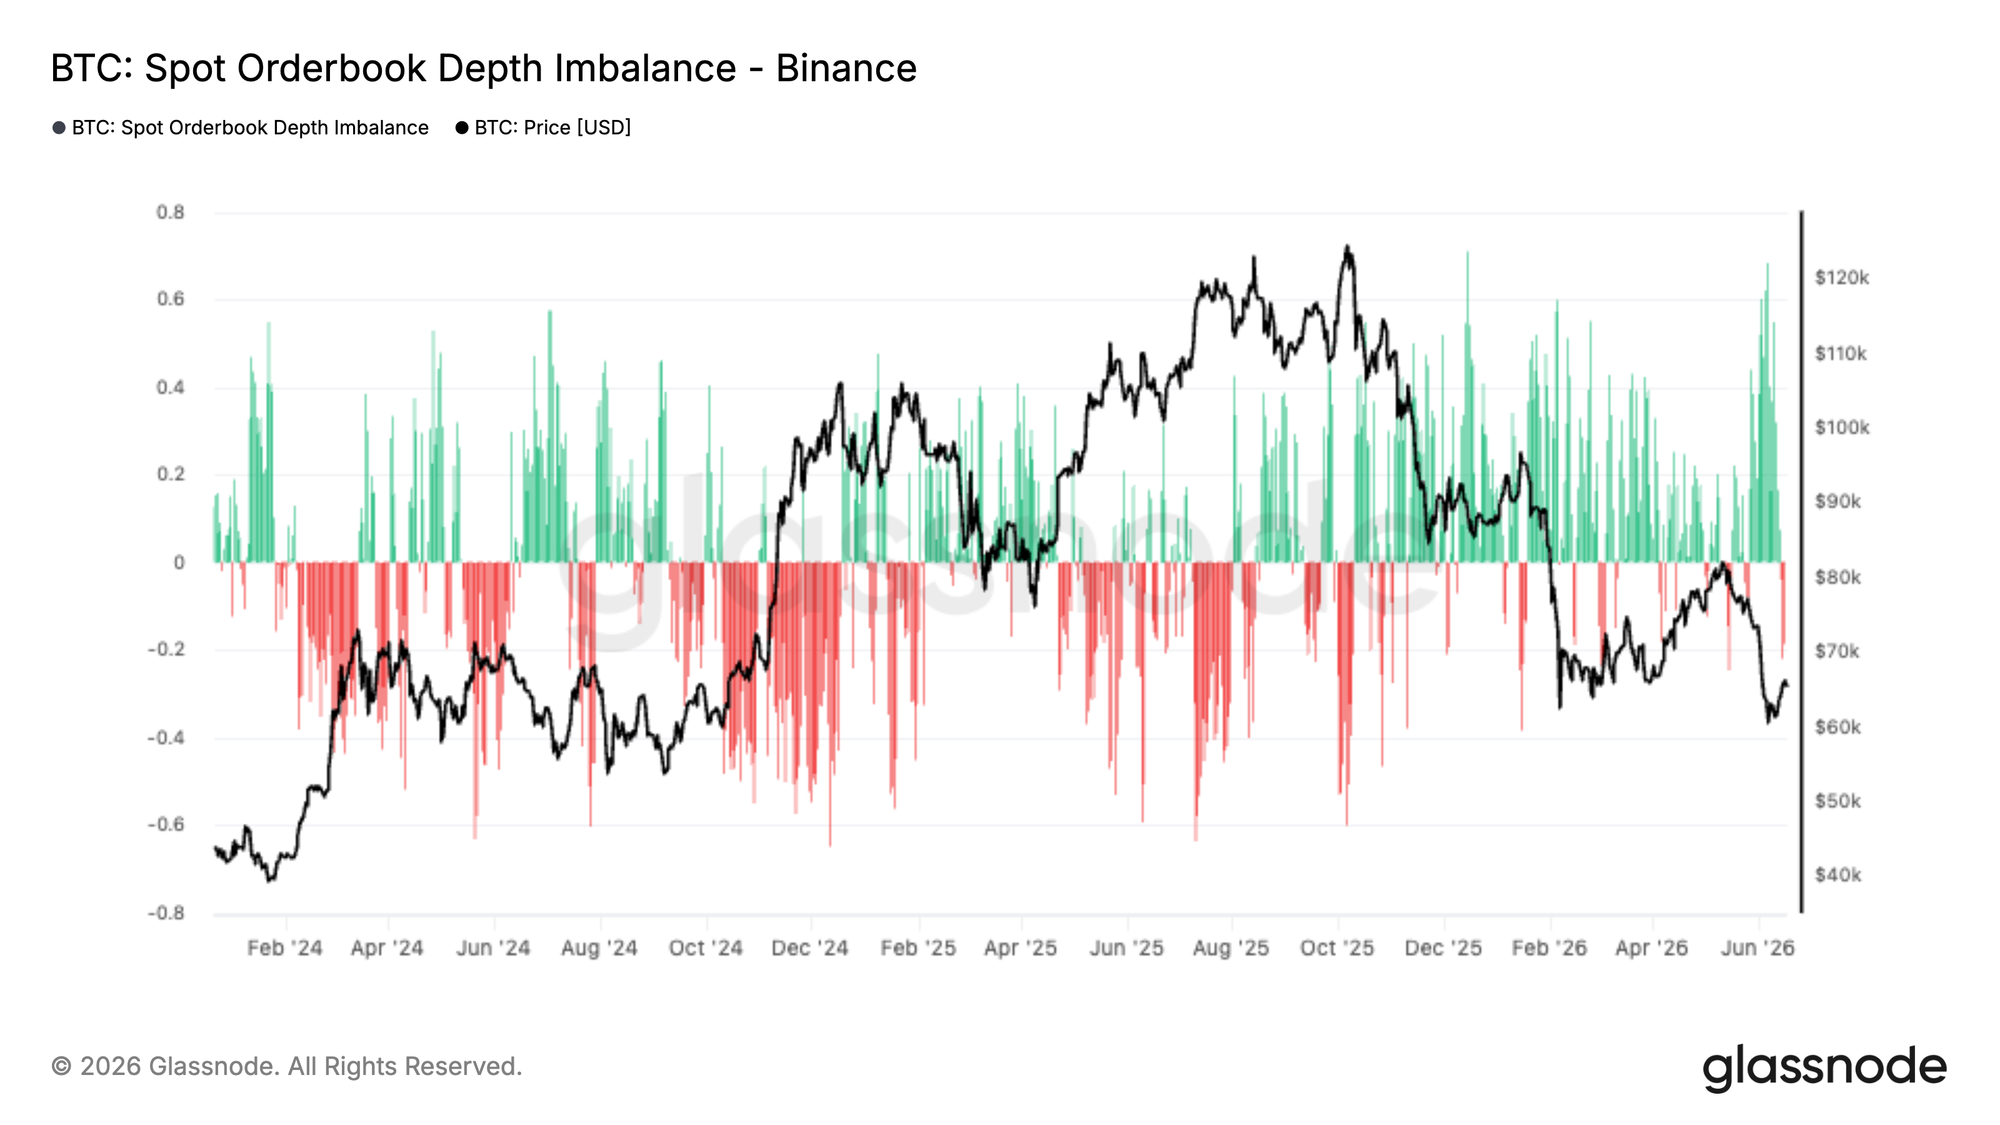
Following Bitcoin's decline toward the $60K region, conditions within spot markets have begun to improve. Binance Spot Orderbook Depth Imbalance has shifted decisively in favour of bids, with buy-side liquidity now outweighing resting sell orders by the widest margin seen in recent months.
This suggests market participants are increasingly positioning to absorb supply at lower price levels rather than offer liquidity into rallies. While orderbook liquidity remains inherently dynamic and can be withdrawn quickly, the recent shift marks a notable change from the sell-side heavy conditions that characterised much of the recent drawdown.
Historically, sustained bid-side dominance has often accompanied periods of market stabilisation, as deeper buy walls provide support beneath price and improve the market's ability to absorb further selling pressure. Although this alone is insufficient to confirm a durable bottom, the emergence of strong buy-side depth suggests spot market participants are becoming more willing to defend current price levels.
Patient Bid, No Aggression
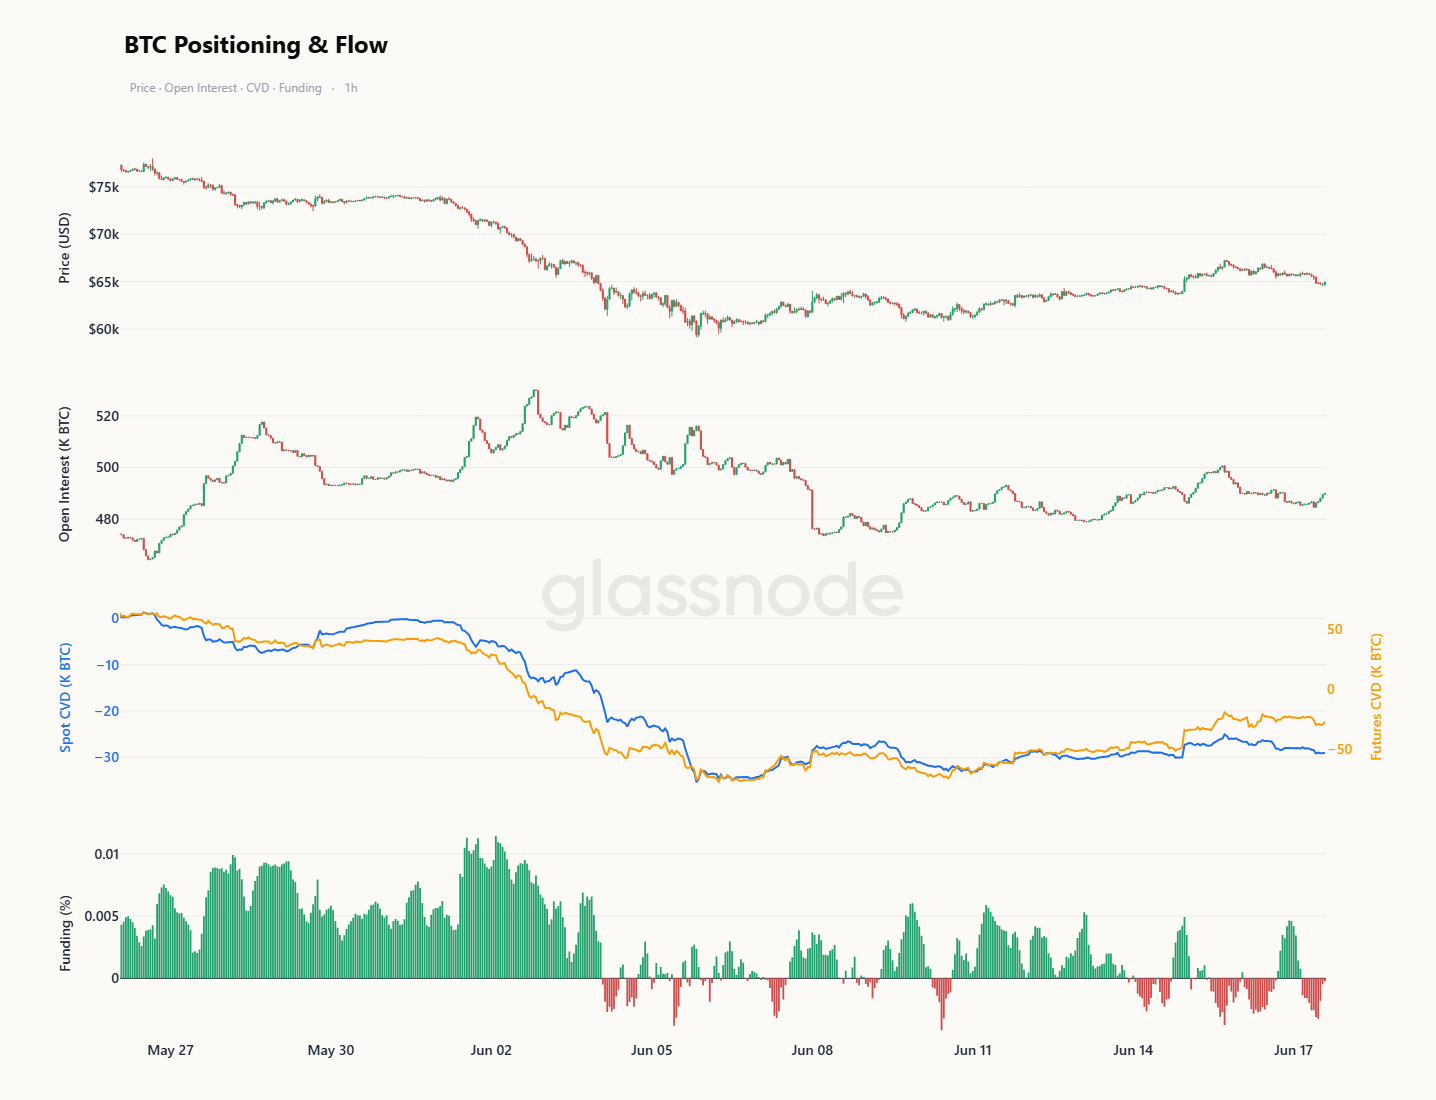
Open Interest sat near the upper end of its recent range through late May, financing the push into the local highs. When price broke lower in early June, Spot CVD and Futures CVD turned down together, marking a move sold by real-money and leveraged participants alike rather than a one-sided long liquidation. Open Interest then compressed sharply off its peak, confirming a genuine deleveraging. Funding fell from firmly positive into a band oscillating either side of zero, neither a crowded long premium nor an aggressive short bias.
Since the flush, Open Interest has barely risen, so the modest uptick in Futures CVD reflects only faint leveraged demand. Spot CVD has not followed either, drifting flat to lower. However, this looks like the signature of the resting limit bid discussed above. Passive orders absorbing supply below the spread leave Spot CVD trending down even as coins come off the market, and a constantly replenishing bid can sustain that signature. This accumulation is quiet and lacking aggression. A sustained turn higher in Spot CVD would signal that real buyers are becoming eager to enter quickly rather than being patient at the bid. Were that to coincide with the currently muted futures signatures turning up, it would mark a constructive setup with both flow regimes aligned to the upside.
Implied Volatility Continues to Normalize
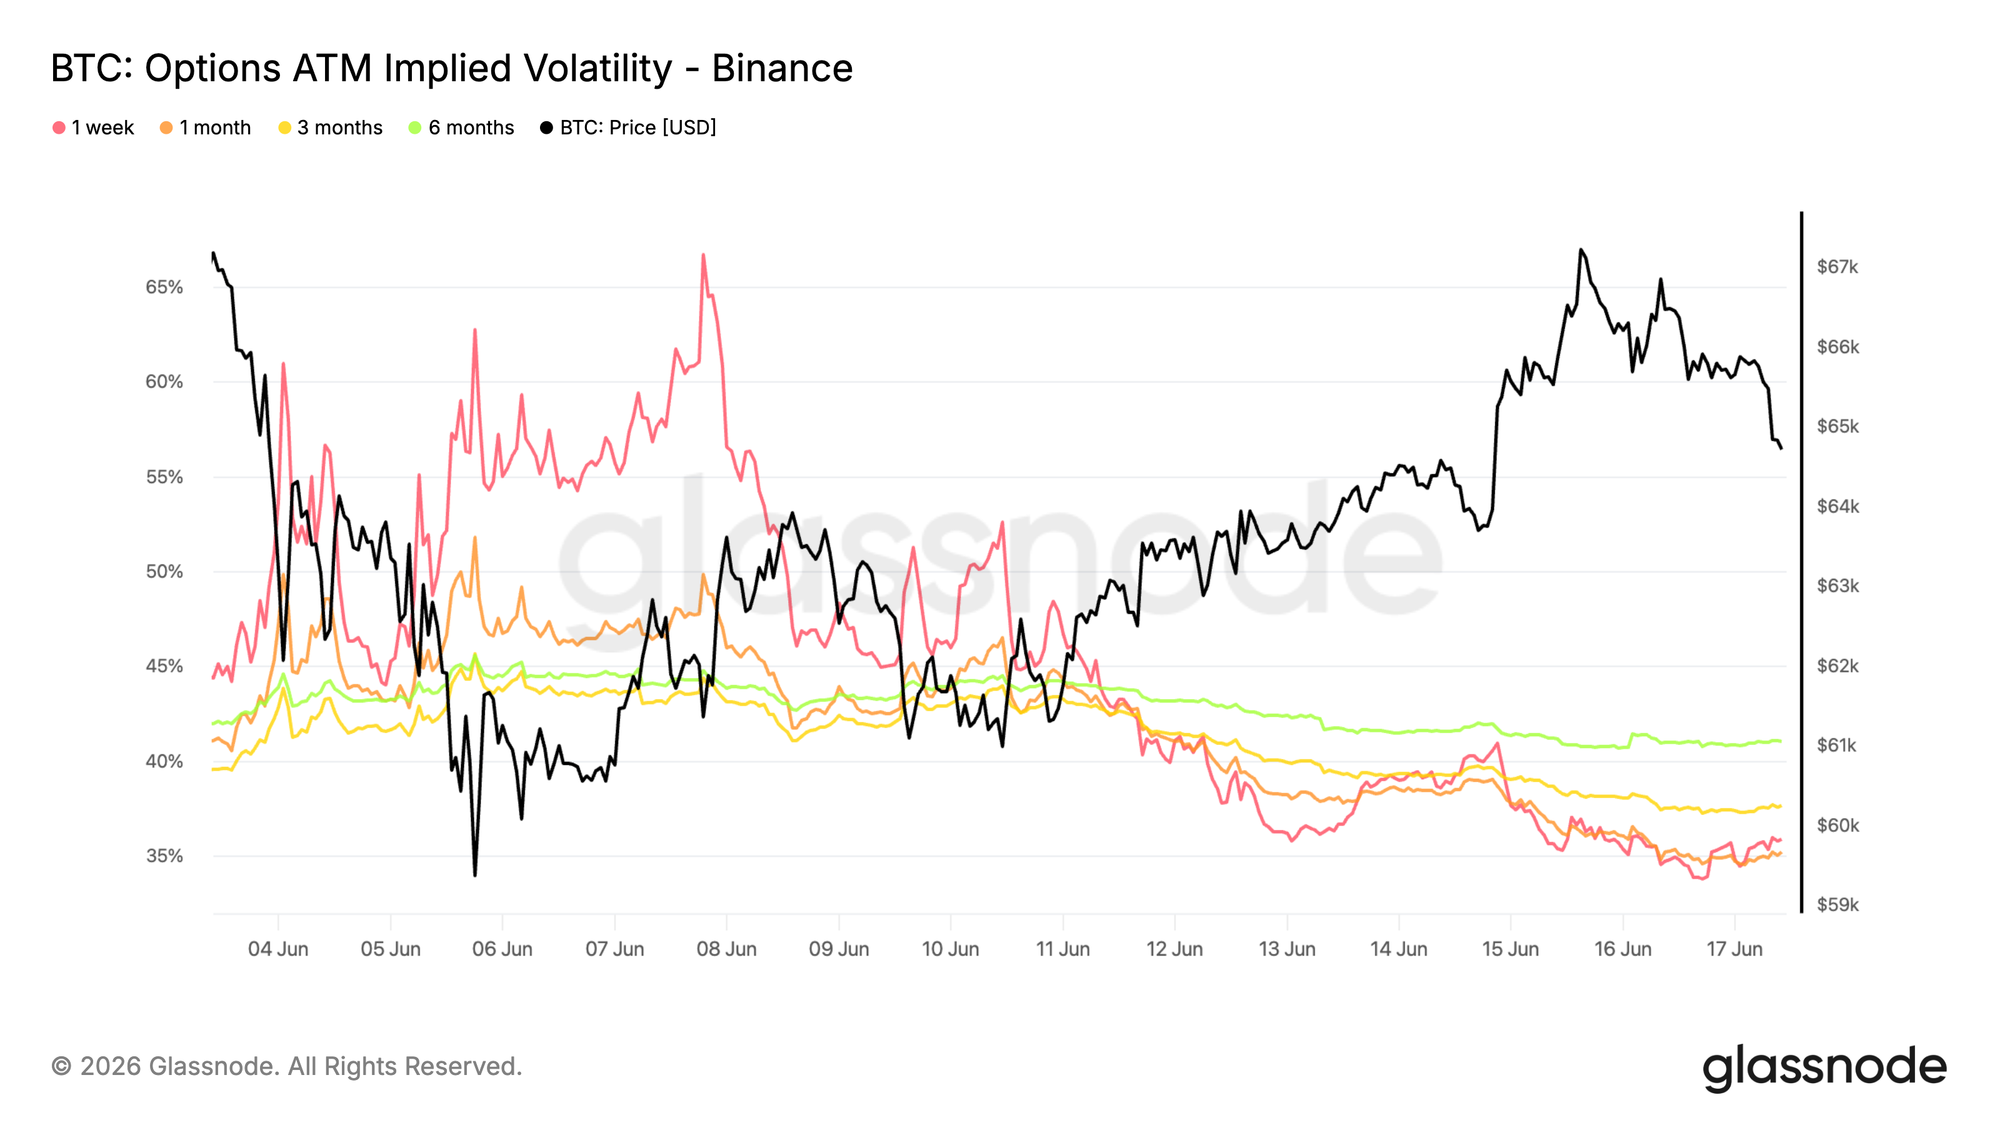
Starting with implied volatility, the sharp repricing triggered by Bitcoin’s breakdown below its multi month range continues to unwind as spot stabilizes around 65K and recovers from the June lows.
The front end saw the strongest adjustment. One week at the money implied volatility fell from peaks above 65% to around 35%, while the 1 month tenor dropped from roughly 50% to 35%. Longer dated maturities eased more modestly, with the 6 month tenor declining from around 44% to 41%.
The decline reflects a market that has become increasingly comfortable with current price conditions. Despite Bitcoin rebounding from the June low near 59K to almost 67K, demand for optionality has continued to fall across maturities as traders unwind the protection premium built during the selloff.
The volatility shock has been largely absorbed, with options markets steadily removing the premium that was priced in during the recent period of stress.
Volatility Risk Premium Turns Negative
Following the normalization in implied volatility, the relationship between implied and realized volatility has shifted materially over the past week.
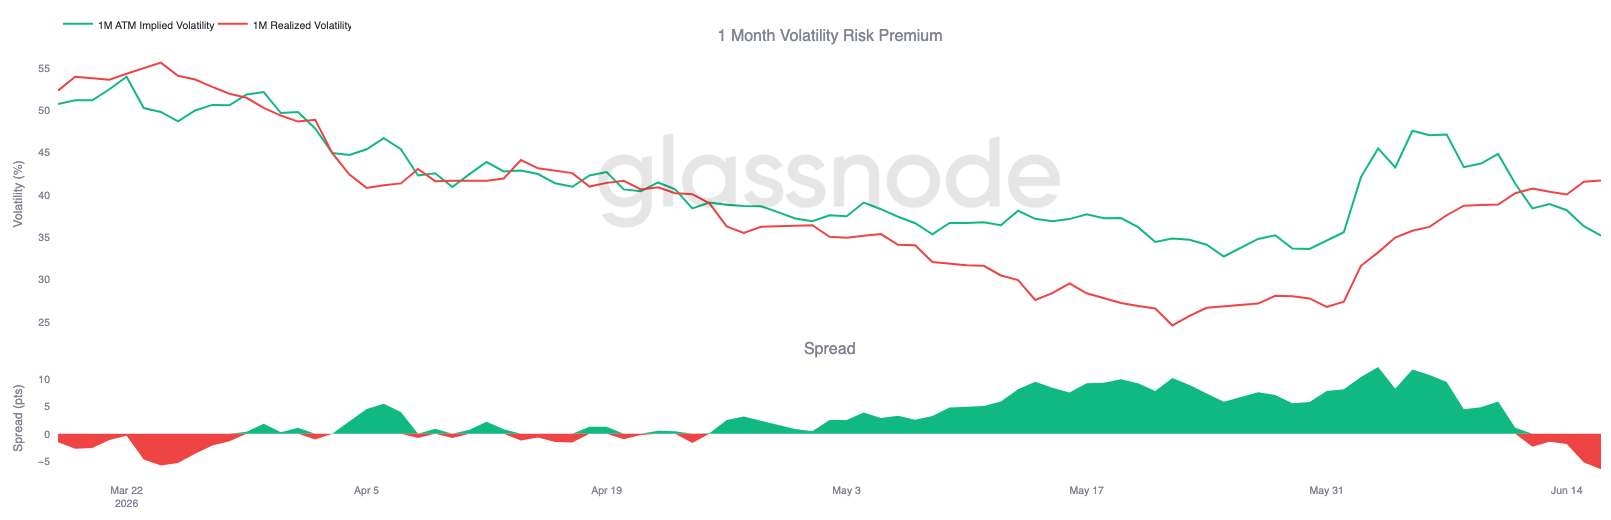
One month implied volatility has fallen from around 47% to 35%, while realized volatility continued to climb, rising from roughly 27% to 42%. As a result, the volatility risk premium has compressed sharply, moving from a double digit premium in early June to negative territory.
The chart shows that the volatility premium built during the selloff has steadily unwound. As implied volatility normalized and the recent market turbulence fed into realized volatility, the spread compressed and eventually turned negative.
With realized volatility now above implied volatility, the relationship between the two measures has fully reversed from the conditions seen earlier this month.
The volatility risk premium has turned negative, suggesting options markets now expect a calmer environment than recent price action would imply.
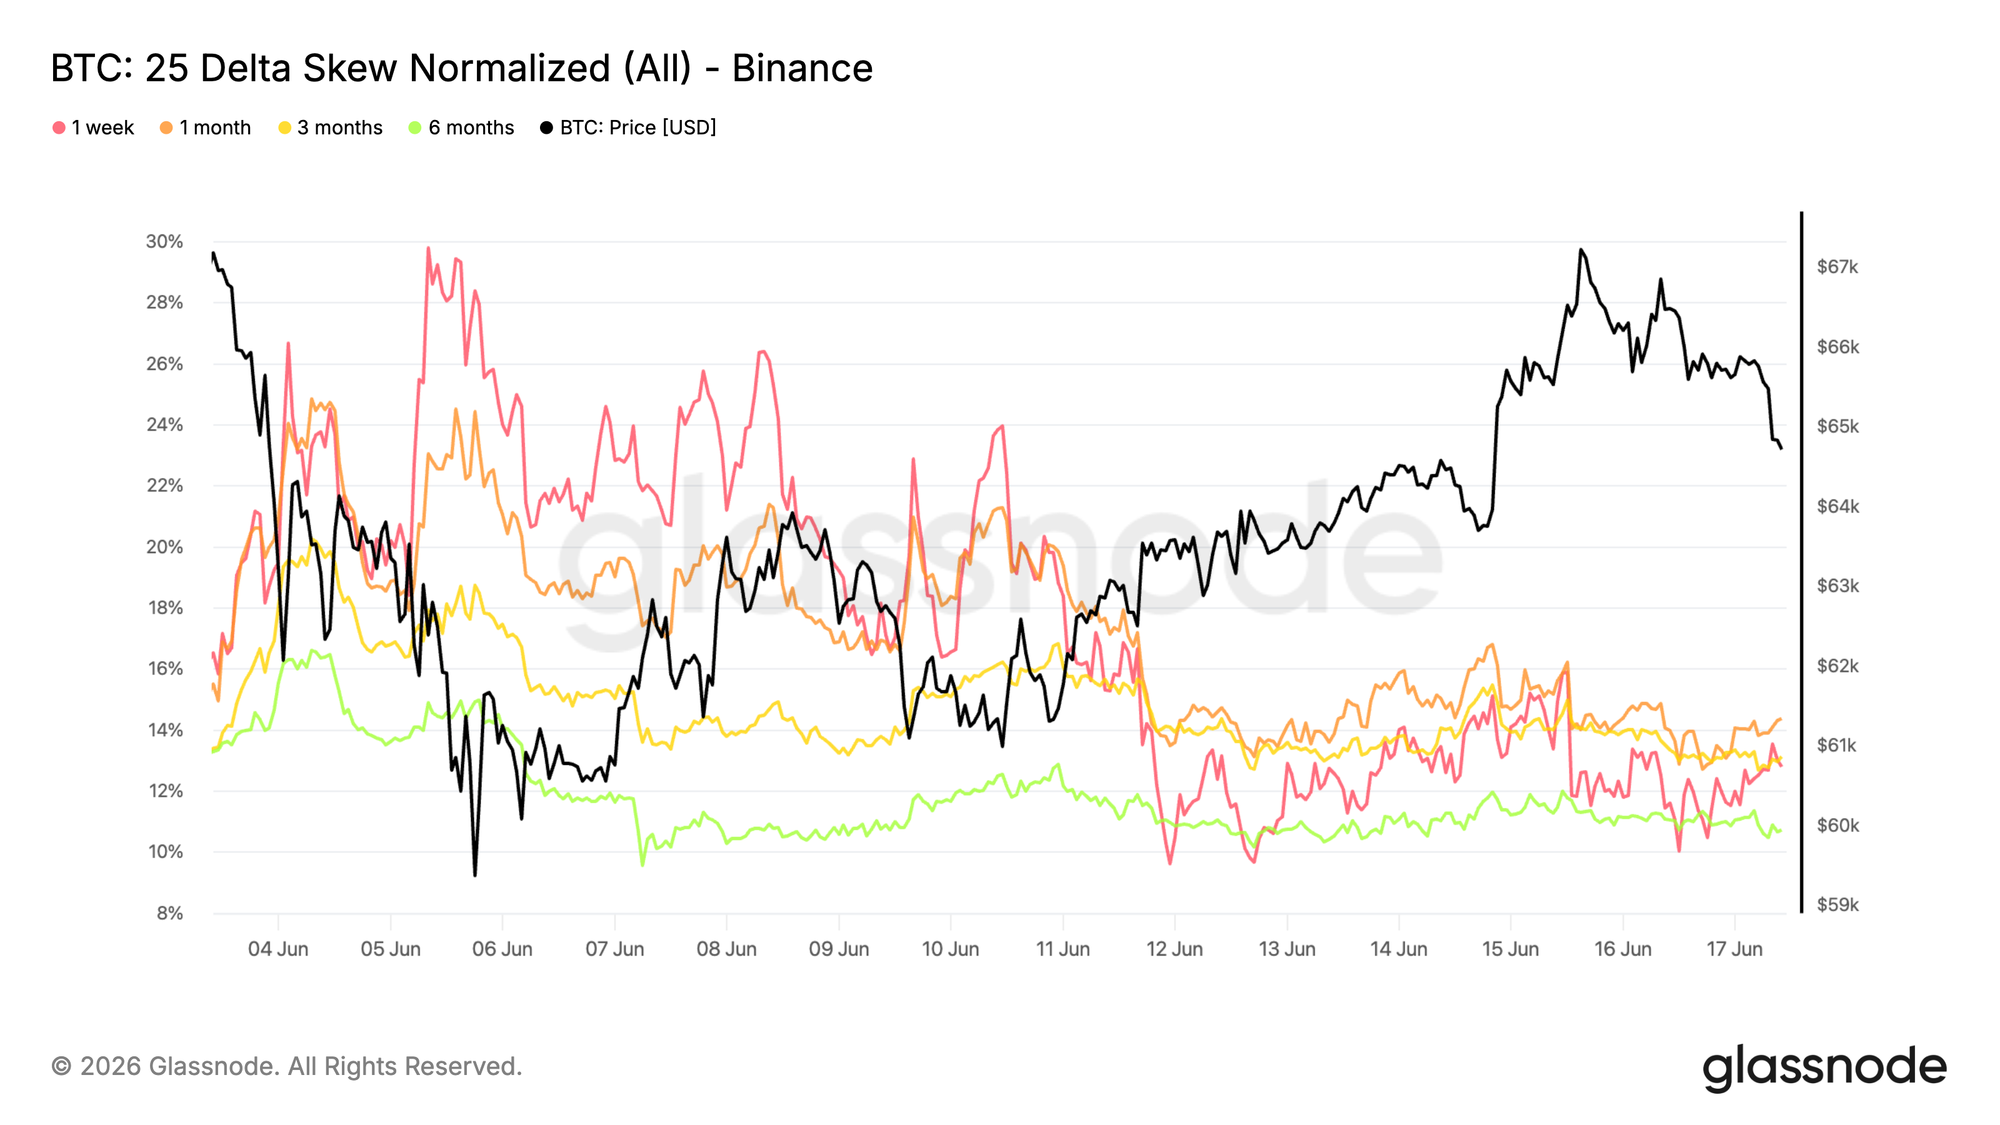
25 Delta Skew Normalizes After Protection Rush
Following the reversal in the volatility risk premium, skew provides insight into how demand for directional protection has evolved since the selloff.
Since skew is calculated as put volatility minus call volatility, positive readings indicate that puts trade at a premium to equivalent calls. Earlier this month, downside protection became significantly more expensive, with the 1 week skew briefly approaching 30% and the 1 month tenor rising above 24% as traders rushed to hedge the breakdown toward the June lows.
That demand has since eased. The 1 week skew has fallen back toward 13%, while the 1 month tenor has declined to around 14%. Longer dated maturities have also normalized, with the 3 month and 6 month tenors now trading near 13% and 11%, respectively.
Protection demand remains elevated relative to pre selloff levels, but the sharp rush for downside hedging has largely subsided as market conditions stabilize.
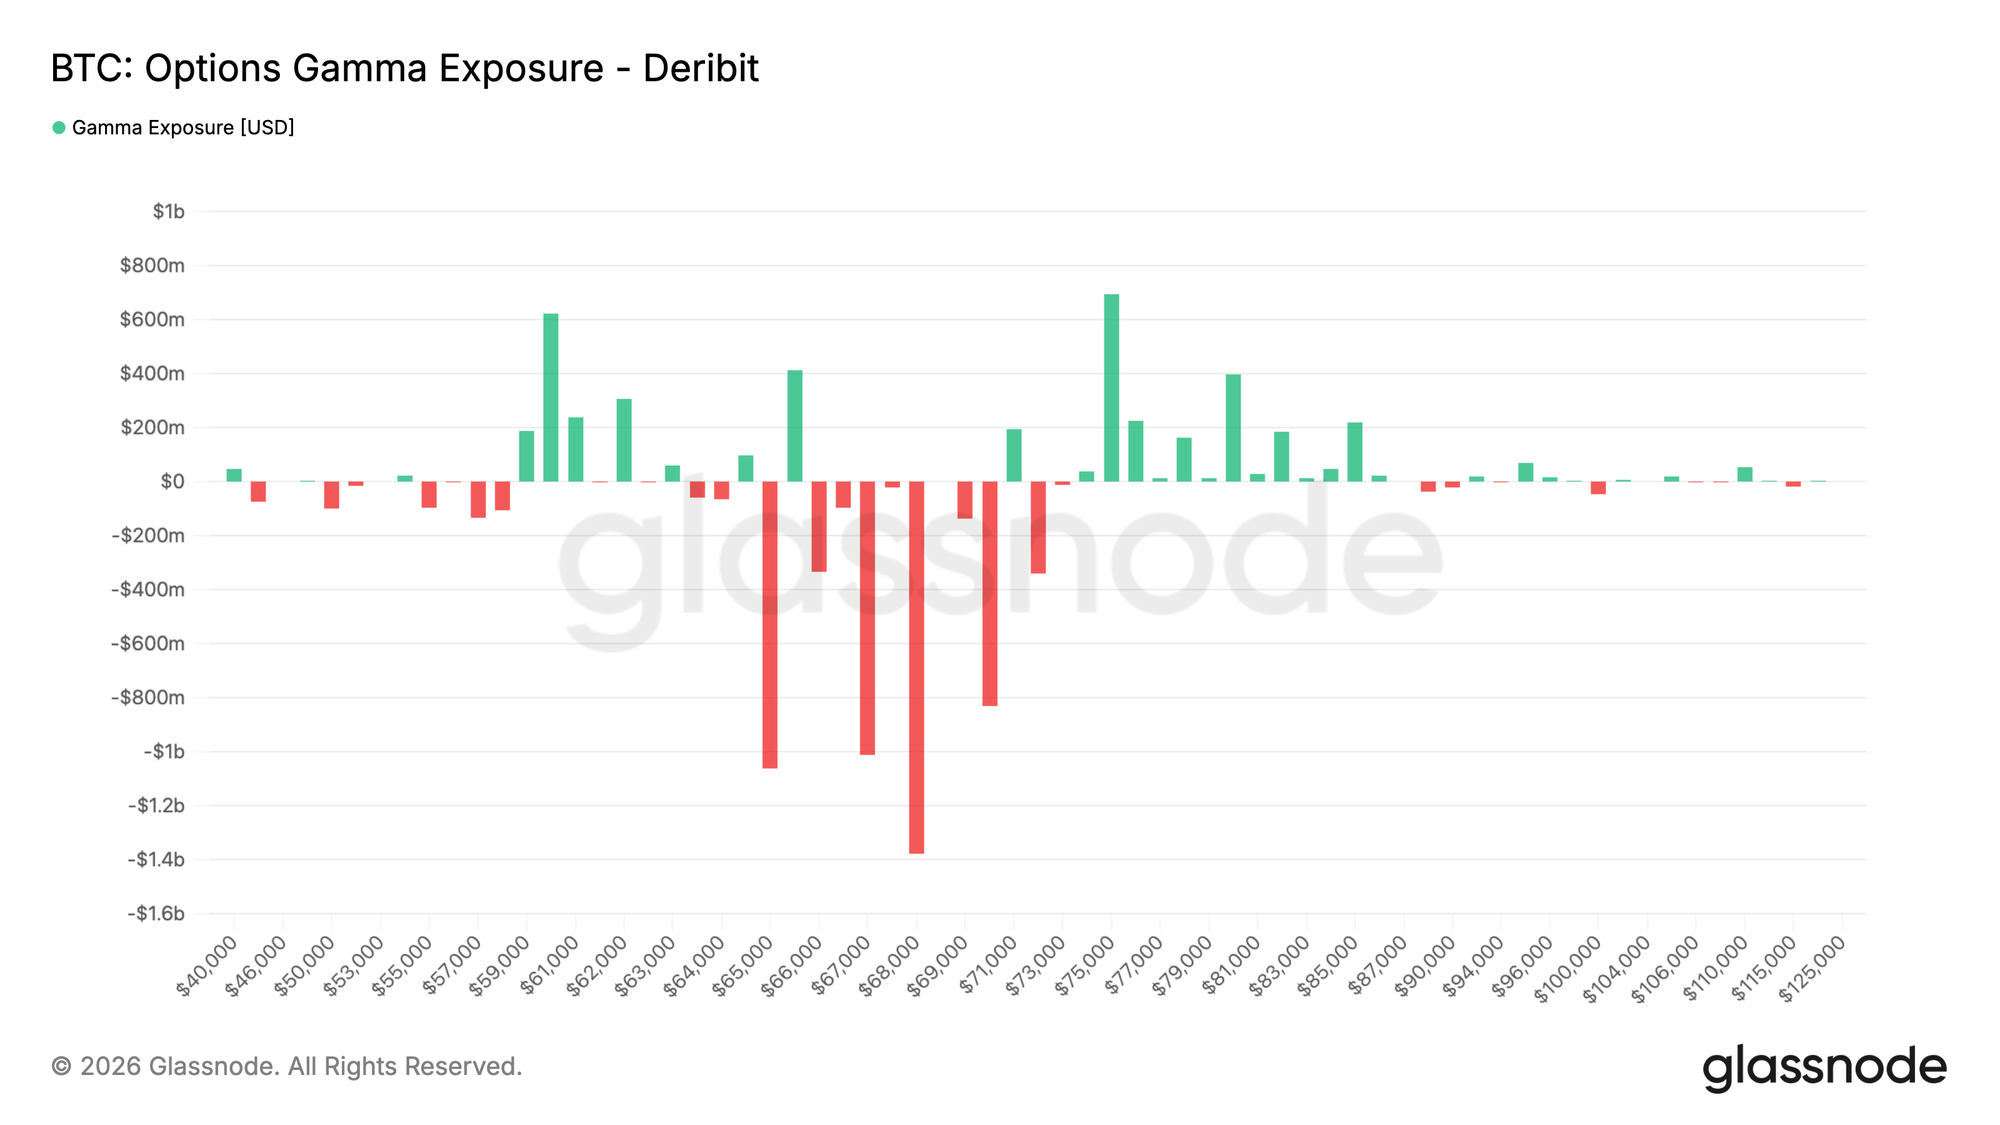
Gamma Exposure Concentrates Above Current Spot
Beyond pricing and sentiment, gamma exposure helps identify the strike levels where dealer hedging may have the greatest impact on market dynamics.
Recent flow has become more balanced. Over the past seven days, put buying represented the largest share of premium traded at 28.1%, with call buying close behind at 24.1%. The last 24 hours show call buying slightly exceeding put buying.
This evolution is reflected in the gamma profile. The largest negative gamma cluster now sits at 68K, with additional short gamma exposure extending from 66K to 71K. With Bitcoin currently trading near 65K, spot remains just below the main concentration of short gamma. Positive gamma exposure sits much higher in the high 70s, leaving Bitcoin far from the nearest area of stabilizing dealer positioning.
As protection demand normalizes, dealer positioning remains concentrated above current spot, leaving the largest negative gamma zone centered around 68K.
Conclusion
Bitcoin remains in a corrective phase, but the character of the market is beginning to shift. While profitability has deteriorated, realized losses have accelerated, and recent buyers remain under pressure, several indicators suggest the market is moving from forced selling toward stabilization.
Liquidity conditions are improving, spot order books are rebuilding, and passive buyers are becoming increasingly active. At the same time, ETF holders continue to display relatively strong conviction, extending holding periods rather than aggressively reducing exposure. Options markets remain cautious, with downside protection still in demand, but volatility expectations have eased from recent extremes.
The result is a market that remains fragile, yet increasingly supported by patient capital. Whether Bitcoin can establish a durable floor near current levels will likely depend on whether improving liquidity and selective accumulation can outweigh the ongoing weakness in profitability and broader risk sentiment.