Spot Orderbook Metrics Live on Glassnode
Aggregated orderbook metrics for spot markets are live on Glassnode, starting with Binance and Coinbase across the most liquid BTC and ETH pairs.


The release gives Glassnode users a cleaner view of liquidity, execution conditions, and resting market intent before trades clear.
Executed trades show where transactions happened. The order book gives the live view around those trades: available liquidity, quoted prices, and the cost of crossing the market at a given point in time.
For traders, execution desks, quant researchers, and risk managers, this matters because volume alone can hide weak liquidity. A venue can print high volume while the spread widens, depth thins, or larger orders become expensive to execute. Orderbook metrics make those conditions measurable.
Explore the new metrics in Glassnode Studio. Available to Professional plan users.
Why Orderbook Metrics Matter
Executed volume shows where transactions happened. Orderbook data shows where liquidity is sitting right now, waiting to be hit.
That distinction matters because a market can look busy on trade volume while staying fragile underneath. A venue might print high volume, but if the spread widens or depth disappears, getting filled becomes expensive. A price move might look strong, but with little resting liquidity behind it, the move is unstable.
These metrics help answer practical trading questions:
- Where is liquidity best right now? Which venue has the tightest spread and the deepest book?
- How expensive is it to execute? What's the estimated price impact for a $10k, $100k, $1m, or larger order?
- Is liquidity improving or deteriorating? Are spreads widening, depth thinning, or liquidity drifting away from mid?
- Is there more resting buy or sell liquidity around the market? Is the bid side or the ask side deeper within a chosen price band?
- Is the market turning fragile? Are small trades still cheap while larger ones would walk straight into worse prices?
Reading Intent Before the Trade Prints
Orderbook data tracks intent. Trades are confirmed actions: aggressive buyers or sellers crossing the spread. The book shows resting limit orders, the liquidity participants are currently willing to provide.
This creates a pre-trade view of the market:
- bid-side depth measures resting buy liquidity below the market;
- ask-side depth measures resting sell liquidity above the market;
- spread measures the immediate cost of crossing the market;
- price impact estimates the execution cost for a given trade size;
- depth slope shows whether liquidity is concentrated near the mid-price or placed further away.
This is useful in live trading because liquidity often deteriorates before volatility appears in executed trades. Spreads widen, orders get pulled, and depth becomes uneven. These changes can be measured directly from the book.
New Metrics Overview
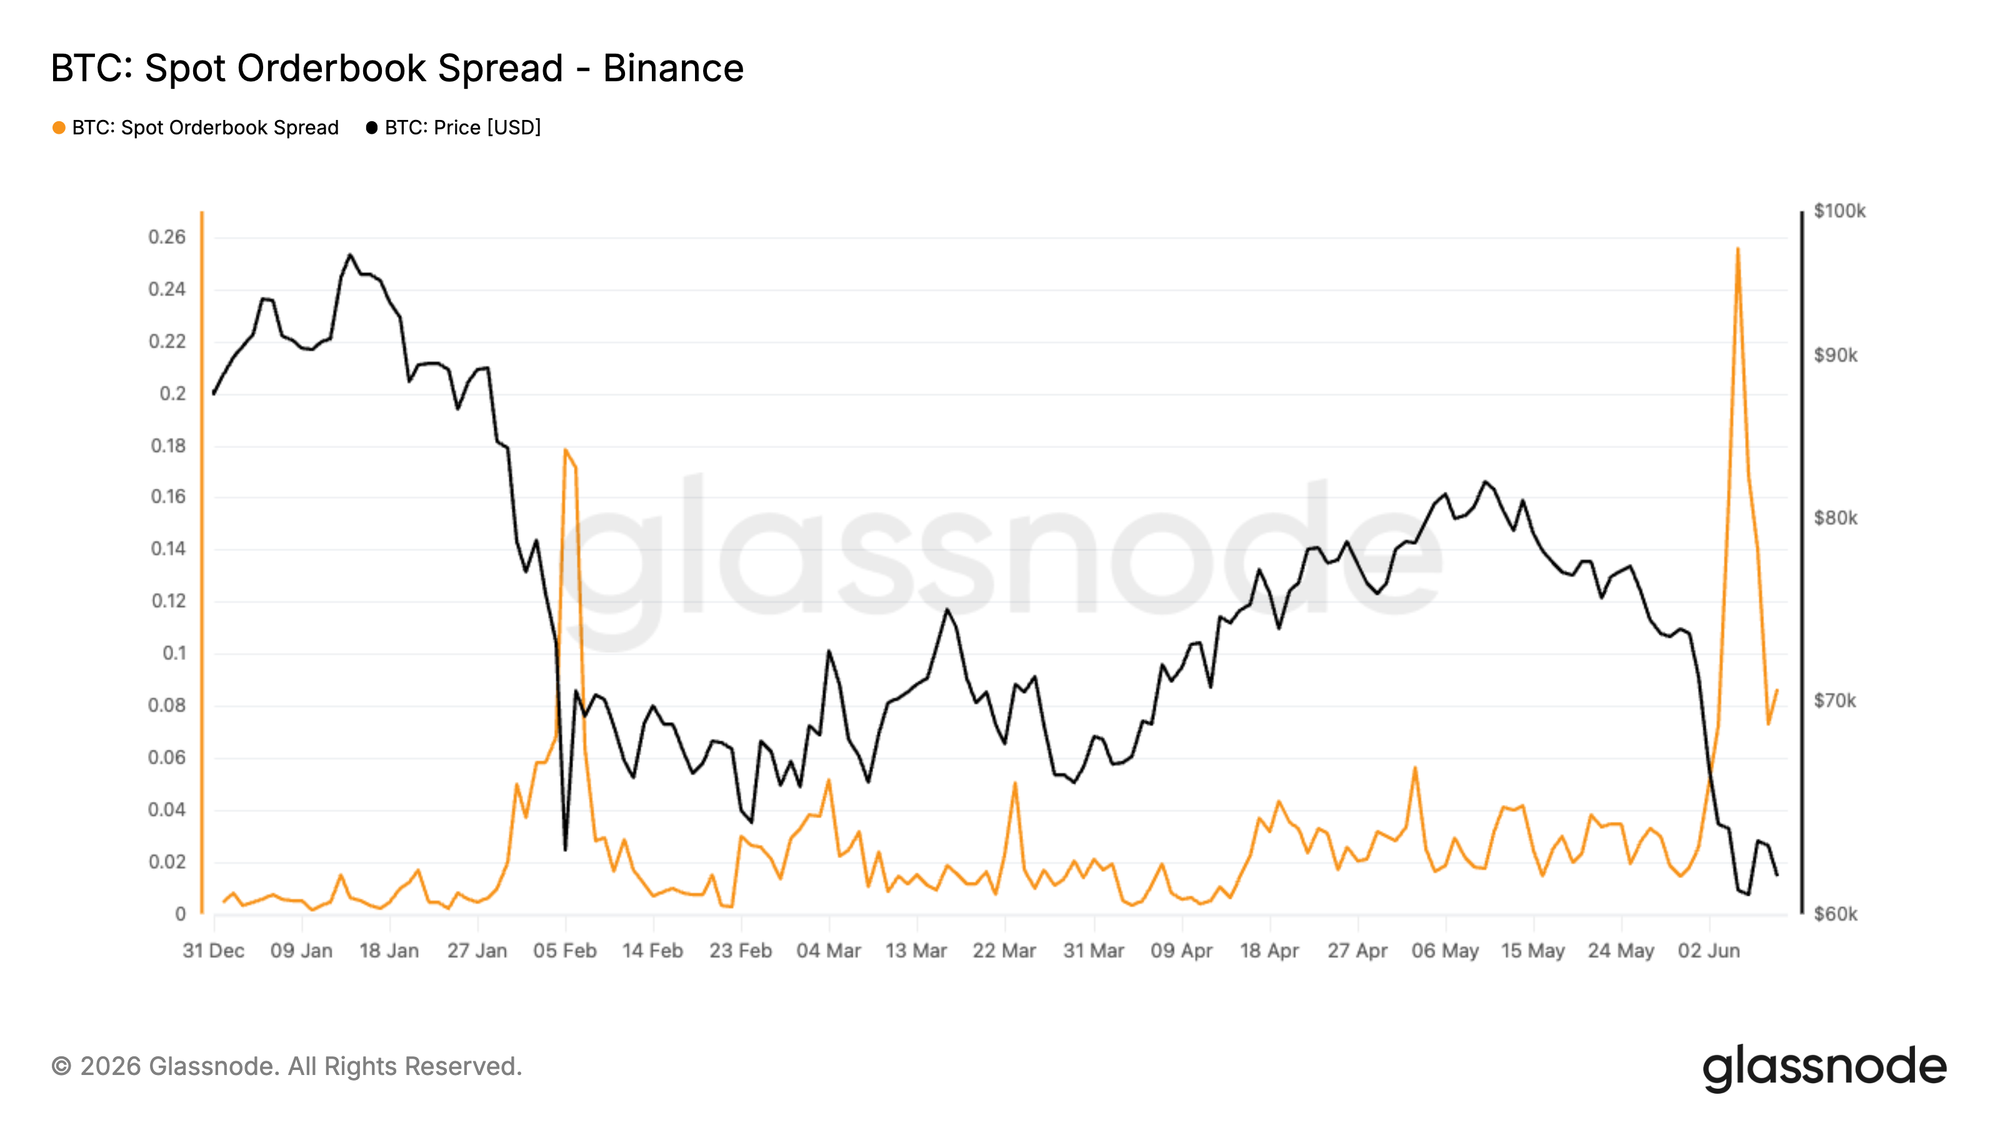
Bid/Ask Spread: TWA, Max, Min, Close
The bid/ask spread is the gap between the best ask and best bid, expressed in basis points of the mid-price. It is the cleanest measure of top-of-book trading friction.
spread_bps = (best_ask − best_bid) / mid_price × 10,000
- Spread (TWA): time-weighted average spread over the bucket — the "normal" trading friction during the interval. Lower values indicate tighter top-of-book liquidity; higher values suggest thinner markets or liquidity stress.
- Spread (Max): the widest spread observed at any single moment in the bucket. Did this venue briefly become expensive or unreliable to trade on? Spikes flag momentary liquidity gaps from news shocks, flash moves, or pulled orders.
- Spread (Min): the tightest spread in the bucket — the best-case cost of crossing during the interval.
- Spread (Close): the spread at the final update of the bucket — a snapshot of conditions as the interval closes, useful for aligning with bar-close-based models.
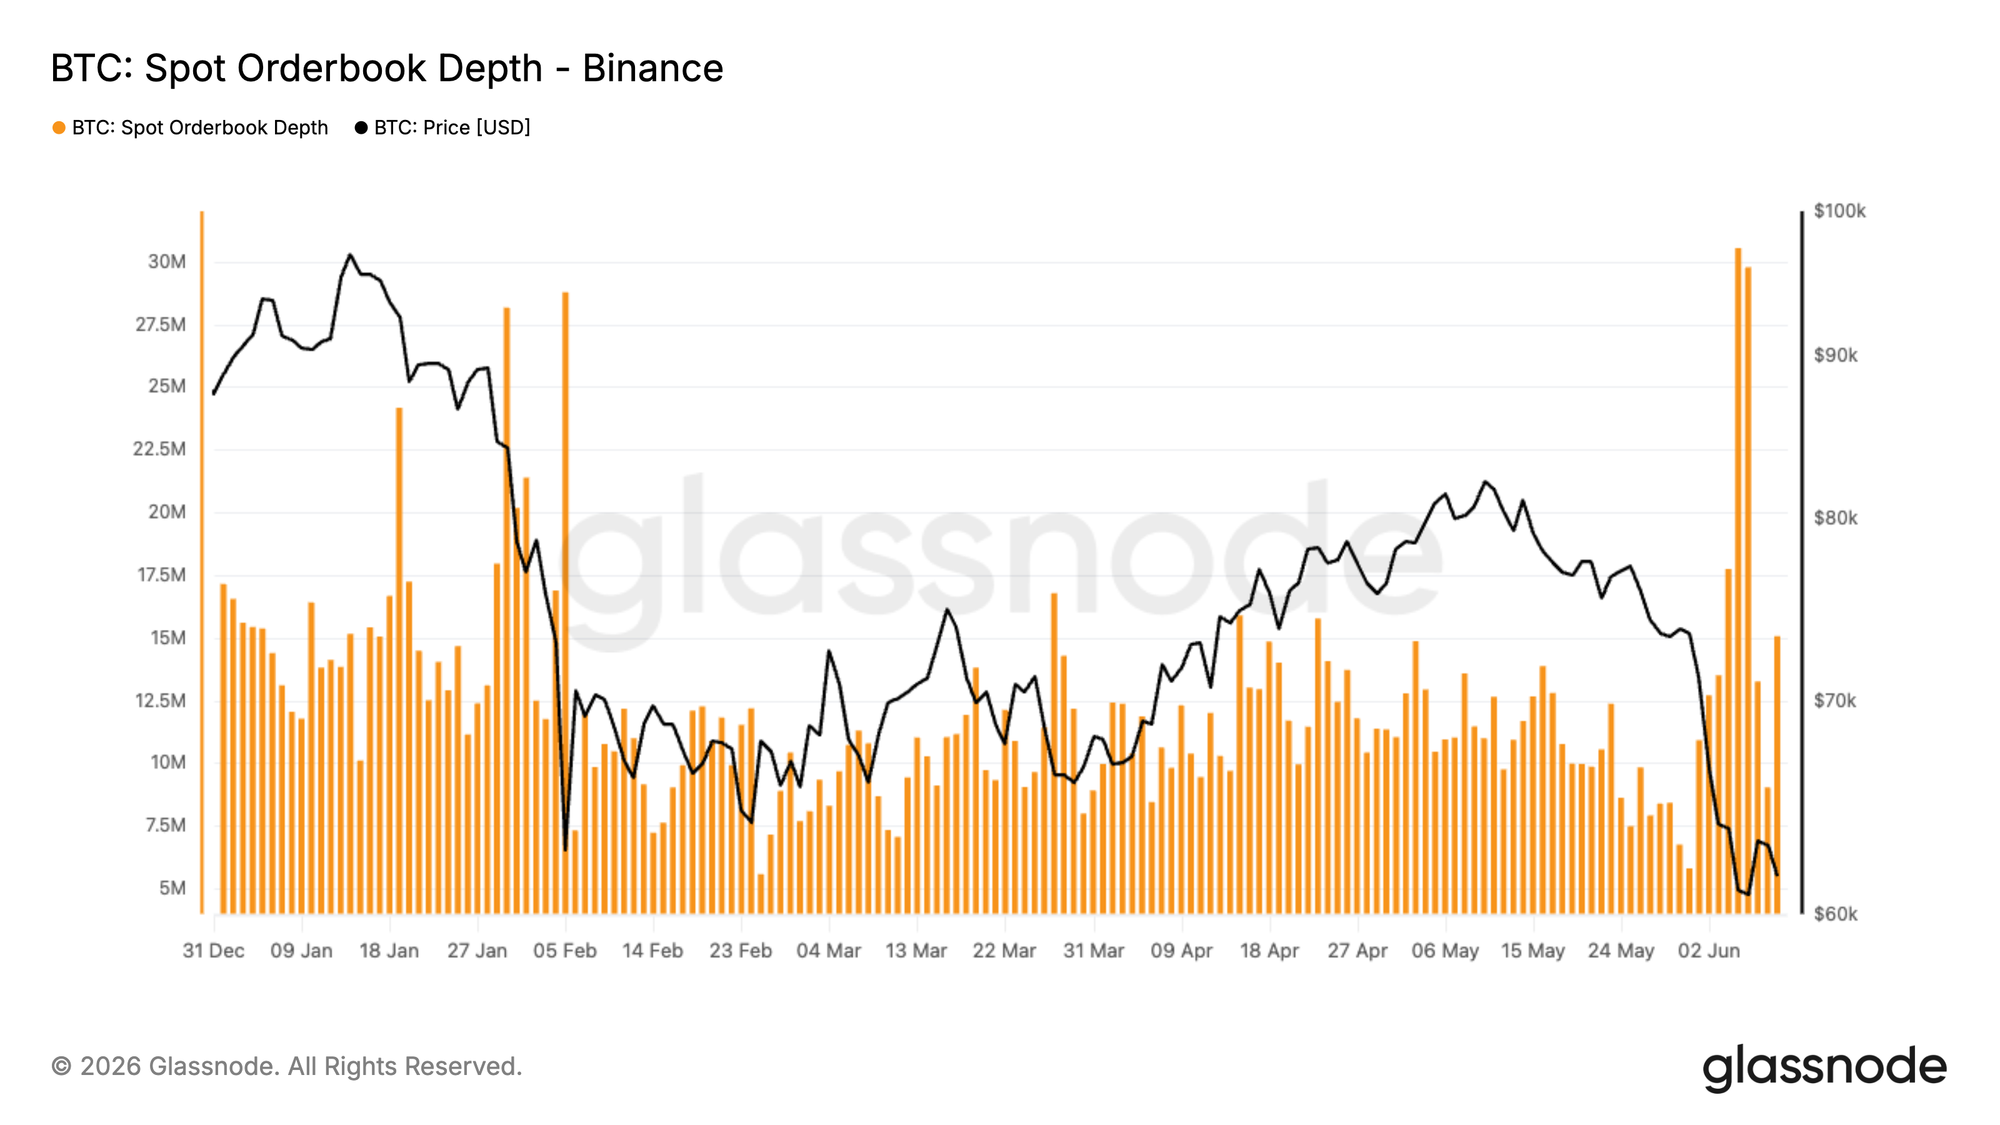
Depth
Total resting liquidity on one side of the book, bid (buy limit orders below the market) or ask (sell limit orders above it), within a chosen price band around mid, measured in quote currency and time-weighted across the bucket.
The band is configurable across 25, 50, 100, 200, 500, 1000, 1500, and 2000 bps, so you can measure liquidity right at the top of book or progressively deeper. Because the side is selectable, you can track bid and ask liquidity independently, which is handy for catching one-sided book building that a netted measure would hide.
Depth is the core liquidity read. More depth means the market absorbs larger trades with less price movement. Thinning depth usually comes before wider spreads and higher price impact.
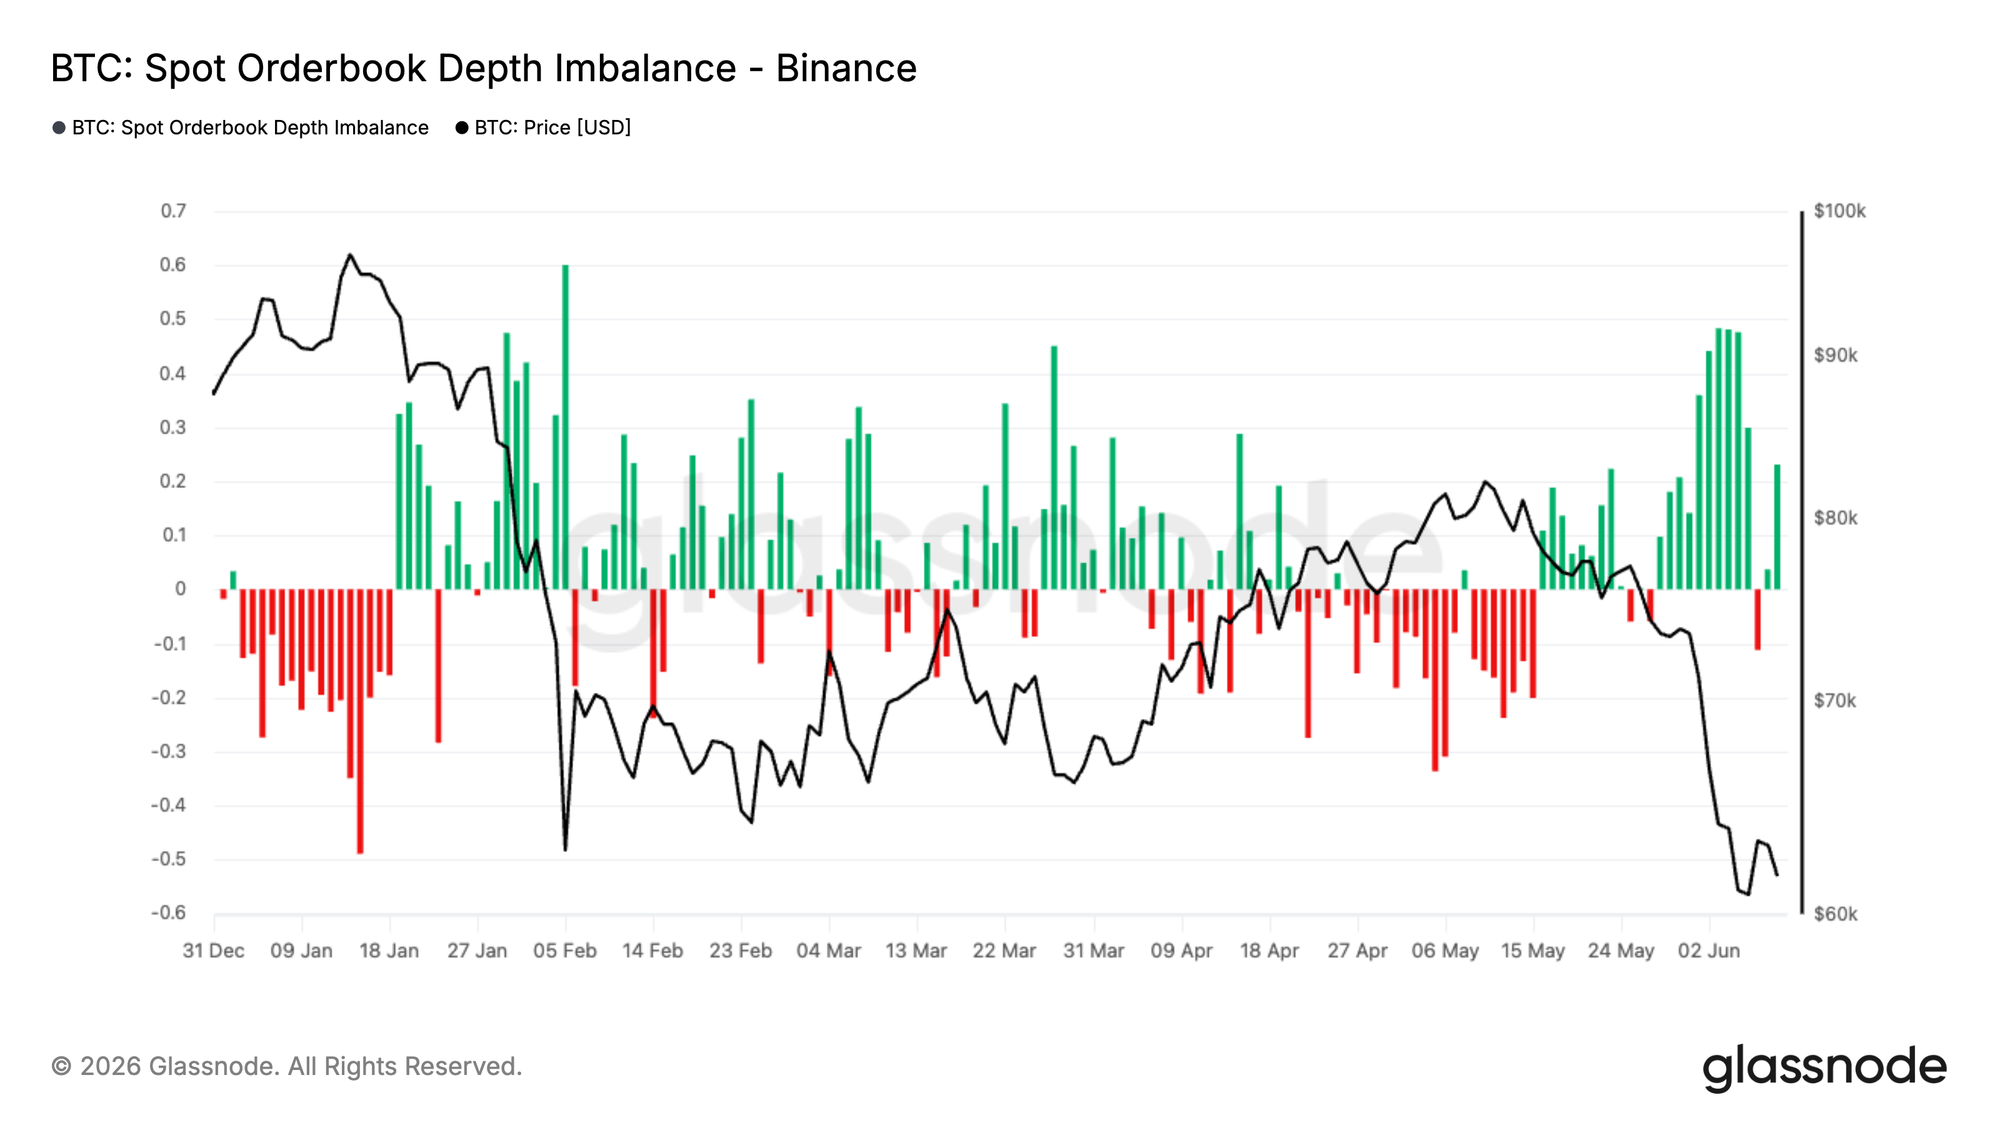
Depth Imbalance
Depth imbalance compares bid-side depth with ask-side depth inside the selected band.
imbalance = (bid_depth - ask_depth) / (bid_depth + ask_depth)
The range is [-1, +1].
Positive values mean there is more resting buy liquidity below the market. Negative values mean there is more resting sell liquidity above the market.
This is one of the most useful orderbook features for short-horizon models. It captures how liquidity is distributed around the current price and can be used to study short-term pressure, mean reversion, or momentum depending on the horizon.
Depth Delta
Depth delta is the simple difference between bid depth and ask depth.
depth_delta = bid_depth - ask_depth
Depth imbalance normalizes the difference. Depth delta keeps the absolute size.
This matters when the magnitude of liquidity matters more than the ratio. For example, a small imbalance in a very deep book can be more relevant than a large imbalance in a thin book.
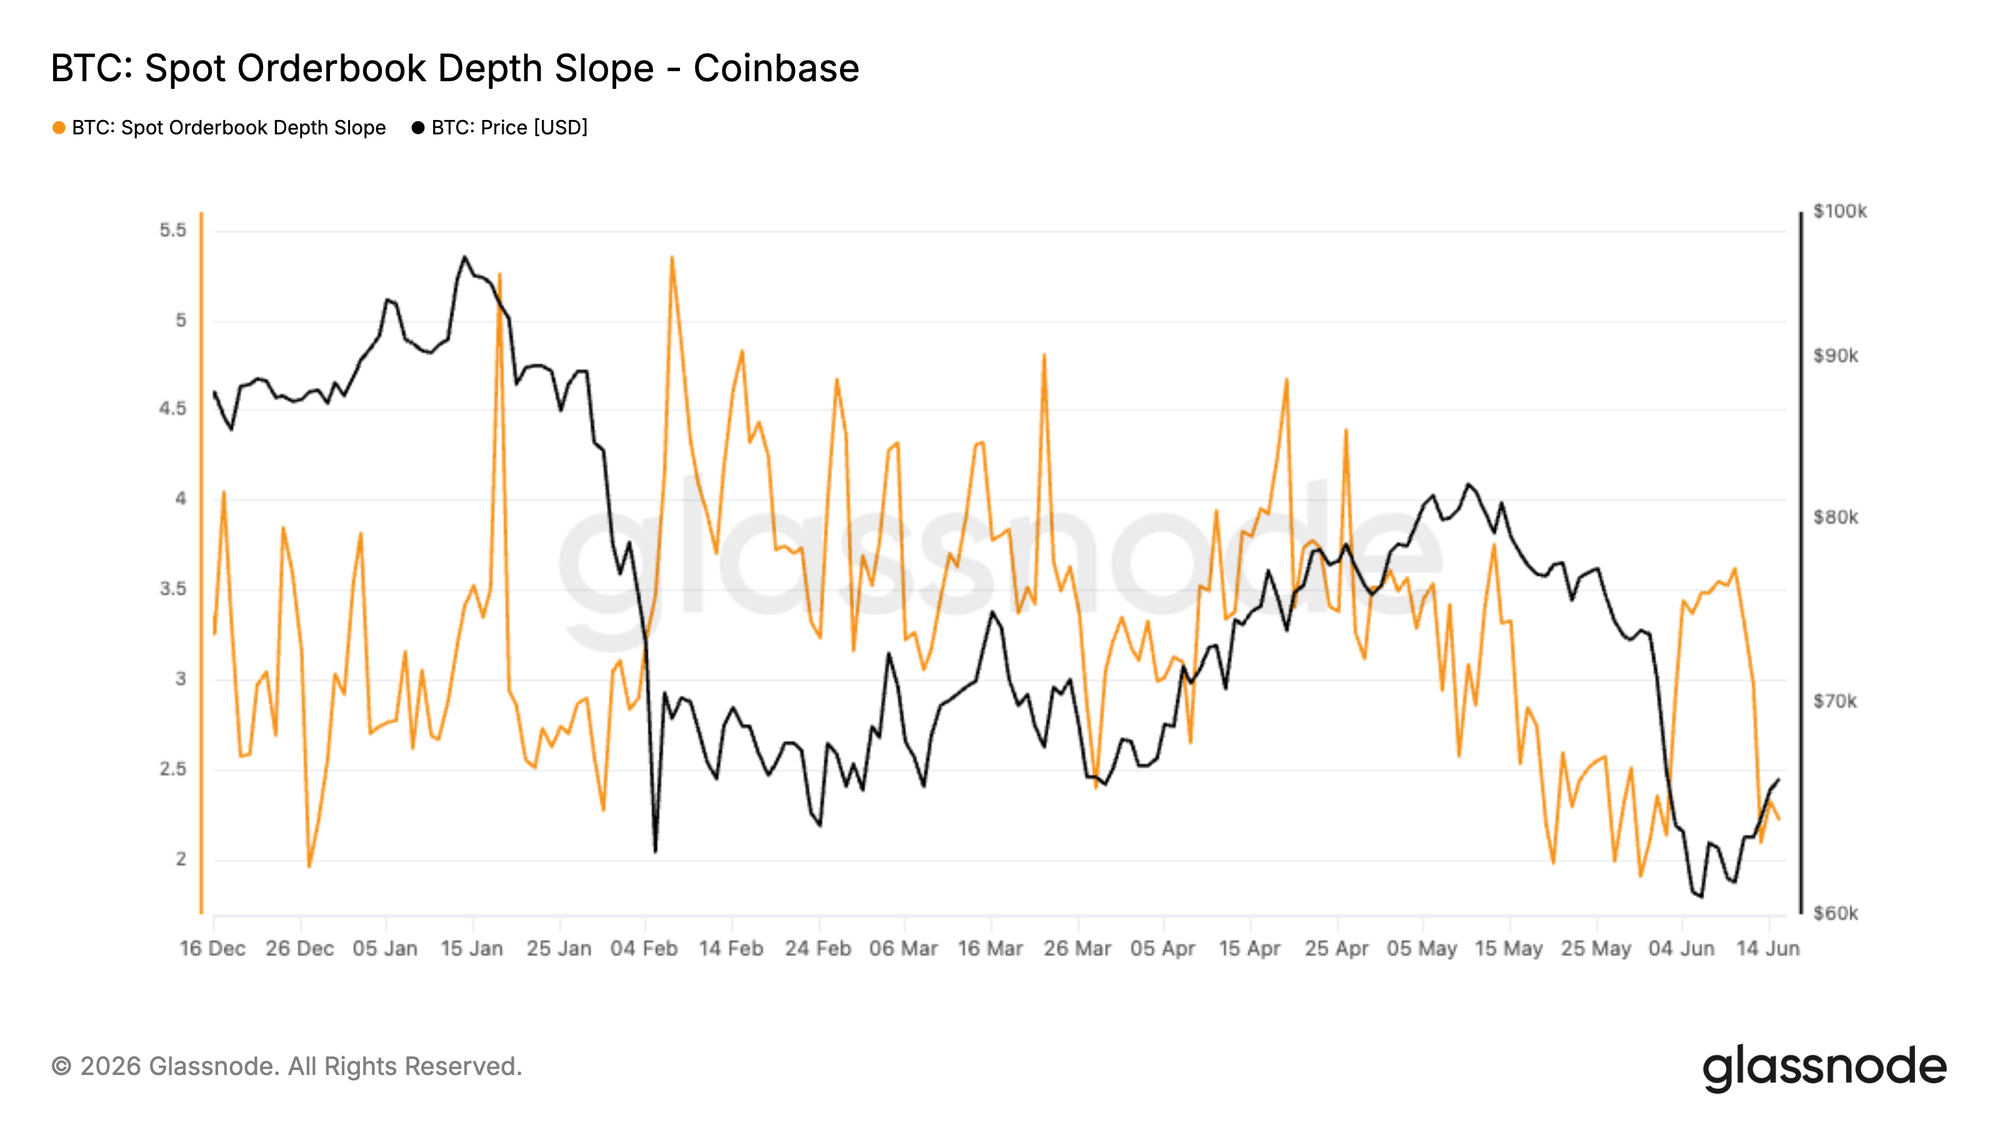
Depth Slope
Depth slope measures how liquidity builds as price moves away from the mid-price.
depth_slope = depth_wide_band / depth_25bps
The wider band can be 100, 500, 1000, or 2000 bps.
A higher slope means liquidity is thin near the mid-price and thicker further away. This can signal fragile top-of-book liquidity: small orders may still execute cheaply, while larger orders quickly move into worse price levels.
A lower slope means more liquidity is available close to the mid-price, which usually supports better execution for moderate order sizes.
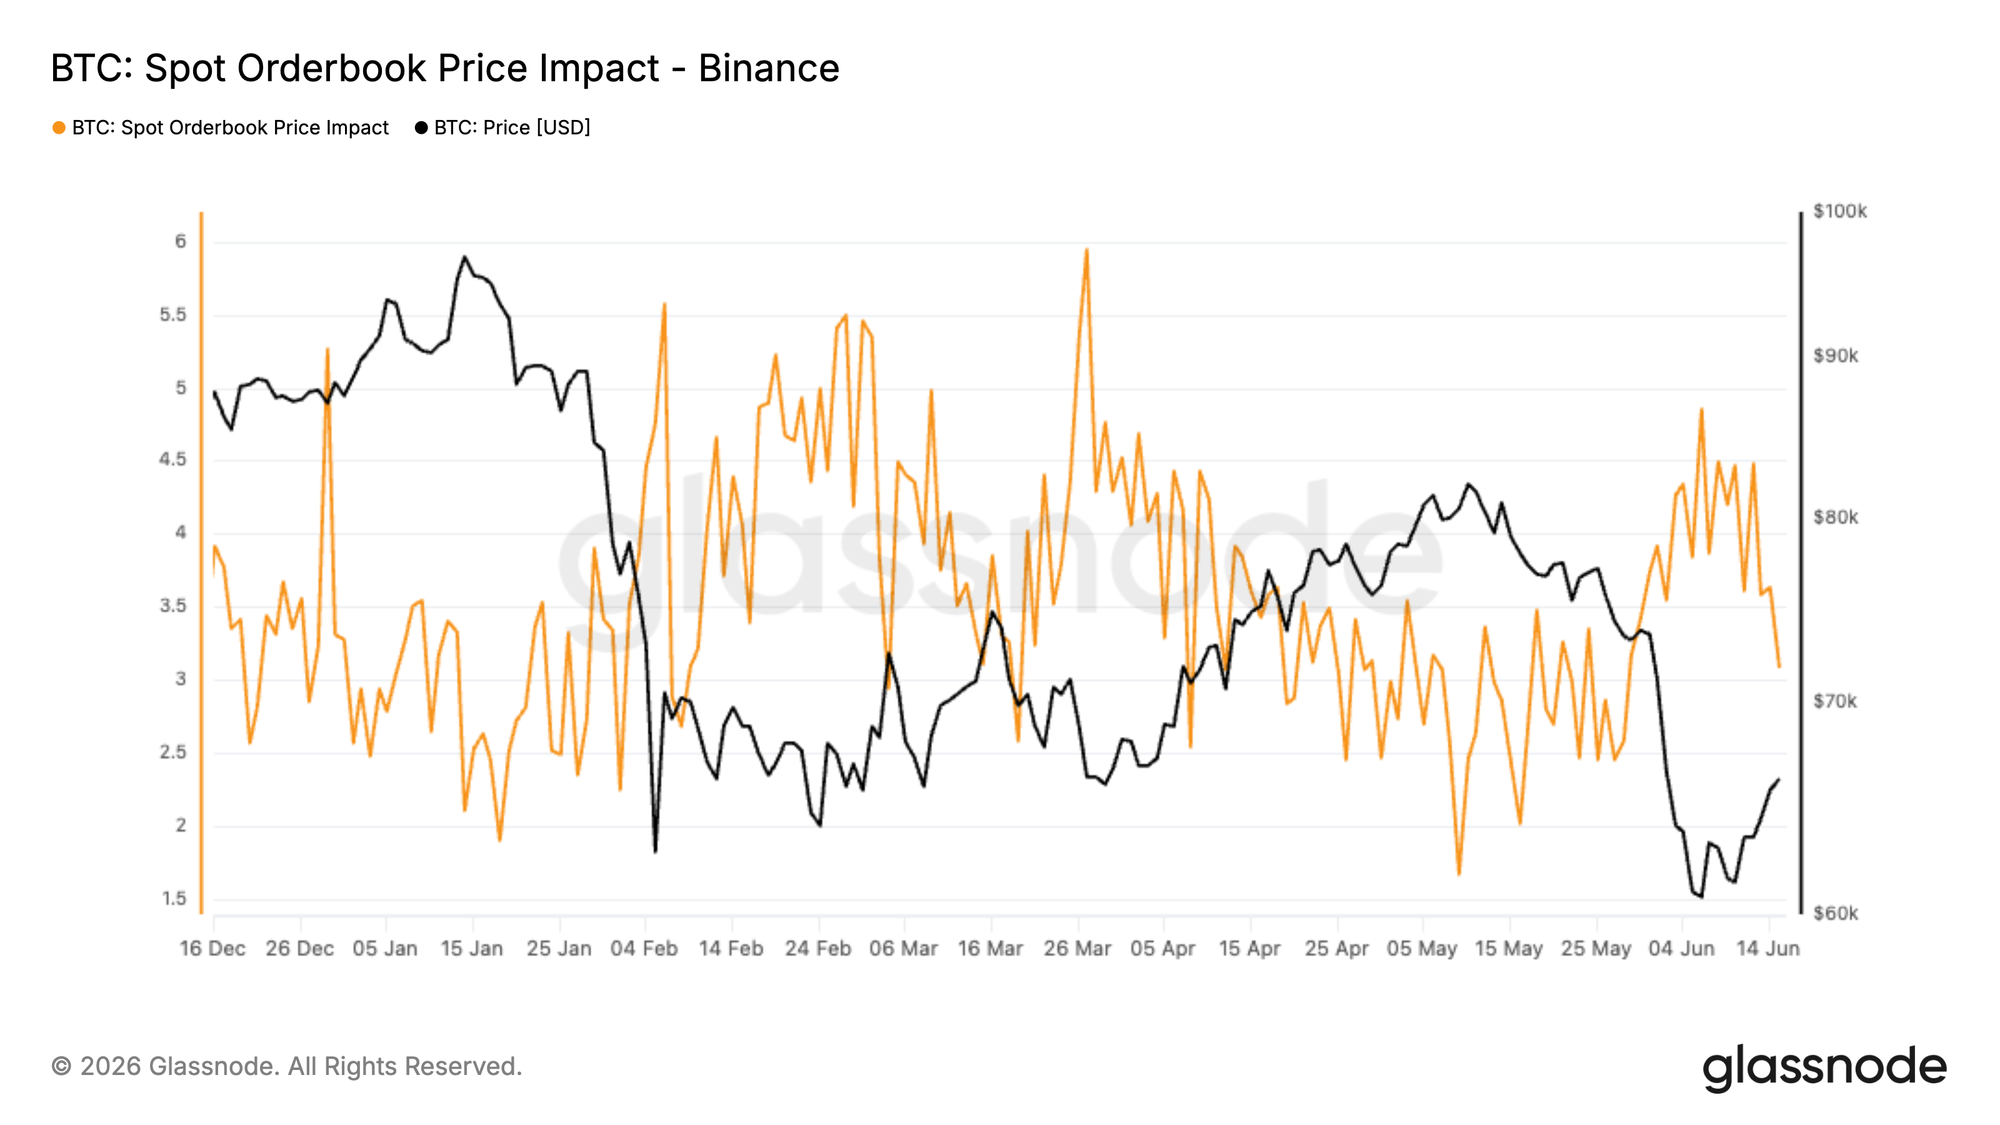
Price Impact (Estimated Slippage)
Answers the most practical pre-trade question there is: if I send a market order of size X right now, what will it cost me?
For a given notional (e.g. $10k, $100k, $1M, $10M in quote currency), we walk the live order book from mid-price, compute the volume-weighted average fill price, and express the gap to mid in basis points:
impact_bps = (vwap_fill_price − mid_price) / mid_price × 10,000
Example reading: "Buying $1Mio of BTC on Binance right now costs ~3 bps." Use it to estimate cost before trading, compare venues for a given order size, or benchmark realized fills against expectation.
Putting it Together: a Practical Example
Suppose BTC sells off sharply during a short time window. A trades-only view shows heavy sell volume after the move has started. The order book gives more detail about the liquidity conditions around the move.
- Spread (Max) spikes on Venue A but stays contained on Venue B → Venue B is the safer exit.
- Depth within 100 bps halves on Venue A → its book is being pulled, not just consumed.
- Depth Imbalance flips deeply negative → resting sell pressure is stacking above the market.
- Price Impact ($1M) triples → the real cost of de-risking has changed, regardless of what the last trade printed at.
Each of these signals was visible in the book before it showed up in executed prices.
How Useful is Orderbook Data for Your Team?
- Pre-trade venue selection – "Where do I execute?"
Which exchange offers the best liquidity, on average and at the moment of execution? Compare spreads and estimated execution cost across exchanges for the same pair, at the same time.
Metrics: Spread (TWA), Spread (Max), Price Impact - Short-horizon directional alpha – "Which way does price go next?"
Quant / ML users building features for models that predict mid-price returns over the next N minutes. Depth imbalance and depth delta capture the resting-order pressure on each side of the book — a classic microstructure input whose predictive sign can flip between momentum and contrarian depending on the measurement horizon.
Metrics: Depth Imbalance, Depth Delta, Depth - Risk management – "Can I exit if I need to?"
Which venue holds up under stress — and which one evaporates? Track how depth, spread, and price impact deteriorate during volatility events to know in advance where an emergency exit is cheapest.
Metrics: Price Impact, Depth, Spread (Max) - Market structure or regime detection – "What kind of market is this?"
For users building macro overlays or regime-switching models on top of microstructure. Persistent widening of spreads, thinning depth, or steepening depth slopes signal a transition from a calm, liquid regime to a fragile one — often before realized volatility confirms it.
Metrics: Spread (TWA), Depth, Depth Slope
Available Glassnode Orderbook Metrics
Spot Orderbook Metrics are live now for Binance and Coinbase, covering the most liquid BTC and ETH pairs
- at 10-minute, 1-hour, and 24-hour resolutions
- in CSV and JSON and via the API.
Configurable parameters:
- depth band (25 / 50 / 100 / 200 / 500 / 1000 / 1500 / 2000 bps)
- side (
bid/ask) for depth-based metrics, and - order notional for price impact.
Leverage the full power of Glassnode's platform with the fully customizable Professional plan.
- Follow us on X for timely market updates and analysis
- Join our Telegram channel
- For on-chain metrics, dashboards, and alerts, visit Glassnode Studio