Market Compass: The Dollar Does the Lifting
Our Market Compass snapshot: where the market stands across the macro, cycle, capital-flow, derivatives, behaviour, on-chain and rotation lenses, with the full PDF report free to download and the live dashboard updated daily.

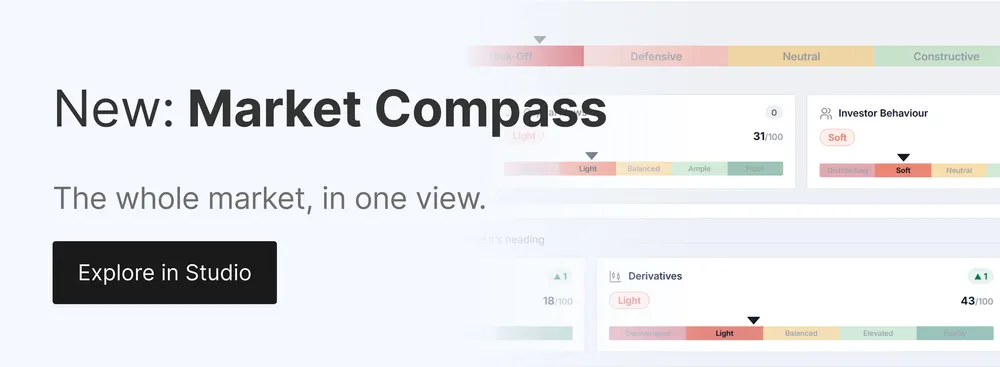
The Market Compass reads the whole crypto market in one view: seven lenses, one composite score, updated every day. This article is the monthly snapshot.
New to the Market Compass? Learn more here.
The full report for this edition is freely available in PDF format.
The State of the Market
The Composite prints 25/100 (Defensive), up from 21 a week ago and 22 a month back, and has now held out of Risk-Off for eight straight sessions. The lift is small but genuine, and it has one engine: Macro, the heaviest weight on the score, firming from 13 to 23 over the month as the dollar's long slide holds.
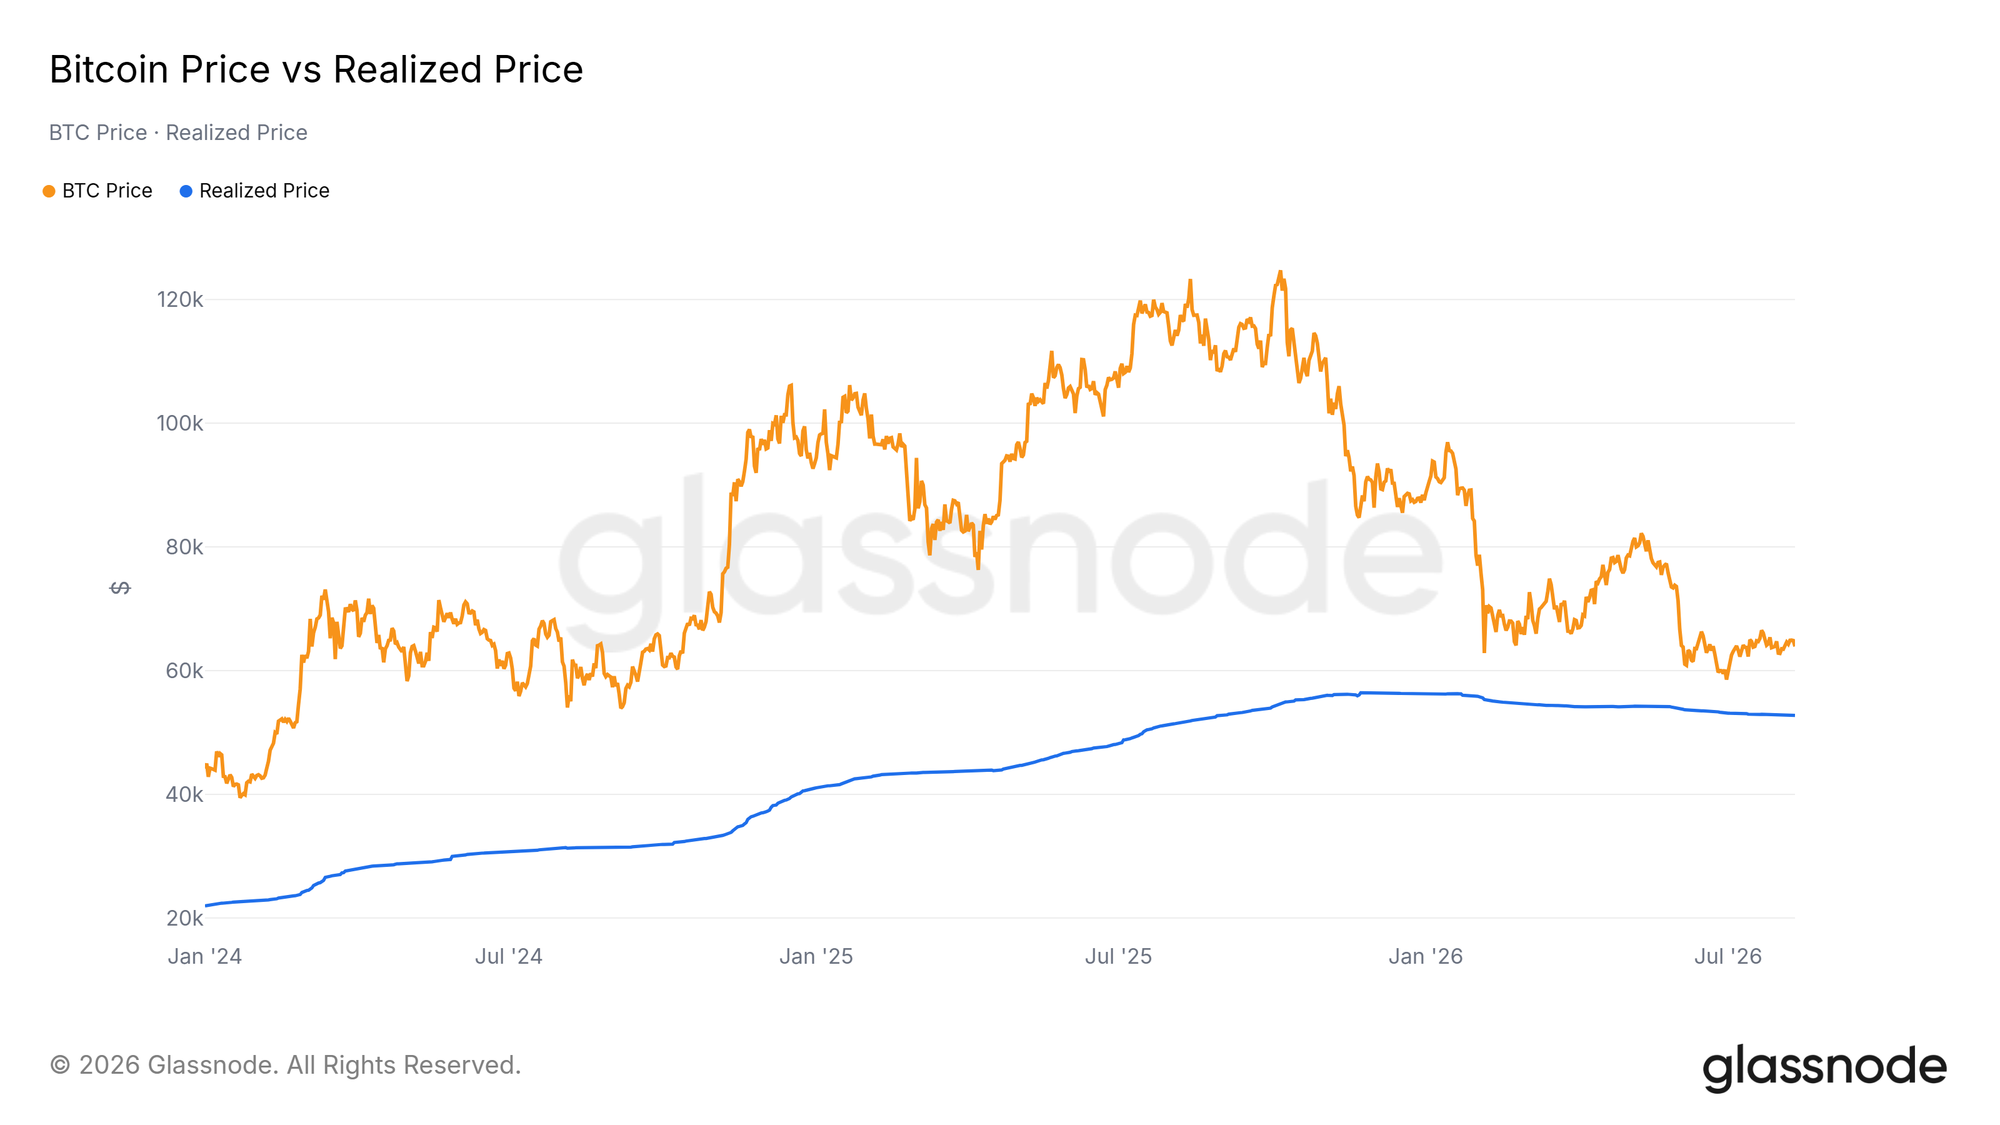
Underneath, the setup is cheap valuation into calm option pricing. Spot near $63.9k holds a premium over the average coin's cost basis near $52.8k, realized profit-and-loss sits just above break-even at 1.05, and option-implied volatility has only just ticked up to near 36 off its two-year floor.
The tell is the passive bid. US spot ETF flows held near net creation of +$95M a day, an eighth straight positive session, while the share of recent buyers in profit climbed above 43% even as spot eased. A fresh dollar break below its 200-day average with that bid intact would carry the read toward Balanced; a dollar bounce extending or an ETF relapse would stall it back toward Risk-Off.
New: The Cycle Position Board
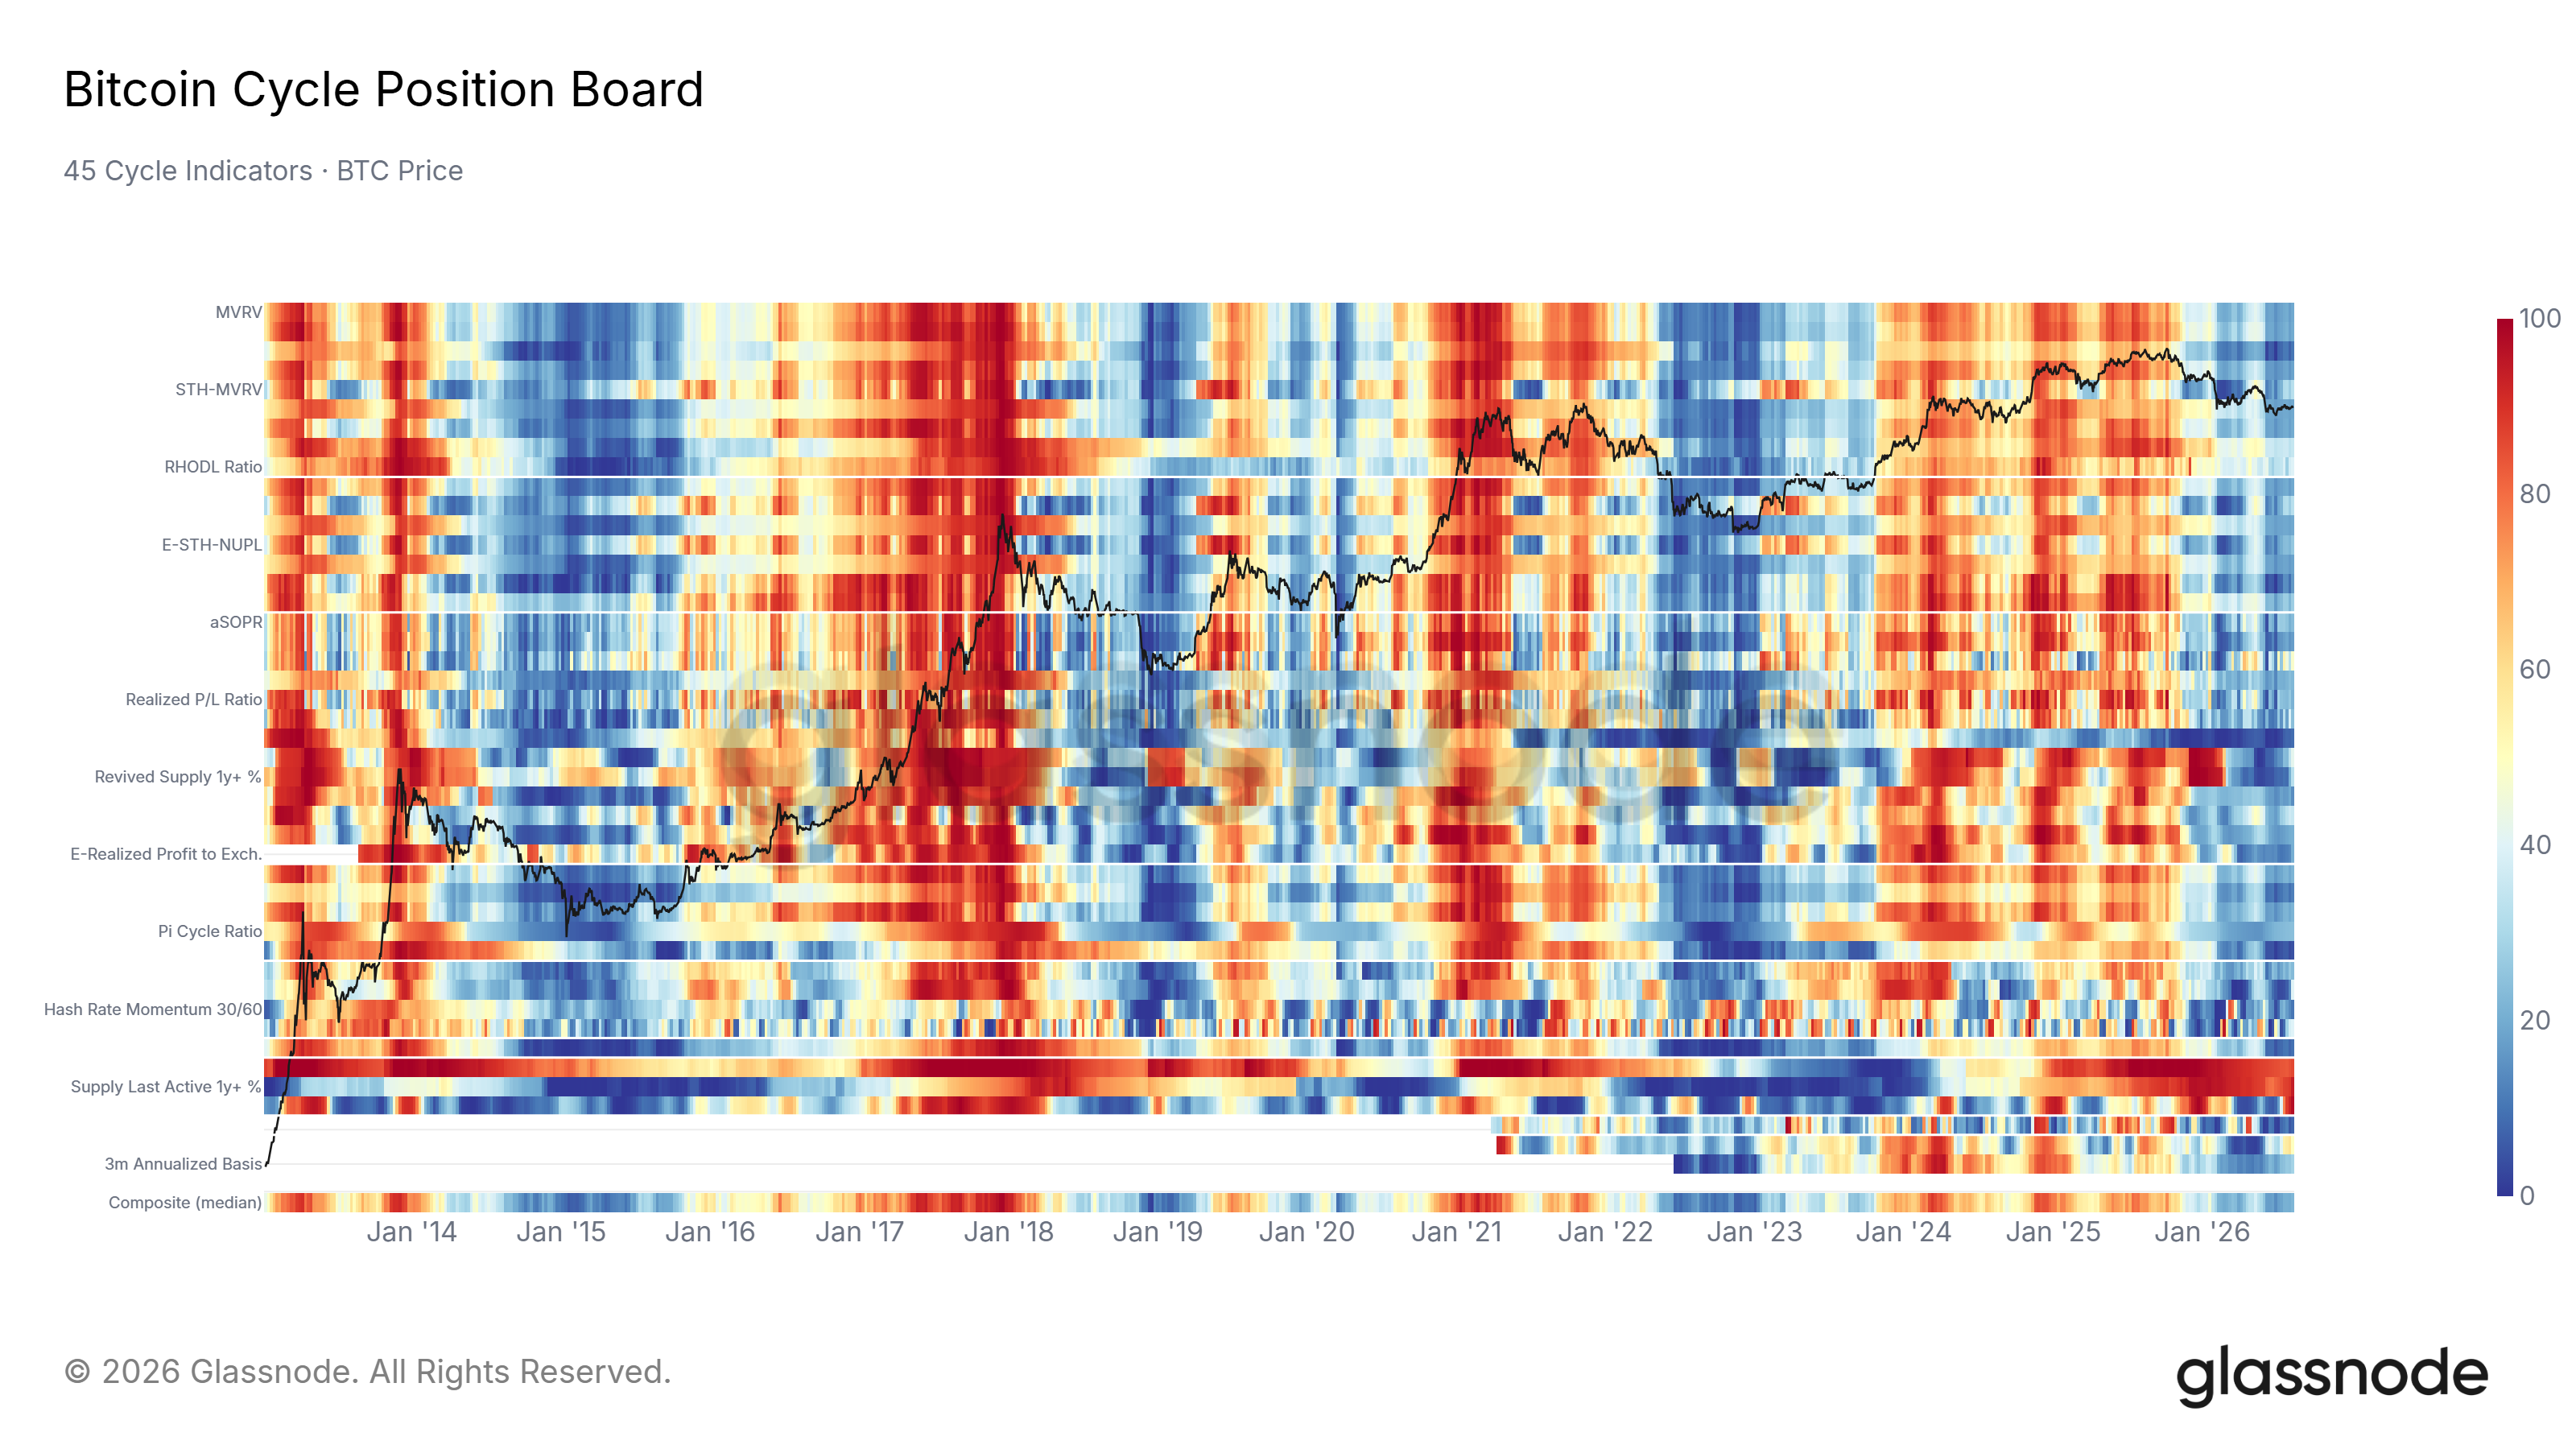
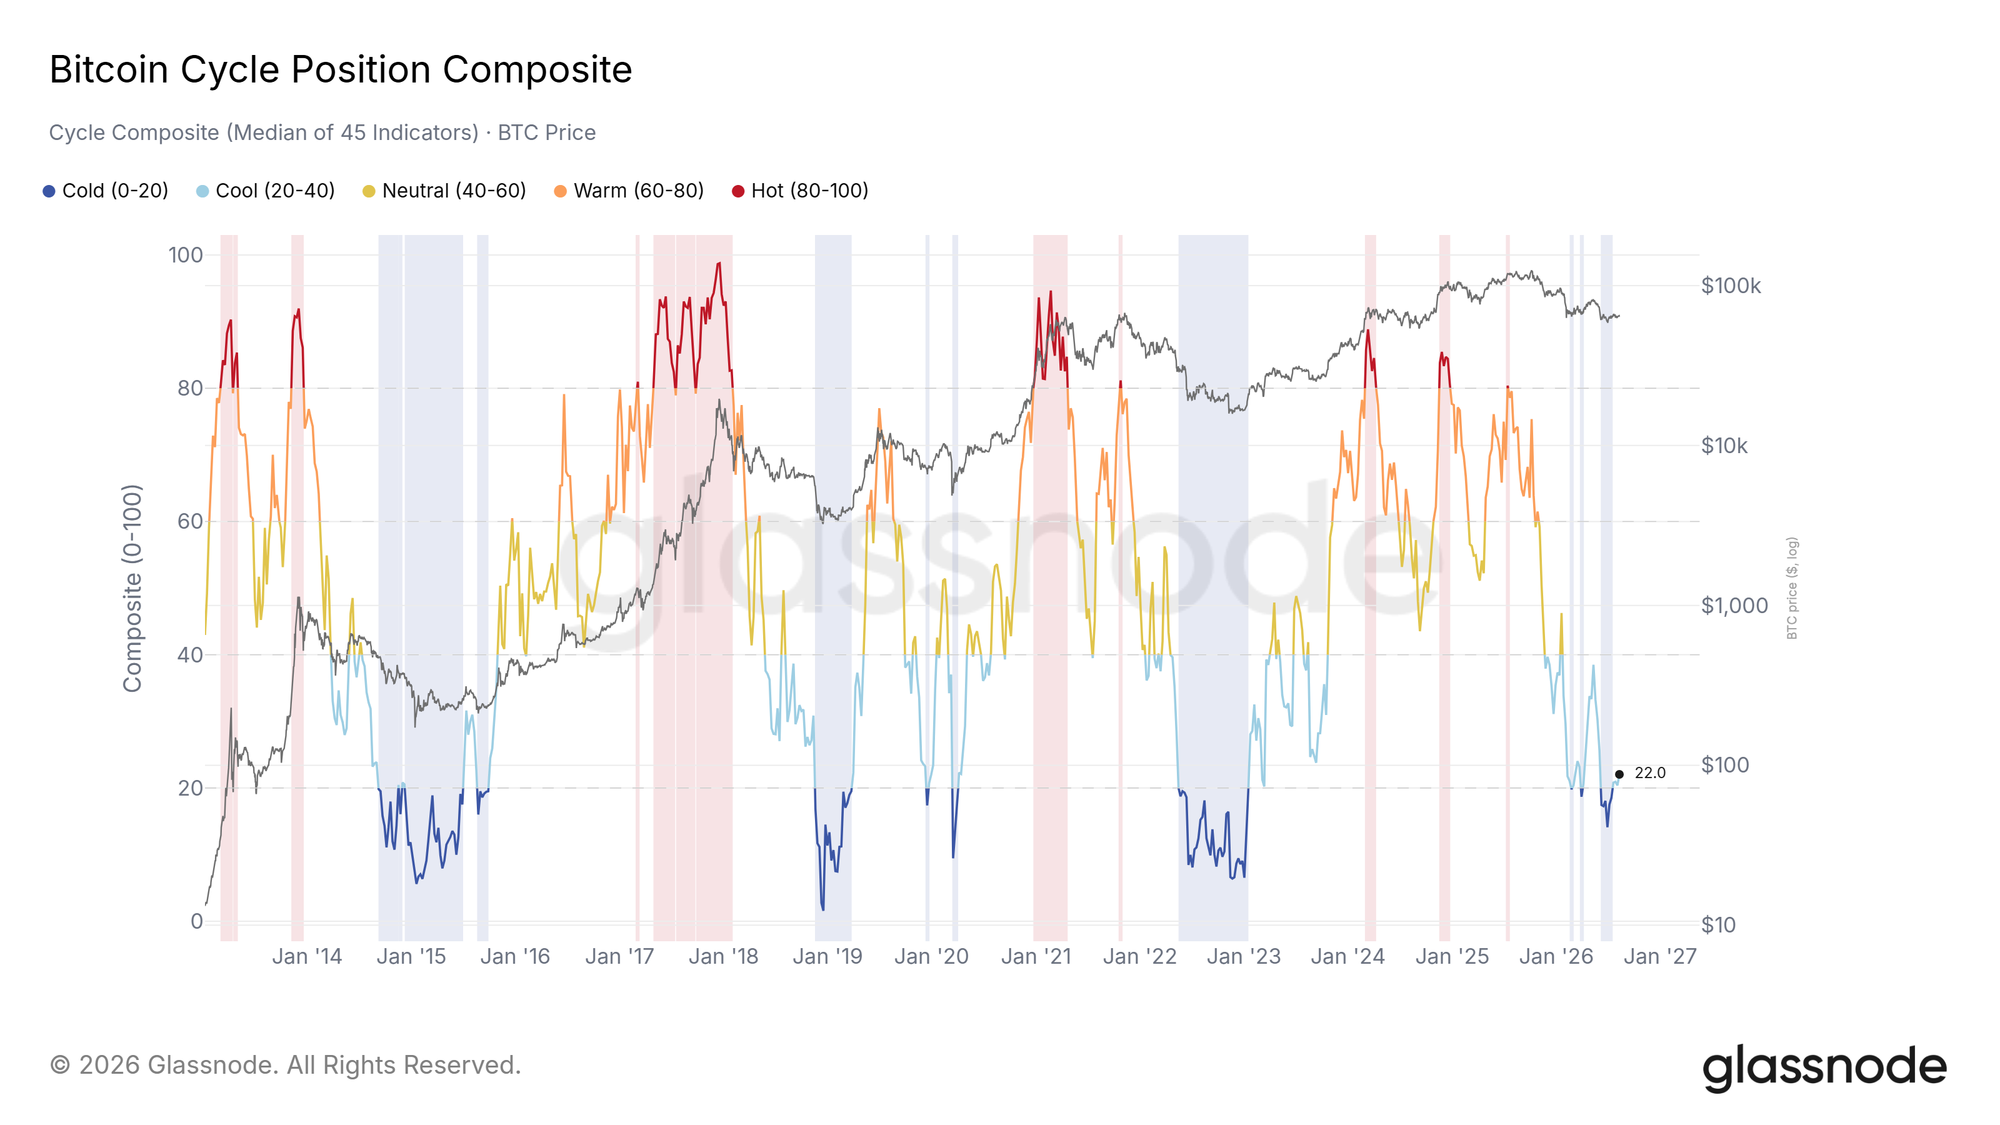
This edition debuts the Cycle Position Board, a new set of indicators that tracks confluence across 45 of our best Bitcoin metrics. Each indicator is scored 0 to 100 inside its own four-year history, so 100 always reads overheated and 0 washed out, and the whole board condenses into a single composite median.
Historically, the blue stretches, where most of the board reads cold at once, have been great spots to accumulate, while deep red marked the overheated phases that ended each cycle. Today the board sits in the cool half of its range: a washed-out tape steadily building a base.
The board is available now in the Market Compass, our latest product to help you understand the market.
This article is a point-in-time snapshot. If you want the live picture and how it shifts day by day, the full dashboard with the daily analyst read is available to Glassnode Advanced and Professional members. Open the Market Compass to see where the market stands right now, or learn more about the Market Compass.
Disclaimer: This report does not provide any investment advice. All data is provided for informational and educational purposes only. No investment decision shall be based on the information provided here, and you are solely responsible for your own investment decisions.
Exchange balances presented are derived from Glassnode’s comprehensive database of address labels, which are amassed through both officially published exchange information and proprietary clustering algorithms. While we strive to ensure the utmost accuracy in representing exchange balances, it is important to note that these figures might not always encapsulate the entirety of an exchange’s reserves, particularly when exchanges refrain from disclosing their official addresses. We urge users to exercise caution and discretion when utilizing these metrics. Glassnode shall not be held responsible for any discrepancies or potential inaccuracies.
