BTC Market Pulse: Week 46
Bitcoin trades near $75k on Monday after a failed push above $80k. ETF outflows were the heaviest since early July and short-term holders are near break-even, while leverage and demand for protection stay high.


Overview
Bitcoin trades near $75k on Monday, down more than 4% from last Sunday's close, after a push above $80k on Wednesday reversed the next day. The slide resumed on Sunday and left the price at its lowest close since August. ETF investors kept selling: the funds saw outflows on four of five trading days, the heaviest weekly total since early July, and ETF MVRV sits below its low band as their profit cushion thins.
Derivatives traders cut some risk without clearing it. Perpetual takers sold hard into Thursday's drop and again on Sunday, when long liquidations picked up, yet futures open interest holds in the upper part of its range and longs keep paying funding well above its high band. Options traders still pay for protection, with the 25-delta skew above its high band, while the volatility spread fell back inside its range as realized volatility caught up with the swings.
Spot buyers did not fill the gap, as spot CVD turned negative even while volume rose. On-chain, the sell-off drew heavy activity: transfer volume and active addresses sit above their high bands and fees picked up, a sign of repositioning rather than a quiet market.
Supply keeps shifting to newer hands: the short-term to long-term holder supply ratio and the hot capital share stay above their high bands. Short-term holders are now near break-even, and realized losses clearly outweigh profits. In short, ETF selling and fragile short-term holders weigh on price, but part of the leverage has been flushed and momentum no longer confirms the decline.
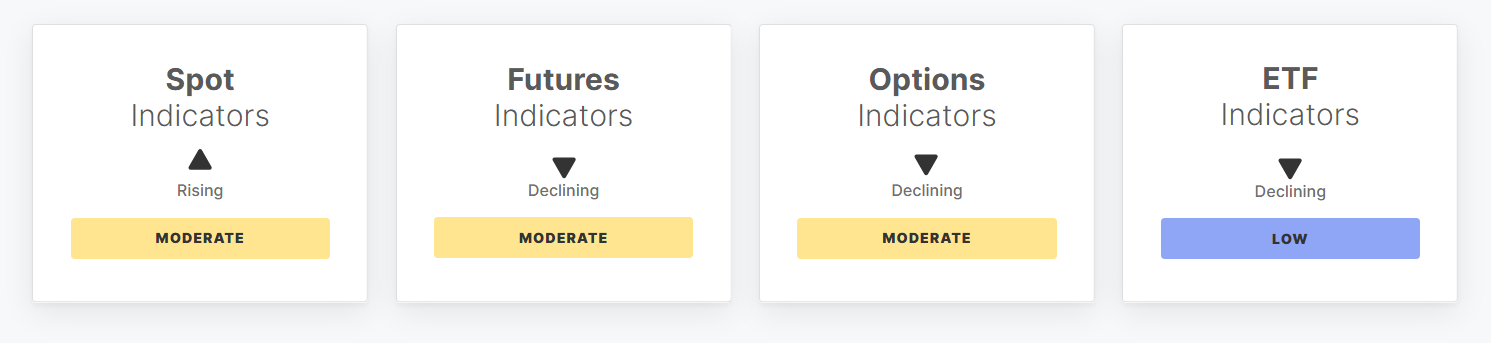
Off-Chain Indicators
Read every off-chain indicator
Spot Indicators
Price Momentum. Increased by 4.8% to 34.9 compared to 33.3 seven days ago. Price Momentum dipped below its low band on Tuesday, then recovered to the bottom of its range and ended the week slightly higher even as the price set a new low on Sunday. Momentum stays weak, but it no longer confirms the decline, a sign that the selling has lost some of its force.
Spot CVD. Decreased by $98.5M to -$91.8M compared to $6.6M seven days ago. Spot CVD turned negative and slipped into the lower part of its range, as spot selling in Thursday's drop outweighed the buying that lifted Wednesday's rally. Cash market takers kept selling into the weekend, so spot demand is not absorbing the decline, although the selling is orderly and well short of its low band.
Spot Volume. Increased by 13.3% to $6.4B compared to $5.6B seven days ago. Spot Volume rose into the upper part of its range, lifted by the heaviest trading of the week during Wednesday's rally and Thursday's reversal. Turnover eased into the weekend but stays elevated, which points to active repositioning in the cash market around the swing rather than a quiet drift lower.
Futures Indicators
Futures Open Interest. Decreased by 1.1% to $37.0B compared to $37.4B seven days ago. Futures Open Interest eased lower but holds in the upper part of its range, as positions closed in Thursday's drop and again on Sunday, when long liquidations picked up. The unwind is partial, so a large stock of leverage remains in the market and keeps it sensitive to sharp swings.
Long-Side Funding Payment. Decreased by 7.1% to $2.9M compared to $3.1M seven days ago. Long-Side Funding Payment stays well above its high band, though it eased as funding rates cooled during the slide. Longs keep paying a sizeable premium to hold exposure after a losing week, so bullish positioning in perpetuals has thinned without clearing, and the long side of the market stays crowded.
Perpetual CVD. Increased by $59.2M to -$549.5M compared to -$608.7M seven days ago. Perpetual CVD moved back inside its range as perpetual takers chased Wednesday's rally, but heavy selling in Thursday's reversal and again on Sunday pushed it to the bottom of its range. Leveraged traders still lean to the sell side, though with less force than in the week before.
Options Indicators
Options Open Interest. Decreased by 3.3% to $32.4B compared to $33.5B seven days ago. Options Open Interest dipped below its low band on Thursday as last month's expiry rolled through the seven-day average, then recovered to the bottom of its range. Traders added contracts after the expiry, most of all around Wednesday's rally, so the lower reading reflects that reset rather than traders cutting exposure.
Volatility Spread. Decreased by 45.5% to 22.1% compared to 40.6% seven days ago. Volatility Spread fell back below its high band on Sunday, as realized volatility rose with Thursday's swing while implied volatility held steady. Options still price more turbulence than the market delivers, but the gap has narrowed sharply, so option buyers now pay a smaller premium over realized moves than last week.
Options 25-Delta Skew. Decreased by 3.7% to 11.1% compared to 11.5% seven days ago. Options 25-Delta Skew stays above its high band, with puts priced well over calls all week and a spike in demand for downside protection during Thursday's drop. The easing since then leaves the picture unchanged: positioning remains defensive, and hedging rather than bullish speculation sets the tone in options.
ETF Indicators
US Spot ETF Netflow (Weekly). Decreased by $900.0M to -$1.6B compared to -$701.2M seven days ago. US Spot ETF Netflow (Weekly) fell further below its low band as the funds saw outflows on four of five trading days, the heaviest weekly withdrawal since early July. TradFi investors are pulling capital rather than buying the dip, which removes a steady source of spot demand as the price slides.
US Spot ETF Trade Volume (Weekly). Decreased by 0.7% to $13.1B compared to $13.2B seven days ago. US Spot ETF Trade Volume (Weekly) climbed further above its high band into Thursday's drop, then slipped back below it on Friday as the previous week's heavy sell-off session left the weekly window. Turnover still sits at the top of its range, so investors keep trading the funds actively through the decline.
US Spot ETF MVRV. Decreased by 1.4% to 1.30 compared to 1.32 seven days ago. US Spot ETF MVRV sits below its low band, apart from a brief recovery with Wednesday's rally, and the average ETF holder now holds the thinnest unrealized profit since August. A shrinking cushion makes these investors more sensitive to further declines, consistent with the steady outflows from the funds.
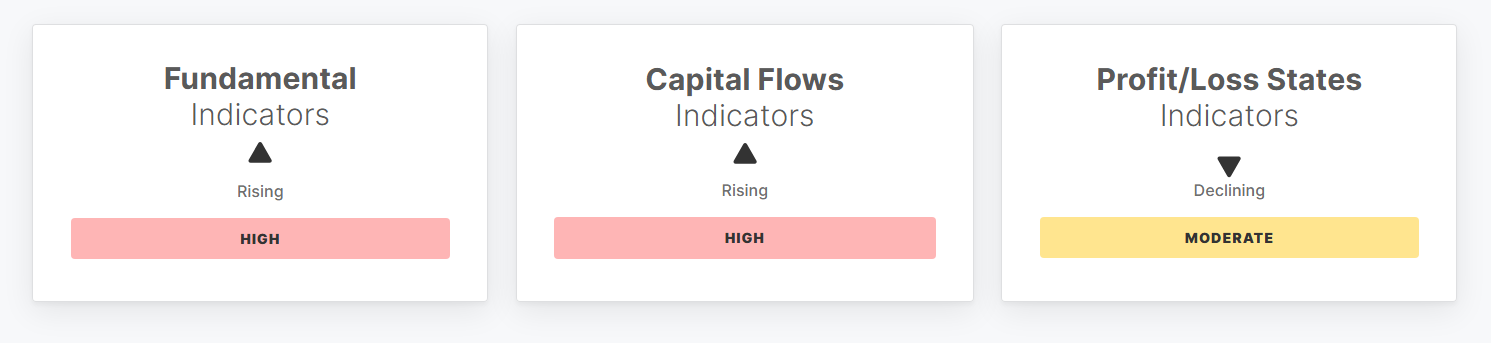
On-Chain Indicators
Read every on-chain indicator
Fundamental Indicators
Total Fee Volume. Increased by 12.5% to $228.2K compared to $202.8K seven days ago. Total Fee Volume jumped with Thursday's drop and now sits in the middle of its range, as the sell-off pushed more users to move coins at once. The pickup follows the volatility rather than a broad rise in network use, and fees stay well short of the congestion seen in busier phases.
Entity-Adjusted Transfer Volume. Increased by 0.7% to $5.7B, roughly level with seven days ago. Entity-Adjusted Transfer Volume stays above its high band, with heavy settlement between distinct entities through Thursday's drop before a quiet weekend. Holders moved coins at an unusually fast pace around the sell-off, a sign of active repositioning on-chain rather than indifference to the price swings.
Daily Active Address Count. Increased by 1.8% to 670.6K compared to 658.8K seven days ago. Daily Active Address Count moved above its high band and held there all week, with participation peaking on Thursday as the sell-off drew users onto the network. The broader activity fits the heavy transfer volume and shows engagement driven by the price swings, not a market that has gone quiet.
Capital Flows Indicators
Realized Cap Change (Monthly). Decreased by 44.4% to 0.49% compared to 0.89% seven days ago. Realized Cap Change (Monthly) slipped back inside its range and kept easing all week, now sitting in the upper part of its range. Capital still flows into the network on a monthly basis, but the pace is fading fast, and the realized cap itself edged lower as coins changed hands at lower prices.
STH to LTH Supply Ratio. Increased by 2.6% to 15.1% compared to 14.7% seven days ago. STH to LTH Supply Ratio stays above its high band and edged higher, as newer holders account for a growing share of the supply. A heavier short-term holder base raises the market's sensitivity to price swings, since these coins carry thin profits and tend to be the first to move under stress.
Hot Capital Share. Increased by 0.6% to 21.9% compared to 21.8% seven days ago. Hot Capital Share stays well above its high band and edged higher, so a large share of the supply still sits with buyers from the last three months. These recently acquired coins are the most price-sensitive part of the market, which leaves it more reactive than usual to further swings in price.
Profit/Loss States Indicators
Percent Supply in Profit. Decreased by 3.8% to 60.6% compared to 62.9% seven days ago. Percent Supply in Profit fell steadily to the middle of its range as each lower close pushed more coins under water. The profitable share is shrinking but stays clear of its low band, so the market is cooling rather than capitulating, and fewer holders now sit on gains that could tempt them to sell.
Net Unrealized Profit to Loss Ratio. Decreased by 67.1% to 1.1% compared to 3.4% seven days ago. Net Unrealized Profit to Loss Ratio fell to just above break-even and sits in the middle of its range, as the slide erased most of the paper gains of short-term holders. By Sunday the group as a whole had slipped into a small unrealized loss, a test of conviction for recent buyers.
Realized Profit to Loss Ratio. Decreased by 0.42 to -0.63 compared to -0.21 seven days ago. Realized Profit to Loss Ratio sank deeper below parity into the bottom of its range, as coins spent on-chain locked in losses well ahead of profits after Thursday's drop. Loss realization now clearly dominates, a sign of fear-driven selling, although the reading has not reached its low band.
🔗 Access the full report in PDF

- Follow us and reach out on X
- Join our Telegram channel
- For on-chain metrics, dashboards, and alerts, visit Glassnode Studio
Disclaimer: This report does not provide any investment advice. All data is provided for information and educational purposes only. No investment decision shall be based on the information provided here and you are solely responsible for your own investment decisions.
Exchange balances presented are derived from Glassnode’s comprehensive database of address labels, which are amassed through both officially published exchange information and proprietary clustering algorithms. While we strive to ensure the utmost accuracy in representing exchange balances, it is important to note that these figures might not always encapsulate the entirety of an exchange’s reserves, particularly when exchanges refrain from disclosing their official addresses. We urge users to exercise caution and discretion when utilizing these metrics. Glassnode shall not be held responsible for any discrepancies or potential inaccuracies.
Please read our Transparency Notice when using exchange data.
